How are the reservoirs in the Apalachicola-Chattahoochee-Flint River Basin managed?
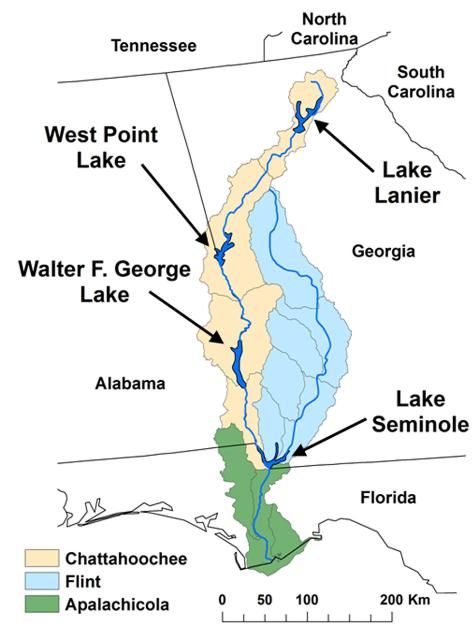
The United States Army Corps of Engineers (USACE) manages many reservoirs and dams throughout the United States, including in the Apalachicola-Chattahoochee-Flint (ACF) river basin (Figure 1). The reservoirs are managed for multiple uses and demands. Many uses of the ACF depend on how the USACE operates dam releases from the reservoirs when managing lake levels and downstream river flows and water levels. However, no single set of protocols equally suited to all uses and demands governs the reservoir releases. The timing and quantity of flow to the Apalachicola River and Bay depend on flow from both the Chattahoochee and Flint Rivers upstream. The purpose of this publication is to describe how the USACE manages reservoirs and dams in the ACF and how the waters in the basin are used.
Credit: Christopher J. Martinez
Why does the USACE manage the reservoirs in the ACF?
The major reservoirs in the ACF river basin managed by the USACE include Lake Sidney Lanier, West Point Lake, Walter F. George Lake on the Chattahoochee River, and Lake Seminole where the Chattahoochee and Flint Rivers meet (Figure 1). The USACE manages these reservoirs in the ACF for multiple purposes (USACE 2012b):
- Flood control
- Hydropower
- Navigation
- Water supply
- Habitat and water quality
- Recreation
The following sections describe these uses in more detail.
Flood Control
A portion of the volume of each reservoir is dedicated to flood control. During heavy rain, this volume of the reservoir is allowed to fill to prevent flooding downstream. Following a storm, this water is gradually released so the volume of the reservoir dedicated to flood control is available for the next storm.
Hydropower
Hydropower is generated in the ACF primarily to meet peak energy demands. Peak energy demands typically occur during extreme hot or cold weather when more people use air-conditioning or heating. During these peak demands, water is released from reservoirs through turbines, and the force of the falling water is converted into electricity. A minimum amount of hydropower is guaranteed to those who purchase it, so some hydropower releases occur even during low lake levels.
Navigation
To maintain navigation for boat and barge traffic, river water levels are maintained at a certain depth by releasing water from reservoirs during specific periods in the summer and early fall. These navigation "windows" are usually 10-day periods typically scheduled every 30 days. Navigation channels are maintained by the USACE from the mouth of the Apalachicola River up to Columbus, GA, on the Chattahoochee River and to Bainbridge, GA, on the Flint River. However, the navigation channels have not been dredged since 2000.
Water Supply
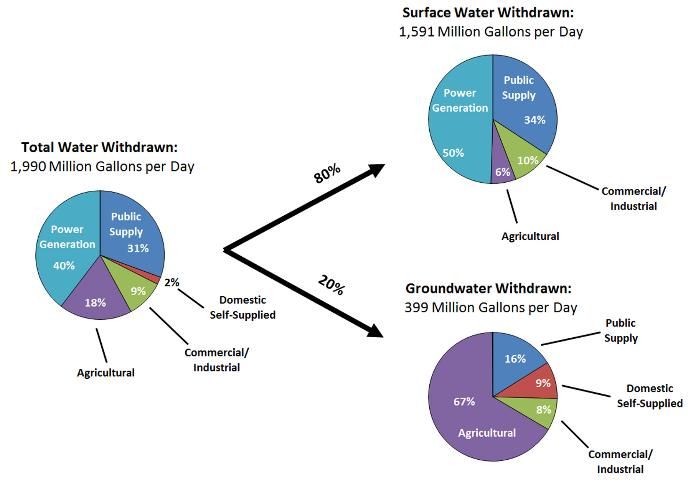
Municipalities, industries, agriculture, individual residents, and power plants all use ACF waters as a water supply source (Figure 2) (Marella and Fanning 2011). Both surface water and groundwater are used; surface water is the primary source in the basin's upper portion, while groundwater is the primary source in the basin's lower portion. A strong connection between surface water and groundwater exists in the lower portion of the basin. Thus, water withdrawn from the ground for municipal, industrial, agricultural, and residential uses has the potential to impact flow and water levels in the rivers. Unless otherwise noted, the following information on water use in the ACF is from Marella and Fanning's report (2011).
Credit: Christopher J. Martinez
Several municipalities use the rivers as their public water supply source, particularly along the Chattahoochee River where groundwater is less abundant. A significant portion of the water withdrawn from the reservoirs, directly from the rivers, or from the ground, is eventually returned to the rivers after undergoing treatment at water reclamation facilities.
In 2005, water reclamation facilities in the ACF basin treated 413 million gallons of wastewater per day, with 99% of it discharged to rivers and streams. The remaining 1% was used in land application systems (e.g., spray fields, drain fields, and percolation ponds) and reuse systems (often used for irrigation purposes). Comparing the total amount of water used for public supply (609 million gallons per day) to the amount of wastewater treated indicates that approximately 67% of the water withdrawn is returned to the rivers. However, this estimate does not account for any stormwater that may enter sanitary sewer systems during periods of wet weather.
Self-supplied domestic water withdrawals include private wells that serve households and small public supply systems not included in the public supply category in Marella and Fanning's report (2011). These small public supply systems had an average daily pumping rate of less than 0.01 million gallons per day. In 2005, approximately 13% of the population in the ACF basin (nearly half a million people) was considered self-supplied.
There are several commercial and industrial uses of water in the ACF basin. Commercial users include hospitals, schools, prisons, government facilities, and military facilities. Industrial users include paper mills, mining, and various manufacturing activities. The industrial uses include water used for processing, fabrication, washing, and cooling. Commercial and industrial sources of water include both groundwater and surface water in the basin (Figure 2). Many commercial and industrial users obtain their water from public water supply systems and are reported in that category. The commercial/industrial category in Figure 2 represents those users who are self-supplied.
Agricultural water uses include water withdrawals for crop irrigation, water withdrawals for nonirrigation farm uses such as watering of livestock, washing farm equipment, fish farming, and other uses, and water withdrawals for golf course irrigation. In 2005, 98% of the agricultural water use was for crop irrigation, with the other 2% for nonirrigation farm uses and golf course irrigation. The majority of irrigated farmland is in southwestern Georgia and irrigated areas make up 12% of the Flint River watershed (Couch, Hopkins, and Hardy 1996; Hook et al. 2005).
Water used for power generation includes power plants that use water for cooling purposes (e.g., coal and nuclear plants), and does not include hydropower plants. Nearly all of the water used for power generation is returned to the river after it is used. However, the increased temperature of the water returned to the river is sometimes an environmental concern and is discussed in more detail in the following section.
Habitat and Water Quality
Water releases from several of the reservoirs are operated to maintain minimum flows to the rivers for environmental protection (Table 1). Water is released from Lake Lanier and West Point Lake to maintain a minimum flow in the Chattahoochee River for the dilution of treated municipal wastewater. This dilution of wastewater is intended to ensure healthy aquatic life. Water is also released from the Walter F. George Lake to prevent thermal pollution downstream of the Farley Nuclear power plant. The plant uses water from the Chattahoochee River for cooling purposes and returns the water to the river after it is used.
In the Apalachicola River, minimum flows are maintained with the intention of protecting the economically important shell fish fishery in Apalachicola Bay and with the intention of protecting threatened and endangered species including the Gulf sturgeon (threatened), purple bankclimber mussel (threatened), and fat threeridge mussel (endangered). Apalachicola Bay is home to one of the most productive shell fish fisheries in the United States producing about 90% of Florida's and 10% of the nation's oyster catch. Apalachicola Bay seafood products support up to 80% of the jobs in Franklin and surrounding counties, so a healthy Apalachicola Bay, and a healthy seafood industry is vital to the economic prosperity of this region. Because of connections between the Apalachicola River and Apalachicola Bay, local communities and community leaders are very aware of water policy choices within the ACF basin. The effectiveness of the current minimum flow levels designed to protect Apalachicola Bay and River are critical for developing effective water policies in the ACF basin.
Recreation
The reservoirs, rivers, streams, and surrounding areas in the ACF are heavily used for recreation. Common recreational activities include boating, canoeing, camping, tubing, swimming, and fishing. Maintaining downstream river levels is important for activities such as boating, kayaking, and canoeing. Steady lake levels are needed for recreational access to the lakes, boating safety, and sport fisheries. The USACE holds lake levels stable as much as feasible during fish spawning periods to encourage sizeable sport fish populations in the lakes.
Recreation in the ACF has a significant impact on the local economy, particularly around Lake Lanier. Lake Lanier has more than 7.5 million visitors annually, making it the most visited USACE reservoir in the nation (USACE 2012c). Extreme drought during the prime visitation season (May through October) results in fewer visitors because of the low lake levels. Drought conditions in 2008 resulted in an estimated 800,000 fewer visitors than the previous year according to an economic impact analysis conducted for the 1071 Coalition (Bleakly Advisory Group, Inc. et al. 2010). In 2008 lake levels were reduced to the point that many boat docks along the lake shore were dry.
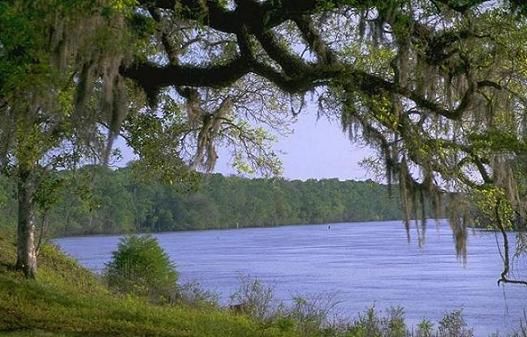
Credit: USDA
How does the USACE manage the reservoirs in the ACF?
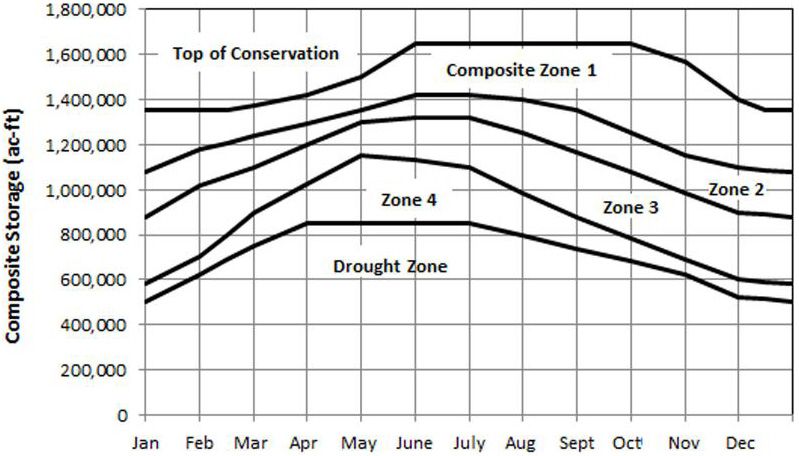
Decisions are made daily on how to manage water in the reservoirs in the ACF. The reservoirs in the ACF are often operated as a single unit, where flow needs at some downstream location could call for releases from upstream reservoirs. Releases are guided by "action zones" based on the composite storage of the reservoirs (Figure 4). The composite storage is the sum of the storage in Lake Lanier, West Point Lake, Water F. George Lake, and Lake Seminole (USFWS 2008). These action zones are used to manage the lakes at the highest level possible for recreation and other purposes, while also meeting hydropower needs and downstream needs for navigation, water supply, recreation, and habitat and water quality protection (USACE 2012b). The action zones are based on the time of the year, taking into account typical wet and dry seasons and recreational use.
Credit: Christopher J. Martinez
The action zones in Figure 3 are defined as follows (USACE 2012b; USFWS 2008):
- Zone 1: Releases can be made to support navigation, hydropower, water supply, and water quality.
- Zone 2: Releases for navigation may be limited. Releases for hydropower are at a reduced level. Releases are made for water supply and water quality.
- Zone 3: Releases for navigation may be significantly limited. Releases for hydropower are at a reduced level. Releases are made for water supply and water quality.
- Zone 4: Releases for navigation are not supported. Releases for hydropower are at the minimum level. Releases are made for water supply and water quality.
- Drought Zone: Once the composite storage drops into the drought zone, releases to the Apalachicola may be lowered from 5,000 cfs to 4,500 cfs. When the composite storage rises above the drought zone, releases return to 5,000 cfs. The drought zone is approximately the sum of the "inactive" storage of Lake Lanier, West Point Lake, Walter F. George Lake, plus the Zone 4 storage of Lake Lanier. The inactive storage is the volume of the reservoirs designed for storing sediment that enters the reservoir. The water in the inactive zone typically has poor water quality and is typically not used for water supply or discharge downstream.
The decisions guided by the action zones give a general picture of how the reservoirs in the ACF are managed. There are more detailed guidelines for releases from Lake Seminole to the Apalachicola River (Table 2). These guidelines are known as the Revised Interim Operating Plan (RIOP). The RIOP was proposed by the USACE in 2008 and will govern releases from Lake Seminole until a new Water Control Plan for the ACF is developed (USFWS 2008). While the RIOP describes the releases from Lake Seminole only, the reservoir does not contain enough storage to support these releases itself. Therefore, the RIOP also governs releases from reservoirs farther upstream to provide adequate water for the releases from Lake Seminole.
Releases made to the Apalachicola River from Lake Seminole reflect the result of the system-wide operation of the ACF. The major determinants for releases are the time of year, the available storage in the reservoirs, basin inflow, and flow needs in the Apalachicola River. The release levels vary by three seasons: spawning season (March through May), nonspawning season (June through November), and winter (December through February). Regardless of the season, when the composite storage reaches Zone 4, releases to the Apalachicola are reduced to 5,000 cfs or to 4,500 cfs if the composite storage is in the drought zone. The values in Table 2 are minimum values and not necessarily prescribed releases. Actual releases may be greater to meet other purposes such as hydropower, flood control, etc.
References
Bleakly Advisory Group, Inc., Seaman, B.A., and PBS&J. 2010. Lake Sidney Lanier Economic Impact Analysis. Final Report. Prepared for the 1071 Coalition. Accessed February 2013. http://lakelanier.org/wp-content/uploads/2012/03/Lake-Lanier-Economic-Impact-Analysis-Final-Report.pdf.
Bryan, C.H., and S. Rose. 2006. "Stakeholder Issues in the ACT and ACF Systems." In Interstate Water Allocation in Alabama, Florida, and Georgia, edited by J.L. Jordan and A.T. Wolf, 30-48. Gainesville: University Press of Florida.
Couch, C.A., E.H. Hopkins, and P.S. Hardy. 1996. Influences of Environmental Settings on Aquatic Ecosystems in the Apalachicola-Chattahoochee-Flint River Basin. U.S. Geological Survey Scientific Investigations Report 95-4278. https://pubs.usgs.gov/wri/wrir95-4278/.
Hook, J.E., K.A. Harrison, G. Hoogenboom, and D.L. Thomas. 2005. Ag Water Pumping: Final Report of Statewide Irrigation Monitoring. Project Report 52. EPD Cooperative Agreement Number: 764-890147, UGA ID 25-21-RF327-107. Atlanta, GA: Ga. Geol. Survey, Envir. Protection Div. http://www.nespal.org/SIRP/AWP/AWP_I_Final_Report.shtml.
Marella, R.L., and J.L. Fanning. 2011. Water Withdrawals, Wastewater Discharge, and Water Consumption in the Apalachicola-Chattahoochee-Flint River Basins, 2005, and Water-Use Trends, 1970-2005. U.S. Geological Survey Scientific Investigations Report 2011-5130. https://pubs.usgs.gov/sir/2011/5130/.
United States Army Corps of Engineers (USACE). 2012a. 2012 ACF Basin Composite Conservation & Flood Storage. Accessed May 2012. https://water.sam.usace.army.mil/ACFconstorage.pdf.
USACE. 2012b. How the River Systems Are Managed. Accessed May 2012. https://water.sam.usace.army.mil/narrativ.htm.
USACE. 2012c. Lake Sidney Lanier. Accessed May 2012. https://www.sam.usace.army.mil/Missions/Civil-Works/Recreation/Lake-Sidney-Lanier/.
United States Fish and Wildlife Service (USFWS). 2008. Description of Proposed Action Modification to the Interim Operations Plan at Jim Woodruff Dam. Accessed January 2023. https://www.sam.usace.army.mil/Portals/46/docs/planning_environmental/acf/acf_info/docs/ProposedActionDescription-Modification_to_IOP.pdf.
USFWS. 2012. "Biological Opinion on the U.S. Army Corps of Engineers, Mobile District, Revised Interim Operating Plan for Jim Woodruff Dam and the Associated Releases to the Apalachicola River." U.S. Fish and Wildlife Service News Release. Accessed January 2023. https://www.sam.usace.army.mil/Portals/46/docs/planning_environmental/acf/acf_info/docs/Final%20BO%20for%20RIOP%206-1-2008.pdf.
