AgroClimate Crop Season Planning Tool: Reducing the Risk of Extreme Weather Events During Key Stages of Crop Development
Introduction
Inherent to agricultural production is the assumption of risk. Government policies, economic markets, farm supply availability, and weather and climate variability all influence production and are often beyond growers' control. However, measures can now be taken to manage risks and uncertainties associated with weather and climate. This publication details a new tool available to growers and Extension professionals to manage risks related to climate during seasonal planning stages. The Crop Season Planning tool is a climate-based tool that enables growers to plan planting strategies that will minimize risk to climate extremes based on historical climate data at their location. The target audience consists of maize, cotton, wheat, and soybean growers, consultants, and Extension professionals in Florida.
Increasing climate extremes, such as multi-year droughts, intense precipitation, and heat waves, are among the most serious problems affecting the agricultural industry around the world (Asseng et al. 2016; Siebert and Ewert 2014; Teixeira et al. 2013). Extreme temperature and precipitation have important implications for the US economy because they increase the probability of reduced crop yields. In 2012, extremes in night-time temperatures resulted in $220 million in damage to the cherry industry in Michigan (Hatfield et al. 2014). That same year, the combination of drought and heat stress reduced corn production in the US Midwest by 13% compared to the previous year (NASS 2013). High temperatures, rainfall, and humidity create an environment conducive to fungal disease outbreak. They also impact the reproductive cycle of other pests that vector disease. Increased probability of extreme events makes it likely that producers will face even greater uncertainties in the future.
Many factors that influence agricultural production, such as government policies, economic markets, farm supply availability, and weather and climate variability, are beyond growers' control. However, measures can be taken to manage risks and uncertainties associated with weather and climate. High temperatures, rainfall, and humidity create an environment conducive to fungal disease outbreak. They also impact the reproductive cycle of other pests that vector disease.
Although extreme weather events can be detrimental during all stages of crop development, certain growth stages are particularly sensitive to extremes in temperature and/or precipitation. Reproductive stages are particularly susceptible to heat or water stress, which can result in early or delayed flowering, defects in parental tissue, defects to male and female germ cells, and development of male and female flowers at different times (Barnabas, Jager, and Feher 2008; Zinn, Tunc-Ozdemir, and Harper 2010).
Recent efforts to help land managers reduce weather- and climate-related risks have included the development of forecast-based decision-support and information tools. These are systems for plant diseases (Pavan, Fraisse, and Peres 2011), nutrient management, irrigation scheduling (Migliaccio et al. 2016), and greenhouse gas emissions calculators. The AgroClimate system (http://agroclimate.org) includes dynamic climate-related information using real-time and historical data to manage in-season decisions related to weather (Fraisse et al. 2006; Fraisse et al. 2015).
A new web-based climate tool that minimizes exposure to climate risk, called the Crop Season Planning tool, is presented in this publication. A pre-season assessment of extreme weather during sensitive development stages will help growers minimize the likelihood of extreme weather-related yield loss. An ability to predict crop growth stages, such as flowering and maturity, will also help growers with the planning of field operations, including spraying and harvesting.
How does the Crop Season Planning tool work?
The Crop Season Planning tool (http://cloud.agroclimate.org/tools/sowing-plan/v1/#/main) consists of two parts. The first part of the tool requires the following information: crop, variety, planting date, latitude, solar radiation, maximum and minimum daily temperature, sowing depth, and maturity class. The tool then uses historical temperature data to calculate growing degree days (GDD) to predict crop growth. Sowing depth affects emergence date, and solar radiation is used to estimate soil temperature. Crop variety and maturity class are used to predict flowering and maturity. The tool uses records from the weather station closest to the grower, calculates the timing of crop growth on a year-by-year basis, and returns a time window for each crop development stage.
The second part of the tool calculates the probability of extreme high temperature, low temperature, and duration of drought during each growth stage. Meteorological data are derived from the Florida Automated Weather Network (FAWN) (https://fawn.ifas.ufl.edu). Users can chose the high temperature threshold (86°F, 90°F, or 95°F), low temperature threshold (28°F, 32°F, or 35°F), and dry spell duration (7-, 10-, or 15-day long) at which they believe the crop will experience stress. Historically, a day is defined as "dry" when the amount of rainfall is less than 0.1 inches. The choice of thresholds are intended to reflect environmental conditions to which many crops have shown sensitivity. For example, a daily maximum temperature of 86°F or higher during pollination is associated with a decrease in corn yield (Lobell et al. 2011; Butler and Huybers 2015). When a field location is farther than 30 miles from the nearest weather station, the tool returns a "No weather station available" warning to ensure that the weather data are representative of the field being evaluated.
The Crop Season Planning tool allows the user to adjust variety and planting date information for corn, cotton, soybean, and wheat and estimate the probability of in-season exposure to extreme events. This can be done weeks or months prior to planting.
How to Use the Crop Season Planning Tool
-
Create an account and log into the system using your username and password.
-
Select "Add Field" and drag the red marker to the desired location, scrolling to zoom in or out on the map. In the top right corner, a layer symbol allows the user to view a satellite image of the area.
-
Enter field name and acreage.
-
Select the weather station closest to the field.
-
Select the soil texture type.
-
Save.
On the New Crop Season page (Figure 1), the user enters crop season specifics, including the anticipated planting date, crop, variety, and planting depth. The user can choose from a list of four crops: cotton, maize, soybean, and wheat. Users can select a variety or create their own for future reference. Planting depth and threshold for extreme high temperature, low temperature, and dry spell duration must be selected from a drop-down menu. Lastly, the user selects the growth stages of interest, which tend to be those that are associated with management decisions. After verifying that the information is correct, the user selects "Simulate the Crop Season."
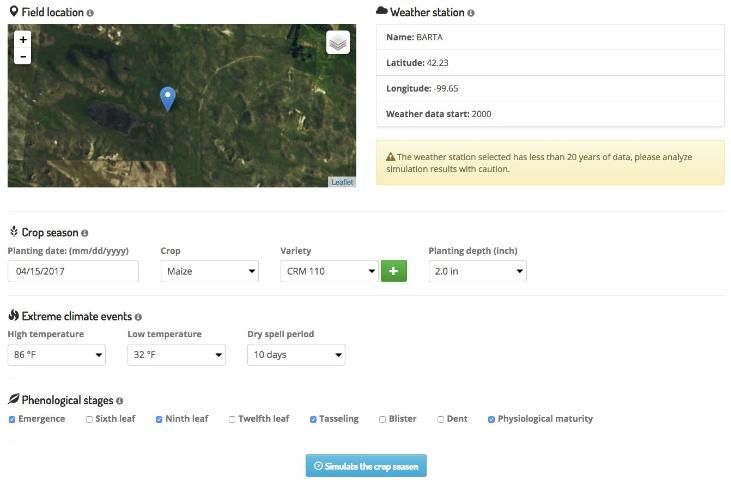
Credit: http://agroclimate.org
Model Output
The Crop Season Planning tool returns two outputs:
-
A predicted time window for the occurrence of each of the selected growth stages, and
-
The probability that extreme weather events will occur during those stages.
The results are displayed on a graph (Figure 2) that shows the date on the x-axis and probability of weather extremes on the y-axis. The planting date appears as a vertical green line on the left side of the chart, and the time window corresponding to the developmental stages of interest appears as shaded gray bars with corresponding labels. The probability curves for extreme high temperature, extreme low temperature, and dry spell duration are presented as red, blue, and yellow lines, respectively. The shaded areas on each side of the line indicate with 95% confidence where the probability value is likely to fall. As uncertainty increases, the width of the range also increases. This tends to happen as record length decreases and probability values approach 50%. By hovering the cursor over the tooltip icon in the top left corner of the graph, the user can access information that facilitates the interpretation of the chart. By hovering the cursor over specific points along the curve, the user can visualize the probability of extreme weather events occurring on any given day during the growing season. To zoom in and out, the user may select a time scale in the left corner of the figure or drag the time slide located beneath the figure. Historic simulations can also be displayed by clicking on the drop-down menu in the top right corner of the figure. These can be exported as a spreadsheet for sharing with growers. Likewise, the chart may be downloaded by clicking on the chart menu symbol located at the top right corner of the chart.
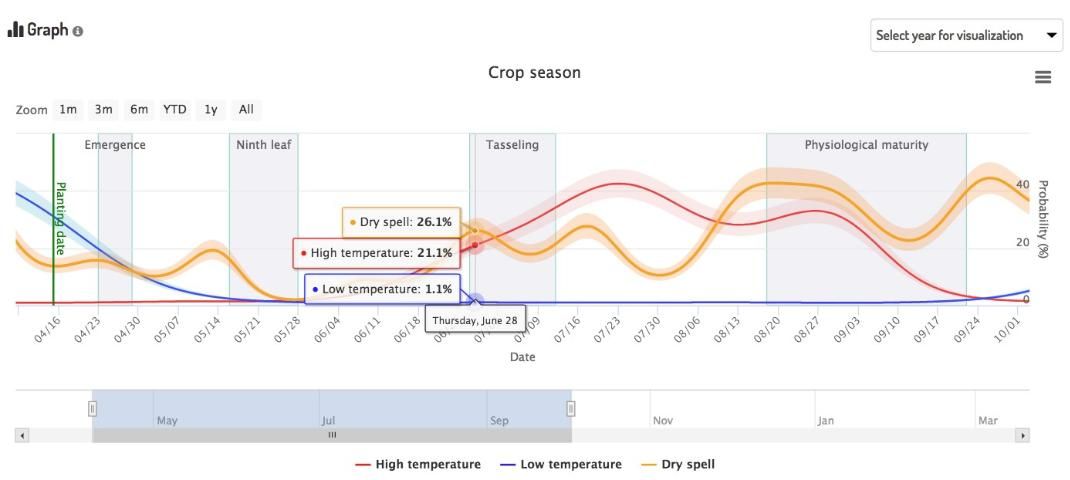
Credit: UF/IFAS
The risk of weather extremes during the tasseling period for a corn crop planted on April 15, 2017 near Gordon, FL with a crop relative maturity (CRM) of 110 days is highlighted in Figure 2. Based on 33 years of data derived from the nearest FAWN weather station in Gordon, the probability of 90°F weather occurring during the tasseling period is 21.1%. The probability of 32°F weather is 1.1%, and the probability of a 10-day dry spell is 26.1%.
To visualize a different scenario, the user can simply return to the previous page and choose a new combination of inputs. When an optimal scenario has been identified, the user may click on the "Save" button beneath the chart to keep the scenario in the system.
Crop Season Planning Tool Evaluation
In a collaborative effort to test the accuracy of the predicted timing of crop growth, five farmers and Extension agents from Georgia, Alabama, and Florida collected information on the timing of corn, cotton, and soybean development on the farm during the 2016 growing season. We compared the resulting dates with those that had been predicted by the computer model at each location. The predictions were less than two days off on average, except for the "dent" stage, which was 22 days late. We are working on improving the characterization of dent within the computer model in order to improve model performance. Our collaborators concluded that the tool performed well overall and requested that we include more crops, more growth stages, and a risk of disease development.
What are the limitations?
The Crop Season Planning tool allows farmers, consultants, and Extension professionals to improve production through pre-season planning based on historical climate data. However, the distance between the field and the nearest weather station influences the tool's performance, especially in areas subject to microclimates.
Probabilities of extremes are calculated based on individual station records, which vary in length. Probabilities calculated from short records are not as reliable as those derived from longer records. New weather data will continuously be added to the tool and the probabilities will be adjusted over time. However, the inherent complexity of the climate system makes it difficult to predict. The number of crop varieties and maturity classes available in the tool is also limited.
An economic analysis has yet to be conducted to quantify the impact of adopting the tool on the financial performance of the farm. Growers do not always have the ability to respond to climate-related information. In some cases, climate-related information may be relevant in a general context, but may have reduced utility when it competes with other factors in the decision-making process.
References
Asseng, S., D. Cammarano, B. Basso, U. Chung, P. D. Alderman, K. Sonder, M. Reynolds, and D. B. Lobell. 2016. "Hot spots of wheat yield decline with rising temperatures." Global Change Biology. Accessed on March 25, 2022. https://onlinelibrary.wiley.com/doi/full/10.1111/gcb.13530
Barnabas, B., K. Jager, and A. Feher. 2008. "The effect of drought and heat stress on reproductive processes in cereals." Plant, Cell and Environment 31: 11–38.
Butler, E. E. and P. Huybers. 2015. "Variations in the sensitivity of US maize yield to extreme temperatures by region and growth phase." Environmental Research Letters 10(3): 034009.
Fraisse, C. W., J. H. Andreis, T. Borba, T. Cerbaro, E. Gelcer, W. Pavan, D. Pequeno, et al. 2015. "AgroClimate: Tools for managing climate risk in agriculture." Agrometeoros 24(1): 121–129.
Fraisse, C. W., N. E. Breuer, D. Zierden, J. G. Bellow, J. Paz, V. E. Cabrera, A. Garcia y Garcia, et al. 2006. "AgClimate: A climate forecast information system for agricultural risk management in the southeastern USA." Computers and Electronics in Agriculture 53(1): 13–27. https://doi.org/10.1016/j.compag.2006.03.002
Hatfield, J., C. Swanston, M. Janowiak, and R. F. Steele. 2015. "USDA Midwest and Northern Forests Regional Climate Hub: Assessment of climate change vulnerability and adaptation and mitigation strategies." Midwest Hub. Accessed on March 25, 2022. https://www.climatehubs.usda.gov/sites/default/files/Midwest%20Region%20Vulnerability%20Assessment%203_20_2015.pdf
Lobell, D. B., M. Bänziger, C. Magorokosho, and B. Vivek. 2011. "Nonlinear heat effects on African maize as evidenced by historical yield trials." Nature Climate Change 1(1): 42–45.
Migliaccio, K. W., T. Morgan, G. Vellidis, L. Zotarelli, C. Fraisse, B. A. Zurweller, J. H. Andreis, J. H. Crane, and D. L. Rowland. 2016. "Smartphone apps for irrigation scheduling." Transactions of the ASABE 59(1): 291-301.
National Agricultural Statistics Service (NASS). 2013. Crop Production 2012 Summary. Washington, D.C.: US Department of Agriculture.
Pavan, W., C. W. Fraisse, and N. A. Peres. 2011. "Development of a web-based disease forecasting system for strawberries." Computers and Electronics in Agriculture 75(1): 169–175. https://doi.org/10.1016/j.compag.2010.10.013
Siebert, S. and F. Ewert. 2014. "Future crop production threatened by extreme heat." Environmental Research Letters 9(4): 041001. https://doi.org/10.1088/1748-9326/9/4/041001
Teixeira, E. I., G. Fischer, H. van Velthuizen, C. Walter, and F. Ewert. 2013. "Global hot-spots of heat stress on agricultural crops due to climate change." Agricultural and Forest Meteorology 170: 206–215.
Zinn, K. E., M. Tunc-Ozdemir, and J. F. Harper. 2010. "Temperature stress and plant sexual reproduction: Uncovering the weakest links." Journal of Experimental Botany 61(7): 1959–1968.
