Summary of N, P, and K Research with Eggplant in Florida
This eggplant fertilization publication is an updated version of a previous literature review by Hochmuth and Cordasco (1999, reviewed 2009) that summarized fertilizer research through 1996. This new document refers to some literature that now appears only in updated electronic format. All cited publications can be accessed in PDF format at https://bmp.ifas.ufl.edu.
The literature review includes all available published documentation concerning eggplant yield and fertilizer use in Florida since 1970. We chose to present all the research without being selective, as that would introduce bias to the presentation. Inclusion of all Florida literature shows the development of the commercial production system with respect to fertilizer use. This new review document expands on the role of irrigation in managing fertilizer for crop production efficiency and environmental protection. The audience for this publication includes educators, such as Extension specialists and agents, commercial vegetable producers, consultants, and governmental agencies. This review will help provide an updated scientific basis for fertilizer recommendations. Current eggplant fertilization recommendations are based on published field research and the compiled literature contained in this document will assist with making valid fertilizer recommendations that are both commercially viable and that reduce risk of environmental consequences in adjacent water bodies.
Eggplants are grown on small acreages in nearly all states in the country, totaling 7,000 acres. The top three states, Florida, California, and Georgia, account for the bulk of the fresh market production in the country (ERS 2006; USDA 2009). The top 5 states, including Michigan and New Jersey, account for 80% of the country's eggplant production. Eggplants were grown on 1,760 acres in Florida in the 2007 season, down 50% from the acreage in 1997, the last time this fertilizer review was done (Hochmuth and Cordasco 1999). Some of Florida's production has shifted to Georgia. Florida eggplant growers are located mostly in the southeastern part of the state, in Palm Beach and Miami-Dade counties, with additional production in Hillsborough County. Of these production areas in Florida, Southeast Palm Beach County has the greatest harvest months in April and May and a harvest season that extends from September through July.
This document is not meant to present new fertilization recommendations but rather to update the previously published research review by the same title, including new research conducted in the last decade. Current eggplant fertilization recommendations are based on published field research, and a compilation of this literature contained in this document will assist with making valid fertilizer recommendations that are both commercially viable and that reduce risk of environmental consequences in adjacent water bodies. As environmental regulations become more commonplace, fertilization recommendations must be based on published research.
This publication documents the previous written literature, some of which now appears only in updated modern electronic format. All publications, including the reviewed older paper-format publications, will be placed in PDF on the website https://bmp.ifas.ufl.edu for future reference.
The fertilizer recommendations not only provide the recommended rate of fertilizer but also the management strategies for getting the most out of the fertilizer investment while protecting the environment. Hochmuth and Hanlon (2010a) summarize these principles for vegetable crops. Sound fertilizer recommendations also consider fertilizer materials, irrigation, placement, and timing of application, among other aspects (Hochmuth and Hanlon 2010b).
Fertilizer is a major part of the crop production expenses for eggplant but is critical for successful crop yields and high fruit quality. More than 40 years worth of eggplant fertilization research has been conducted in Florida. During this time many changes have occurred in eggplant production practices including changes in cultivars and the introduction of new cultural systems, including polyethylene mulch and drip irrigation. The research reported herein covers eggplant production with polyethylene mulch. Eggplant crop and fertilizer management recommendations, such as plant and row spacing, have changed with time in keeping with new developments in research (Hart et al. 1974; Hochmuth and Maynard 1996; Montelaro 1978; Hochmuth 1988a; 1996a; 1996b; Hochmuth and Hanlon 1989; 1995a; 1995b; 2000; Hochmuth and Smajstrla 1997; Kidder et al. 1989; Olson and Santos 2010; Santos et al. 2010; Simonne and Hochmuth 2010; Shuler and Hochmuth 1990). The most current recommendations for nutrient management in eggplant production are presented in the Commercial Vegetable Production Handbook for Florida (Olson and Santos 2010). University of Florida Institute of Food and Agricultural Sciences (UF/IFAS) recommends a target of 200 lb/acre N and 160 lb/acre P2O5 and 160 lb/ acre K2O only when soil concentrations of phosphorus (P) or potassium (K) are very low, based on the results of M-1 soil testing (Hochmuth and Hanlon 1995a; 2000). More N can be applied to replace leached N or for extended harvesting seasons (Simonne and Hochmuth 2010).
These recommendations have been in effect for the last decade, after being revised from 108-144-144 in 1974 (Hart et al. 1974; Montelaro 1978) to 120-160-160 N-P2O5-K2O in 1989 (Hochmuth and Hanlon 1989; Kidder et al. 1989), to 160-160-160 in 1995 (Hochmuth and Hanlon 1995b), and to 200-150-150 in 2000 (Hochmuth and Hanlon 2000). Despite the recommendations, commercial growers often apply higher rates (Shuler and Hochmuth 1993) to reduce the risk of yield reductions or smaller fruit size in unfavorable (high rainfall) production conditions.
Since nutrient and water management are linked, fertilization research is summarized by irrigation method. Reviews such as this document may be used in the process of determining or revising recommendations. The fertilization recommendation addresses commercial yield and quality, the economics of crop production, and protection of the environment. Equally important is to have a mechanism available to the grower to adjust fertilization practices during the season due to leaching rains and extension of the growing season for additional harvests when market conditions are favorable. To address all of these concerns, UF/IFAS vegetable recommendations are given as a single target fertilizer rate that is projected to be sufficient for meeting the crop fertilizer needs for most growing seasons. This single target fertilizer rate is a recommended starting point and has been used historically in all vegetable fertilizer recommendations in Florida, as well as around the country. The target recommendation approach with footnotes was used by Montelaro (1978) and confirmed by Hochmuth and Hanlon (1995; 2000). The target value was derived from numerous fertilizer studies and represents a reasonable fertilizer rate that reflects the average maximum crop responses from all of the fertilizer research, not the extremes in responses. However the recommendation process recognizes some growing seasons are different, due to more leaching rains or increases in crop value than can lead to prolonged harvest windows. Hence the target fertilizer amount is accompanied by a series of footnotes that explain the addition of supplemental fertilizer during the growing season, which includes addressing leaching rains and additional harvests near the end of the season. It is logical to select a single target rate based on research that avoids excessive fertilizer applications that often reduce crop nutrient efficiency and increase the potential for environmental degradation.
Data Summary Method
Most authors chose to express rates on a per-acre basis, irrespective of variations in bed spacing among reports or experiments. Authors of a few reports chose to use the linear-bed-foot system to standardize fertilizer-rate expressions across experiments and planting patterns. In this report we attempt to specify planting patterns and fertilizer rates for each experiment as far as we can determine. Current fertilizer recommendations for eggplant are based on a 6-foot row spacing with one plant row per bed. In the Palm Beach growing area, 5-foot row spacing is standard.
Since reported eggplant yields were expressed variably as kg/ha, lb/acre, Mg/ha, and cartons or boxes per acre (33-lb box), a standardized method of summarizing statewide yields was used. In addition, vegetable yields varied depending on season, cultivar, and state location. Relative yield (RY), a calculated percentage, was used to express eggplant yield responses to fertilization. Relative yield is an accepted scientific method for summarizing and presenting data across a variety of sources and reports (Brown 1987).
In his book, C. Black (1992) summarized the advantages and disadvantages of the RY approach. There are valid statistical concerns about RY, but he concluded that, when applied properly and cautiously, the RY approach can be useful in displaying general relationships. Black demonstrated examples in his book where RY yield was helpful and where it was not. We chose the RY approach because we wanted to display the historical data without making biased decisions about what to include and what not to include in the presentation. Plotting absolute yield data in original units obviously would result in a scattering of data rendering any general interpretation impossible. Black (1992) points out that decisions can always be improved with further research, but the current data are the best we have at the time. The highest yield for each fertilizer experiment was assigned a 100% value, and other yields were expressed as a percentage of the highest yield. The actual yield corresponding to 100% RY was presented as the number of 33-lb boxes per acre. The RYs were plotted against rates of nutrient to determine how eggplant yields responded to fertilizer in Florida. The RY presentation facilitated the inclusion of data from a variety of experiments in a graphical summary of yield responses. For most studies, RYs of 90 to 100% were not significantly different.
Sometimes the argument is made that growers have expectations of greater yields than those obtained in research projects. However, realistic, regularly obtainable yields obtained by growers are often less when compared with expected yields or "yield goals." Research on this subject has documented that 20% of growers actually reached their yield goals, and only 50% reached 80% of their yield goals (Schepers et al. 1986). Therefore growers rarely achieve their stated yield goals, which means fertilizer rates should not be set upon yield goals but rather on realistic yields documented by research. This practice of using yield goals to set fertilizer rates is not recommended in Florida, so the effect of overfertilization has been avoided by grounding expectations in measurement of observed yields. In effect, the current Florida fertilizer recommendation includes a component that addresses concern expressed by growers about yield expectation versus actual production capability. Scientists have conducted many replicated demonstration studies in growers' fields with typical commercial production practices, and those studies are included in this review where possible. Excessive fertilizer was justified in times past when fertilizer was viewed as inexpensive insurance against yield loss. Research with numerous crops has shown that nutrient use efficiency declines as nutrient rate, especially N, increases. Even given the best of production systems, N use efficiency rarely exceeds 70% of the applied N. Concepts and practices for managing nutrients in vegetable production were summarized by Hochmuth (1992a; 1992b ; 2000).
Further, it has been suggested that the yields in older studies were much lower than yields obtained today. However there are older research reports within the last two decades where yields were as high as yields achieved today. The commercial weight of a box (1 and 1/9 bu) of eggplant (33 lb) was used with all data presented for the actual treatment corresponding to 100% RY. While fertilizer rate is reported in pounds per acre (lb/acre), the reader should keep in mind that the bed system and plant population used in each field may vary and require adjustments to the fertilizer rate. To address this issue, the linear bed foot concept can be used to convert among the various bed designs with and without spray rows or ditches (Hanlon and Hochmuth 1989; Hochmuth and Hanlon 2009). Additional cultural practices for commercial tomato production can be found in Chapter 2 of the Vegetable Production Guide (Simonne and Hochmuth 2010).
Keeping nutrients in the root zone and available for eggplant plant uptake requires proper irrigation management. Due to the critical nature of irrigation and drainage management with respect to nutrient uptake by the plant and possible loss of nutrients to the environment, information is regularly updated (Simonne et al. 2010).
Another useful tool for measuring nutrients and thus contributing to appropriate management of fertilizer includes plant tissue and/or plant sap sampling. For interpretation of plant and petiole sap values, see Hochmuth (1994a; 1994b) and Hochmuth et al. (1991b; 2009).
Mixed Fertilizer Trials
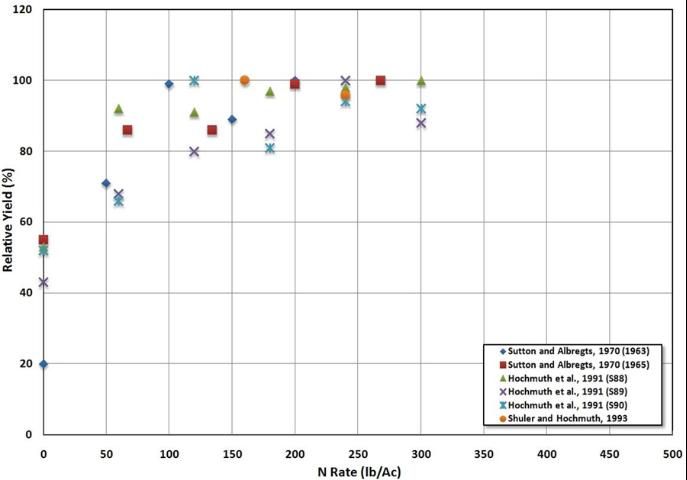
Experiments with increased rates of mixed N- P2O5-K2O fertilizers, 10-10-10, 13-4-13, or poultry manure were conducted with eggplant in the 1970s and more recently in 1996. Yield results from these studies are presented in Figure 1 as responses to changes in nitrogen (N) fertilizer since N is the most limiting nutrient in sandy soils. A separate N-response graph, Figure 2, was created for experiments where the N rate was changed, and the P and K rates remained constant.
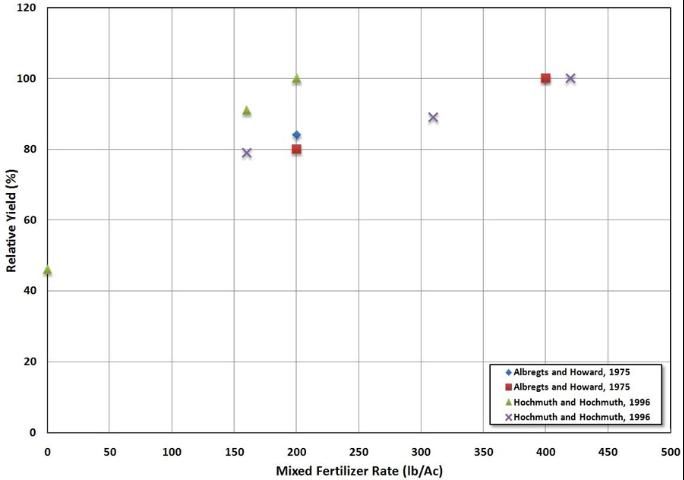
Total N applications of 200 and 400 lb/acre from a 10-10-10 (N- P2O5-K2O) fertilizer were applied in spring 1973 and 1974 experiments conducted in Dover (Albregts and Howard 1975). Four mulch treatments were evaluated for use with eggplant production: full-bed black paper or black polyethylene, strip mulch, and an unmulched treatment (control). Fertilizer sources (NH4NO3, KCl, and superphosphate) were applied in bands 1-inch deep and 4 inches from the plant, followed by mulch application and transplanting of 'Florida Market' eggplants. Unmulched treatments received four equal fertilizer applications at one-month intervals. Single-row beds were spaced 4 feet on center with plants spaced 18 inches apart; irrigation was unspecified but likely was sprinkler irrigation.
Marketable eggplant fruit yields did not differ with 200 or 400 lb/acre N in the 1973 season, resulting in 674 and 803 bushels/acre with each respective rate averaged using all mulch treatments. Higher yields, however, occurred in 1974 with the 400 lb/acre N rate (1,072 bushels/acre, 100% RY) compared to 80% RY with 200 lb/acre N. Mulched and unmulched eggplants yielded similarly both seasons, but in 1974 early yields from plants mulched with black paper or polyethylene were double those of the unmulched plants (360 compared to 173 bushels/acre). Plants mulched with strip mulch produced early yields similar to the unmulched plants. Saturation extracted soil NO3 concentrations on unmulched beds were depleted to half of those from paper- or polyethylene-mulched beds at preharvest sampling in May and June 1973, and depleted to 20% of the mulched concentrations in May and June 1974. Soil concentrations of NH4-N from unmulched beds sampled in May and June were depleted to 23% of those from paper- and polyethylene-mulched beds in 1973 and to 3.5% of soil NH4-N concentrations from all mulched beds in 1974.
Poultry manure was compared with a commercial 13-4-13 (N-P2O5-K2O) fertilizer source in the production of eggplant at an experimental site in Live Oak, Suwannee Valley Research and Education Center (Hochmuth and Hochmuth 1996). Lakeland fine sand beds, spaced on 5-foot bed centers, received 0, 160, or 200 lb/acre N from the 13-4-13 fertilizer source, or 160, 310, or 470 lb/acre N from poultry manure. Fertilizer rates were calculated on standard six-foot bed spacing. Rates of clean-out poultry manure (litter plus manure), supplied from sheltered piles, were calculated based on estimated 50% mineralization during the season. Fertilizers were broadcast 4 feet across the bed and tilled in, followed by bed formation, fumigation, and mulching with black polyethylene. 'Classic' eggplants were transplanted, and drip irrigation was applied to maintain soil moisture at -8 to -12 centibars to a 12-inch soil depth.
Early yields with 160 lb/acre N were greatest from plants fertilized with the commercial fertilizer, resulting in 517 bushels/acre compared to 311 bushels/acre with poultry manure. An increased early yield of U.S.-No.-1-grade fruit from commercially fertilized plants created the yield difference. Failure of the manure-fertilized plants to produce optimum early yields was attributed to delayed mineralization compared to the readily available commercial fertilizer. Poultry manure (310 lb/acre) at twice the N rate of the commercial fertilizer (160 lb/acre) resulted in similar total marketable yields, 1,215 and 1,274 bushels/acre, respectively. Yields were not different with either N source at rates exceeding 160 lb/acre N. Optimum yields occurred with 200 lb/acre commercial-fertilizer N (1,400 bushels/acre) and with 470 lb/acre of poultry-manure N (1,370 bushels/acre). Researchers suggested that poultry manures, used in combination with commercial fertilizer, may provide the most efficient usage of poultry manure in Suwannee, Madison, and Hamilton counties where a large poultry industry exists.
Nitrogen
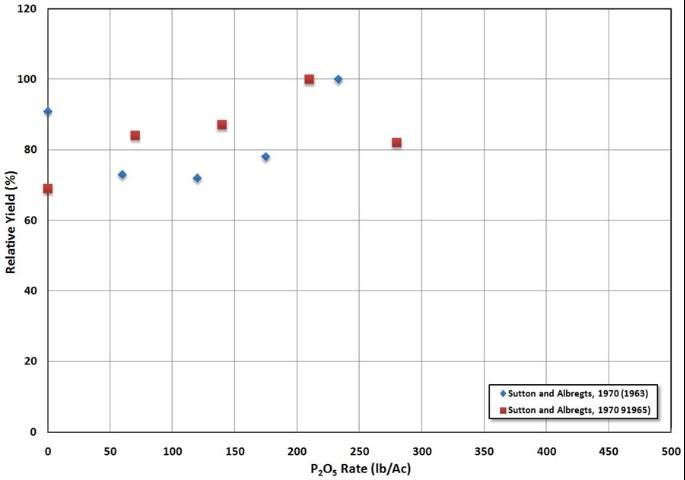
Spring experiments in 1963 and 1965 were conducted in Dover on Scranton fine sand soils (Sutton and Albregts 1970). Nitrogen rates were increased from 0 to 200 lb/acre in increments of 50 lb/acre in 1963 and from 0 to 268 lb/acre in increments of 67 lb/acre in 1965. Five rates of each phosphorus (P) and potassium (K) were applied factorially from a zero check treatment each season to highest P rates of 230 lb/acre P2O5 (1963) and 280 lb/acre P2O5 (1965) and highest K rates of 145 lb/acre K2O (1963) and 275 lb/acre (1965). Fertilizer sources NH4NO3, superphosphate, and KCl were band applied in three equal applications in 1963 and in two equal applications in 1965. Unmulched beds were spaced 4 feet on center each season, established with 'Florida Market' transplants, and overhead irrigated as needed.
Interaction effects among treatments were not significant in either experimental season. Yields responded quadratically to increased N in 1963, leveling off at rates greater than 100 lb/acre N (621 bushels/acre, 99% RY, bushel weight not specified). Yield results in 1965 were linear, with yield increases through 268 lb/acre N (753 bushels/acre, 100% RY), a slight yield increase from 99% RY with 200 lb/acre N. Researchers cited an additional N treatment, not included in the analysis, of 335-344-344 lb/acre (N-P2O5-K2O) where yield was reduced to 90% of the highest yield with 268 lb/acre N. Two or three equal applications for a total 270 lb/acre N were favored for eggplant production on fine sand soils used in these experiments. Eggplants treated with the lower N rates developed an "off color" in 1963, likely due to sun damage from fewer shading leaves with these low N rates, and in 1965, bacterial wilt occurred in plants where no N or K was applied.
Experiments conducted near Live Oak in the spring seasons of 1988 to 1990 were designed to determine N requirements for mulched eggplant (Hochmuth et al. 1991a). Klej (Lakeland) fine sand soils with an organic-matter content of 1.4% received N at rates of 0, 60, 120, 180, 240, and 300 lb/acre. Uniform seasonal rates of P2O5 and K2O were 0 and 50 lb/acre (1988), 50 and 120 lb/acre (1989), and 0 and 100 lb/acre (1990), respectively. Nutrients were from NH4NO3, triple superphosphate, and K2Mg(SO4)2. All fertilizer materials were broadcast on the beds, tilled, mulched with black polyethylene, and planted with 'Classic' eggplant transplants each spring. Beds were spaced 5 feet apart with plants grown in a single row 18 inches apart; plants were untied in 1988 and 1989 and staked and tied in 1990. Soil moisture was monitored by tensiometer and maintained at -10 centibars, using drip irrigation.
In 1988, early yield increased linearly from 22 to 72 bushels/acre with added N fertilizer from 0 to 300 lb/acre N, respectively, while early yields in 1989 and 1990 were not affected by N. Total marketable yields were lower in 1988 than yields in 1989 and 1990 but exceeded the North Florida average yield that year (670 bushels/acre) and the state average yield in 1989 and 1990 (815 and 806 bushels/acre, respectively). Total marketable yields increased quadratically, significant at 5% probability with increased N fertilization in all experimental seasons. Yields leveled off at rates greater than 60 lb/acre N in 1988 (680 bushels/acre, 92% RY) and at rates greater than 120 lb/acre N in 1989 (1,253 bushels/acre, 80% RY) and 1990 (974 bushels/acre, 100% RY). Medium-size fruits were 28% to 37% of the total fruit yield, and large fruits were 9% to 31% of total fruit yield during these experimental seasons. Based on a regression analysis of RYs for each season, total marketable yields leveled off after 112 lb/acre N during these seasons of four to five harvests through a period of 6 weeks. A supplemental N application of 30 lb/acre N was recommended for extended harvest seasons (Shuler and Hochmuth 1990). Leaf-tissue N concentrations increased quadratically (1% probability) with increased N. Critical leaf N concentrations of between 4.0% and 5.0% at early flowering were tied to optimum N rates, with leaf N concentrations of less than 4% at harvest associated with poorer yields.
Nitrogen and K rates less than the standard grower rates of these nutrients were evaluated in a Palm Beach County fall/winter 1992–1993 experiment (Shuler and Hochmuth 1993). Beds were on 5-foot centers, and plants were spaced 23 inches apart in the row. Starter fertilizer, 40-180-40 lb/acre N-P2O5-K2O, was broadcast on Myakka fine sand followed by bed preparation, fumigation, and mulching with silver-coated black polyethylene on September 15. Nitrogen (total) at 160, 240, or 244 (grower rate) lb/acre was applied by pulling back the mulch and laying two bands 20 inches apart. On refastened mulch, 'Classic' eggplants were transplanted, later staked, tied four times, and harvested ten times during a 14-week period from 8 December through 16 March. Nitrogen and K2O rates were increased to 280, 360, and 364 (grower rate) lb/acre by four 30 lb/acre liquid fertilizer injections applied with a liquid injection wheel. Subsurface irrigation was used. Addition of the injected fertilizer increased all of the N rates in excess of the 160 lb/acre maximum recommendation for eggplant but did not increase yields or average fruit weight. Yield with 280 lb/acre N (1,478 bushels/acre, 100% RY), was similar to the yield with 360 lb/acre N, 96% RY. Yield with the grower fertilization program was 1,361 bushels/acre.
Drip Irrigation
Keeping nutrients in the soil profile and available for eggplant plant uptake requires proper irrigation management. Because of the critical nature of irrigation and drainage management with respect to nutrient uptake by the plant and possible loss of nutrients to the environment, information is regularly updated. Several types of irrigation are used by vegetable producers in Florida (Smajstrla and Haman 1998). Eggplant is grown with subsurface or drip irrigation in Florida. Recommendations for irrigation are presented by Dukes et al. 2010; Simonne et al. 2010. Based on the research summarized above, recommendations for drip-irrigated eggplant were developed in the late 1990s (Hochmuth 1994a, b; Hochmuth and Hanlon 1995a; Hochmuth and Hartz; Hochmuth and Smajstrla 1997). This information was also used in other locations in the country for eggplant production (Hartz and Hochmuth 1996). More research is needed for drip-irrigated eggplant nutrient management involving nutrient injection (fertigation).
Summary Nitrogen
Eggplant yields responded to mixed-fertilizer N rates as high as 400 lb/acre (Figure 1), but yields generally reached a plateau at 200 lb/acre N in most experiments (Figure 2), generally agreeing with the current fertilizer N recommendation of 200 lb/acre (Hochmuth and Hanlon 1995a). There is evidence in Figures 1 and 2 of yield responses to slightly greater N rates than 200 lb per acre. However, yield decreases as N rate increases to more than 250 lb/acre. Nitrogen rates to 310 lb/acre, supplied from poultry manure, were required for optimum yield with this N source, while yield in another mixed-fertilizer experiment was reduced by 10% with 335 lb/acre N. The mineralization rate of poultry manure appeared to be inadequate for use as the sole N source for eggplant, resulting in lower early yield and requiring two times the N for yields similar to those with commercially fertilized plants. Used in combination with commercial fertilizer, poultry manure may yet be a potential N source for eggplant production. Off-color eggplant fruits with light lengthwise streaks resulted from plants grown with 50 to 100 lb/acre N, likely due to reduced leaf area and sun damage from insufficient leaf cover.
Early yield doubled with mulched compared to unmulched eggplant in one season. Soil beneath black paper or polyethylene mulch and occasionally strip mulch had from 2 to 6 times more soil NO3-N and from 3 to 40 times more soil NH4-N at harvest than soils from unmulched plants.
Potassium and Phosphorus
Soil Testing
M-1 soil extractant is used on mineral soils to determine preplant soil nutrient concentrations and to provide fertilizer recommendations. M-1 extractant indices (expressed as ppm soil-extracted nutrient) are classified as very low, low, medium, high, and very high, and a crop-specific fertilizer recommendation is made from that classification. The M-1 solution was adopted as the standard extractant in 1979 at UF. Before M-1, ammonium acetate and water extractants were used. Indices recorded from these methods cannot be directly equated with M-1 indices or fertilizer recommendation rates. Water-management practices, fertilizer sources, and application methods will also be summarized in this section.
Phosphorus
Two P fertilization experiments are summarized in Figure 3 (Sutton and Albregts 1970). Response to P was maximized between 150 and 200 lb/acre P2O5. Soil P was reported as "low" for these studies. Very little research has been conducted on P fertilization of eggplant, probably because eggplant is a relatively minor crop among the vegetable crops in Florida. More research needs to be done to determine P management strategies, especially with regard to the potential impacts of fertilization on water quality.
Potassium
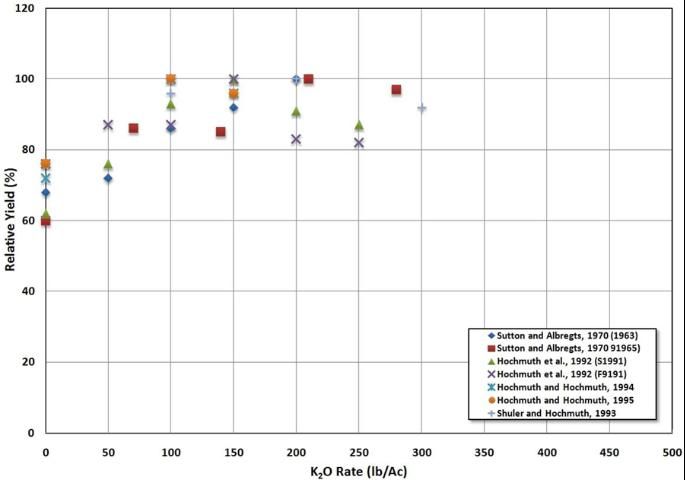
Responses of eggplant to K fertilization are presented in Figure 4. Factorial applications of five rates each of N, P, and K were banded in three equal applications in spring 1963 and in two equal applications in the spring of 1965 (Sutton and Albregts 1970). Potassium from KCl was applied at rates of 0, 50, 100, 150, or 200 lb/acre K2O in 1963 and at rates of 0, 70, 140, 210, or 280 lb/acre K2O in 1965. Experiments were conducted near Dover on Scranton fine sand beds spaced 4 feet apart and set in a single plant row with 18 inches (1963) or 24 inches (1965) between 'Florida Market' eggplants. Beds received overhead irrigation (mulch use was not specified). Nutrient effects did not interact significantly for yield responses in either experimental season. Total marketable yields increased quadratically in 1963, leveling off at rates greater than 100 lb/acre K2O (625 bushels/acre, 100% RY, bushel weight was not specified). In 1965, marketable yields increased linearly in response to increased K to 280 lb/acre K2O (878 bushels/acre, 100% RY). Based on nutrient deficiency symptoms and low yields with zero lb/acre K2O, soils in both seasons were interpreted as having low residual soil K concentrations. Experiments conducted near Live Oak at the UF/IFAS Suwannee Valley Research and Education Center in the spring and fall of 1991 had low M-1 soil K concentrations, 21 ppm in spring and 31 ppm in fall (Hochmuth et al. 1992; Hochmuth et al. 1993). The K recommendation in 1989 was for 130 lb/acre K2O (Kidder et al. 1989). Potassium treatments from K2Mg(SO4)2 in the spring and from KCl in the fall were applied at 0, 50, 100, 150, 200, or 250 lb/acre K2O each season, and NH4NO3-N was applied uniformly at 120 lb/acre. Fertilizers, including 50 lb/acre P2O5, were mixed, broadcast 36 inches across the bed area, and tilled. Klej (Lakeland) fine sand beds, mulched with black polyethylene in the spring and white-on-black polyethylene in the fall, were planted with 'Classic' eggplants in single rows spaced 5 feet on center (fertilizer was calculated on six-foot bed spacing). Drip irrigation was used to maintain soil moisture between -8 and -12 centibars to an 8-inch depth.
In the spring, early marketable yield increased linearly with 0 to 250 lb/acre K2O from 242 to 364 bushels/acre, respectively. Soil K concentrations were lower this season than in the fall where K fertilization had no effect on early yields. In both seasons, total marketable yields responded quadratically to increased K fertilizer, consisting of quadratic increases in yields of USDA-No.-1-grade fruits. Total marketable yield leveled off after 100 lb/acre K2O in both seasons (93 and 87% RYs, respectively) with 100% RYs with at 150 lb/acre K2O (1,500 and 1,630 bushels/acre, respectively). An average of calculated high-yield K rates from the linear-plateau and quadratic equations resulted in K recommendations of 125 lb/acre K2O (spring) and 100 lb/acre K2O (fall). Spring-season leaf-tissue K concentrations (3.5%) were sufficient with 100 lb/acre K2O at early fruit set, but a leaf-tissue K concentration of 3.0% appeared adequate at harvest (Hochmuth et al. 1991b). Fall-season leaf-tissue K concentrations were 3.5% with 100 lb/acre K2O at all sampling periods except the final harvest. With 100 lb/acre K2O, petiole-sap K concentrations were sufficient, 3,500 ppm in spring and 3,800 ppm in the fall, but were less than sufficient in both seasons with K rates less than 100 lb/acre. A high correlation between petiole-sap K concentration and leaf-tissue K concentration led researchers to recommend the petiole-sap test for K as a quick and reliable in-the-field method of assessing plant K nutrition. For interpretation of plant and petiole sap values, see Hochmuth (1994a, 1994b) and Hochmuth et al. (1991b; 2009).
Researchers in a Palm Beach County fall/winter 1992–1993 experiment sought to evaluate eggplant yield responses to 40, 100, 200, and 300 lb/acre (total) K2O (calculated for beds spaced on 5-foot centers) and to the grower application of 376 lb/acre K2O (Shuler and Hochmuth 1993). Based on low (M-1) soil-test K concentrations, 32 ppm (130 lb/acre) K2O was recommended (Kidder et al. 1989). Potassium was broadcast on the Myakka fine sand with the starter fertilizer, 40-180-40 lb/acre N-P2O5-K2O, followed by bed preparation, fumigation, and mulching with silver-coated black polyethylene on September 15. The mulch was pulled aside ten days later and fertilizer treatments at the specified rate were applied in two bands 20 inches apart. The mulch was refastened, and 'Classic' eggplants were transplanted, later staked, tied four times, and harvested ten times. In addition to the preplant and band-applied KNO3-K fertilizer, 120 lb/acre K2O was applied in four 30 lb/acre K2O liquid fertilizer injections using an injection wheel. Irrigation was by subsurface.
Application of the liquid fertilizer combined with the dry band-applied fertilizer increased K treatment rates to 160, 220, 320, and 420 lb/acre K2O (500 lb/acre K2O grower treatment). Marketable yields did not respond to K, with 100% RY (1,544 bushes/acre) with 160 lb/acre K2O and 90% RY with 420 lb/acre K2O. Marketable yield with the grower K treatment of 500 lb/acre K2O was 1,361 bushels/acre. Early or total yields of large, medium, or small fruit were not affected by increased K nor was average fruit weight (1.09 lb/fruit) affected by K fertilization. Residual soil K concentrations (M-1) sampled through the fertilizer band increased linearly (1% probability) from 15 to 89 ppm with dry K treatments of 40 to 300 lb/acre K2O (160 lb/acre N) and increased to 400 ppm with the grower dry fertilizer application of 336 lb/acre K2O (244 lb/acre N).
Two K rates, 100 and 150 lb/acre K2O, and a zero K treatment were evaluated in a spring 1993 experiment on M-1 low K (31 ppm) Lakeland fine sand soils at the Suwannee Valley Research and Education Center near Live Oak (Hochmuth and Hochmuth 1994). A percent (0, 25, or 50%), of each K rate was supplied from controlled-release (CR) K (KNO3) with the balance of the fertilizer from soluble KNO3. Likewise, 150 lb/acre N was applied as 50% CR-urea and 50% NH4NO3. No phosphorus was applied due to high soil-test P concentrations. Broadcast fertilizers were tilled into beds, which were formed on 5-foot centers (fertilizer rates were calculated on a standard 6-foot bed spacing), fumigated, and mulched with black polyethylene. 'Classic' eggplants were planted in a single row with 18 inches between plants, and drip irrigation was applied to maintain soil moisture between -8 to -12 centibars as measured by tensiometer.
Marketable yields were similar with 100 (958 bushels/acre, 100% RY) or 150 lb/acre K2O (96% RY). Nearly 50% of the yields from K-fertilized plants were No. 1 large eggplants. These large eggplants increased the crop value, compared to 72% RY from plants that received no K. The proportion of CR-K fertilizer interacted with K rate affecting both early and total yields of No. 1 large fruit. Yields of these fruit increased when 150 lb/acre K2O contained 25% or 50% CR-K, and with 100 lb/acre K2O, a yield increase occurred with 50% CR-K. Authors concluded that soil soluble salt concentrations were likely reduced where the fertilizer contained CR-K. Fertilizer leaching due to heavy rainfall was not a factor in the response to CR-K during this dry season. Average fruit weight did not differ with K treatment. Potassium deficiency symptoms and deficient leaf-tissue K concentrations (4.4% and 2.5% when plants were 12 inches tall and at mature fruit stages, respectively) occurred in plants that received no K fertilizer. Adequate (5% and 3.5% at the same respective plant stages) leaf-tissue K concentrations and optimum yield with 100 lb/acre K2O led researchers to conclude that 100 lb/acre K2O was sufficient on these low K soils.
Experimentation with CR-K fertilizer continued at the Suwannee Valley Research and Education Center near Live Oak in the spring of 1994 (Hochmuth and Hochmuth 1995). Most of the experimental conditions were the same as in the previous season, including the Lakeland fine sand soils with M-1 low (28 ppm) K concentrations. Exceptions were the N rate was increased to 175 lb/acre N, and there were five harvests this season, compared to four in the previous season. Nitrogen fertilizer was derived equally from CR-urea and NH4NO3, with fertilizer rates calculated on standardized 6-foot bed centers (beds were spaced 5 feet apart). Marketable yields were increased from 76% RY with zero K to 100% RY (1,475 bushels/acre) with 100 lb/acre K2O. Potassium fertilization did not affect total marketable yields (96% RY with 150 lb/acre K2O), early marketable yields (227 bushels/acre), or average fruit size (1.13 lb/fruit). Unlike the previous season, the proportion of CR-K fertilizer had no effect on total season U.S. No. 1 fruits or on total marketable yield. Leaf-tissue K concentrations were deficient with the zero K treatment and were unaffected by either K rate of 100 or 150 lb/acre or proportion of CR-K. Adequate leaf-tissue K concentrations, between 3.5% and 5.0% at early fruit set, occurred with both K fertilization rates. Researchers concluded that the 130 lb/acre K2O recommendation for low K soils would be sufficient.
Summary Potassium
Relative yield responses from K fertilization experiments are presented in Figure 4. Total marketable yields optimized at or near 160 lb/acre K2O in all experiments where M-1 soil testing was performed. Yields responded linearly through 280 lb/acre K2O (KCl) in a single overhead-irrigated experiment where mulch use was not specified and soil K concentrations were not evaluated. In other experiments, yields did not respond to K rates in excess of 100 or 160 lb/acre K2O, the minimum tested K rate, nor were fruit quality factors, size, or average fruit weight affected by increased K through 420 lb/acre K2O.
K, remaining in the fertilizer band, increased from the initial 32 ppm M-1 soil K preplant to 89 ppm K after harvest.
Experimentation with CR-K sources resulted in increased yield of U.S. No. 1 fruit when 25% to 50% CR-K were applied with 150 lb/acre K2O or 50% CR-K with 100 lb/acre K2O in a single experiment season. Researchers cited reduced soluble salt concentrations and potentially higher yields of No. 1 fruit with the CR-K source, though total marketable yields were similar with CR or soluble K sources in two experiment seasons. A positive correlation between petiole-sap K concentrations and leaf-tissue K concentrations qualified the petiole-sap test as a reliable tool for nutrient testing with eggplant. Additional research is needed in Southeast Florida, where eggplants are chiefly grown, to supplement the research results from North and West Florida. Research results with K support the current K recommendation of 160 lb/acre K2O.
Overall Summary
Research with N and K adequately documents current N and K recommendations in most studies. More research is needed with P. There were some data collected during the 1990s that indicated yield maximum responses with between 200 and 250 lb/acre N (see Figure 2). Results also indicate yield reductions with N rate greater than 250 lb/acre. Research supports the current recommendations for K. More research is needed for drip-irrigated eggplant to determine optimum fertigation schedules. No research has been conducted to relate fertilizer and irrigation management practices to nutrient leaching.
Some BMPs supported by the research summarized above:
- Research supports the current N, P, and K fertilization target rates, but there is a need for more work with P.
- There is evidence in the literature of possibly a need for slightly more N, up to 225 lb/acre, but N greater than 250 lb/acre led to reduced yields.
- Controlled-release fertilizers can be used to supply N or K.
- Petiole sap testing can be used to help fine-tune fertilizer applications, especially with drip irrigation (fertigation).
- Mulch leads to increased yields, and mulch helps protect N from leaching.
- More work is needed on environmental impacts of N and P fertilization practices and on mineralization rates for organic nutrient sources.
Literature Cited
Albregts, E. E., and C. M. Howard. 1975. Influence of mulch type and fertilizer rates on eggplant response. Soil Crop Sci. Soc. Fla. Proc. 34:61-62.
Black, C. A. 1992. Soil fertility evaluation and control. Lewis Publishers, Boca Raton, FL. 746 pp.
Brown, J. R. 1987. Soil testing: sampling, correlation, calibration, and interpretation. Soil Science Society of Amer. Special Publ. No. 21. Soil Science Society of America, Inc. Madison, Wisc.
Dukes, M. D., L. Zotarelli, and K. T. Morgan. 2010. Use of irrigation technologies for vegetable crops in Florida. HortTechnology 20:133-142.
Economic Research Service (ERS), USDA, 2006. Eggplant, Vegetables and Melons Outlook. http://www.ers.usda.gov/publications/vgs/2006/12dec/vgs318.pdf#page=23.
Florida Dept. of Agriculture and Consumer Services. 2005. Water quality/quantity best management practices for Florida vegetable and agronomic crops. http://www.floridaagwaterpolicy.com/PDF/Bmps/Bmp_VeggieAgroCrops2005.pdf.
Hanlon, E. A., and G. J. Hochmuth. 1989. Calculating fertilizer rates for vegetable crops grown in raised-bed cultural systems in Florida. Fla. Coop. Ext. Serv. Spec. Series SS-SOS-901.
Hart, T. G., M. E. Marvel, and J. Montelaro. 1974. Eggplant Production Guide. Fla. Coop. Ext. Serv. Cir 109C.
Hartz, T. K., and G. J. Hochmuth. 1996. Fertility management of drip-irrigated vegetables. HortTechnology 6:168-172.
Hochmuth, G. J. 1988. Commercial Vegetable Fertilization guide. Fla. Coop. Ext. Serv. CIR 225C.
Hochmuth, G. J. 1992a. Fertilizer management for drip-irrigated vegetables in Florida. HortTechnology 2:27-32.
Hochmuth, G. J. 1992b. Concepts and practices for improving nitrogen management for vegetables. HortTechnology 2 (1): 121-125.
Hochmuth, G. J. 1994a. Plant petiole sap-testing guide for vegetable crops. Fla. Coop. Ext. Serv. Circ. 1144.
Hochmuth, G. J. 1994b. Sufficiency ranges for nitrate-nitrogen and potassium for vegetable petiole sap quick tests. HortTechnology 4:218-222.
Hochmuth, G. J. 1996a. Vegetable fertilization pp. 3-17. IN: G. Hochmuth and D. Maynard (eds.) Vegetable production guide for Florida. Fla. Coop. Ext. Serv. Circ. SP 170.
Hochmuth, G. J. 1996b. Commercial Vegetable Fertilization Guide. Fla. Coop. Ext. Serv. CIR 225D.
Hochmuth, G. J. 2000. Management of nutrients in vegetable production systems in Florida. Soil and Crop Sci. Soc. Fla. Proc. 59:11-13.
Hochmuth, G. J., and K. Cordasco. 1999 (reviewed 2009). Summary of N and K Research with Eggplant in Florida. Fla. Coop. Ext. Serv. Cir 751.
Hochmuth, G. J., and E. A. Hanlon. 1989. Commercial vegetable crop nutrient requirements. Fla. Coop. Ext. Serv. Circular 806.
Hochmuth, G. J., and E. A. Hanlon. 1995a. IFAS standardized fertilization recommendations for vegetable crops. Fla. Coop. Ext. Serv. Circ. 1152.
Hochmuth, G. J., and E. A. Hanlon. 1995b. Commercial vegetable crop nutrient requirements in Florida. Fla. Coop. Ext. Serv. SP 177.
Hochmuth, G. J., and E. A. Hanlon. 2000. IFAS standardized fertilization recommendations for vegetable crops. Fla. Coop. Ext. Serv. Circ. 1152.
Hochmuth, G. J., and E. A. Hanlon. 2009. Calculating recommended fertilizer rates for vegetable crops grown in raised-bed mulched cultural systems. Fla. Coop. Extension Serv. Circ. SL 303. https://edis.ifas.ufl.edu/pdffiles/ss/ss51600.pdf.
Hochmuth, G. J., and E. A. Hanlon. 2010a. Commercial vegetable fertilization principles. Fla. Coop. Extension Serv. Cir. SL 319. https://edis.ifas.ufl.edu/pdffiles/cv/cv00900.pdf.
Hochmuth, G. J., and E. A. Hanlon. 2010b. Principles of sound fertilizer recommendations. Fla. Coop. Extension Serv. Cir. SL 315.
Hochmuth, G. J., and T. K. Hartz. 1996. Fertility management of drip-irrigated vegetables. HortTechnology 6:168-172.
Hochmuth, G. J., and R. C. Hochmuth. 1994. Response of eggplant to controlled-release potassium fertilization. Fla. Agr. Expt. Sta. Research Report, Suwannee Valley REC 94-02.
Hochmuth, G. J., and R. C. Hochmuth. 1995. Effects of K amounts and proportions of K supplied from controlled-release potassium nitrate on eggplant yield. Fla. Coop. Ext. Serv. Res. Report Suwannee Valley REC 95-6.
Hochmuth, R. C., and G. J. Hochmuth. 1996. Comparison of different commercial fertilizer and poultry-manure rates in the production of eggplant. Fla. Agr. Expt. Sta. Research Report, Suwannee Valley REC 96-15.
Hochmuth, G. J., R. C. Hochmuth, M. E. Donley, and E. A. Hanlon. 1993. Eggplant yield in response to potassium fertilization on sandy soil. HortScience 28(10):1002-1005.
Hochmuth, G. J., R. C. Hochmuth, E. A. Hanlon, and M. Donley. 1991a. Nitrogen requirements of mulched eggplant in northern Florida. Fla. Agr. Expt. Sta. Research Report, Suwannee Valley REC 91-14.
Hochmuth, G. J., R. C. Hochmuth, E. A. Hanlon, and M. E. Donley. 1992. Effect of potassium on yield and leaf-N and K concentrations of eggplant. Fla. Agr. Expt. Sta. Research Report, Suwannee Valley REC 92-2.
Hochmuth, G. J., and D. N. Maynard. 1996. Vegetable production guide for Florida. Fla. Coop. Ext. Serv. Circ. SP 170.
Hochmuth, G. J., D. Maynard, C. Vavrina, E. A. Hanlon, and E. H. Simonne. 2009. Plant Tissue Analysis and Interpretation for Vegetable Crops in Florida. 55 pp. https://edis.ifas.ufl.edu/publication/ep081.
Hochmuth, G. J., D. Maynard, C. Vavrina, and E. A. Hanlon. 1991b. Plant-tissue analysis and interpretation for vegetable crops in Florida. Fla. Coop. Ext. Serv. Spec. Ser. SS-VEC-42.
Hochmuth, G. J., and A. G. Smajstrla. 1997. Fertilizer application and management for micro (drip)-irrigated vegetables in Florida. Fla. Coop. Ext. Serv. Circ. 1181.
Kidder, G., E. A. Hanlon, and G. J. Hochmuth. 1989. IFAS standardized fertilization recommendations for vegetable crops. Fla. Coop. Ext. Serv. Spec. Ser. SS-SOS-907.
Montelaro, J. 1978. Commercial vegetable fertilization guide. Fla. Coop. Ext. Serv. Circ. 225-B.
Mylavarapu, R. S. 2009. UF/IFAS Extension Soil Testing Laboratory (ESTL) Analytical Procedures and Training Manual. Circular 1248, 19 pp. Accessed September 16, 2022. https://ufdc.ufl.edu/IR00003469/00001/pdf.
Olson, S. M, and B. M. Santos. 2010. Vegetable Production Handbook of Florida. Univ. of Fla. IFAS Extension. https://ufdc.ufl.edu/UF00099159/00001/images [Accessed September 16, 2022].
Santos, B. M., W. M. Stall, S. Zhang, S. E. Webb, and S. A. Smith 2010. Eggplant production in Florida. Fla. Coop. Ext. Serv. Circ. HS 726. https://edis.ifas.ufl.edu/pdffiles/cv/cv12400.pdf.
Schepers, J. S., K. D. Frank, and C. Bourg. 1986. Effect of yield goal and residual nitrogen considerations on nitrogen fertilizer recommendations for irrigated maize in Nebraska. J. Fertilizer Issues 3:133-139.
Shuler, K. D., and G. J. Hochmuth. 1990. Fertilization guide for vegetables grown in full-bed mulch culture. Fla. Coop. Ext. Serv. Circ. 854.
Shuler, K. D., and G. J. Hochmuth. 1993. Eggplant yield response to reduced rates of nitrogen and potassium fertilizer, Thomas Produce, Delray Beach, fall-winter, 1992-93. Fla. Agr. Expt. Sta. Research, Palm Beach County Ext. Report 1993-5.
Simonne, E. H., M. D. Dukes, and L. Zotarelli. 2010. Principles and practices for irrigation management for vegetables. Fla. Coop. Ext. Serv. AE 260. https://edis.ifas.ufl.edu/pdffiles/cv/cv10700.pdf.
Simonne, E. H., and G. J. Hochmuth. 2010. Chapter 2. Soil and Fertilizer Management for Vegetable Production in Florida. Vegetable Production Handbook. HS711. 3-15. https://edis.ifas.ufl.edu/publication/cv101.
Smajstrla, A. G., and D. Haman. 1998. Irrigated Acreage in Florida: A Summary through 1998. Fla. Coop. Ext Serv. Cir 1220. Accessed September 16, 2022. https://ufdc.ufl.edu/IR00001512/00001/pdf.
Sutton, P., and E. E. Albregts. 1970. Response of eggplant to nitrogen, phosphorus, and potassium fertilization. Soil Crop Sci. Soc. Florida Proc. 30:1-5.
USDA. NASS. 2009. Census of Agriculture, 2007. Table 30. Vegetables, Potatoes, and Melons Harvested for Sale: 2007 and 2002. Accessed September 16, 2022. https://agcensus.library.cornell.edu/wp-content/uploads/2007-Florida-st12_2_030_030.pdf.
