Drip Irrigation: The BMP Era—An Integrated Approach to Water and Fertilizer Management for Vegetables Grown with Plasticulture
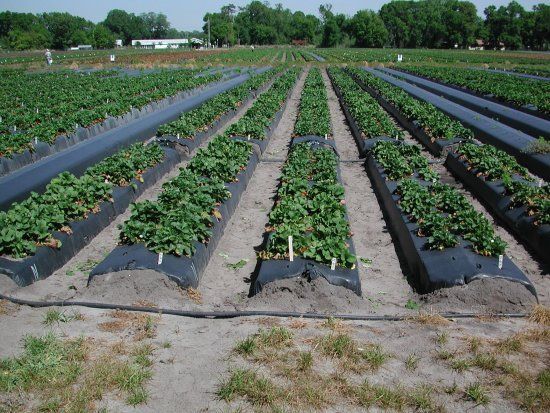
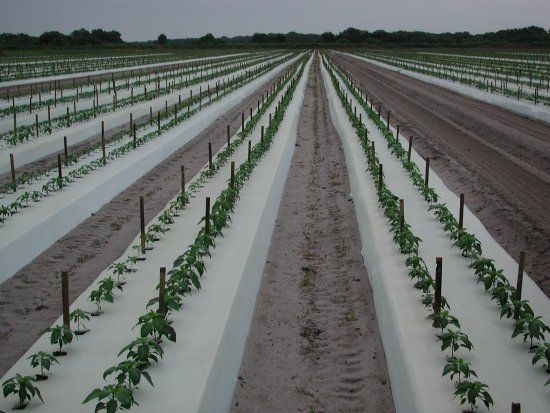
In Florida, plasticulture is currently used on approximately 60,000 acres of vegetable (mainly tomato, bell pepper, eggplant, strawberry, and watermelon). The Florida drip irrigation school is a one-day educational program offered by the Institute of Food and Agricultural Sciences at the University of Florida focusing on drip irrigation. Through talks, hands-on demonstrations and discussions, the goal of this program is to teach and help vegetable growers better manage fertilizer, water and fumigant applications through drip systems and to prepare them for the BMP era. This program involves county and state-wide Extension faculty and researchers, and members of the irrigation and fertilization industries.
Additional Florida Drip Irrigation Schools are being scheduled regularly thoughout Florida. These programs are offered at no charge, but require pre-registration. Contact your local UF/IFAS Extension office to find out when the next drip irrigation school will be offered in your area or check announcements in the Vegetarian newsletter at http://www.hos.ufl.edu/newsletter/vegetarian.htm
This article presents a summary of the information discussed on fertilizer management, irrigation scheduling, and drip system maintenance and troubleshooting. A list of additional references is also included.
Total Maximum Daily Loads (TMDL) and Best Management Practices (BMP): The Basics
As the development of TMDLs and BMPs for vegetables grown in Florida takes place, growers are eager to find out how this process will affect their operations. TMDLs and BMPs have their origin in Federal and State legislations (Table 1). A TMDL is the maximum amount of a pollutant a water body can receive and still meet its water quality standards. BMPs are specific cultural practices that aim at reducing the load of a specific compound, while maintaining economical yields (Table 2). Growers will benefit three ways from having a documented BMP plan. They will be offered (1) a waiver of liability from reimbursement of costs or damages associated with the evaluation, assessment, or remediation of nitrate contamination of ground water (F.S. 376.307); (2) a presumption of compliance with state water quality standards [F.S. 403.067 (7)(d)]; and, (3) an opportunity to receive cost-share reimbursement for implementation of selected BMPs [F.S. 570.085(1)].
The BMPs applicable to vegetable production will be included in the Agronomic and Vegetable Crop Water Quality and Water Quantity BMP Manual for Florida for row crops and vegetables, which is under development. BMPs are 1-to-3 page long chapters that include a working definition of the topic, list specific things to do (BMPs) as well as things to avoid (pitfalls), and present existing applicable technical criteria together with additional references. As the new legislative mandate for Florida agriculture, the BMPs largely embrace UF/IFAS fertilization and irrigation recommendations.
Principles of Fertilization Management in the BMP Era
Fertilization principle 1. With plasticulture, think in terms of rows Y and not in terms of field surface for irrigation and fertilization. For bare ground production of vegetables, fertilizer and irrigation rates are typically expressed in lbs/acre and gallons/acre, respectively. However, when vegetables are grown with plasticulture, the number of linear feet of beds in an acre becomes more important than the actual surface of the field. Growers should think in terms of lbs/100 linear bed feet (lbf) for fertilization injections and gallons/100 lbf for irrigation, and take into account the bed spacing. Typical bed spacings are used in the UF/IFAS fertilization recommendations for plasticulture (Table 3).
Fertilization principle 2. Plants need all the essential nutrients. Sixteen essential mineral elements are recognized as the essential elements. Carbon (C), hydrogen (H), and oxygen (O) are supplied by air and water. Nitrogen (N), phosphorus (P), potassium (K), calcium (Ca), magnesium (Mg), and sulfur (S) are the macronutrients. Boron (B), chlorine (Cl), copper (Cu), iron (Fe), manganese (Mn), molybdenum (Mo), and zinc (Zn) are the micronutrients. All these elements are essential because (1) vegetable crops cannot complete their life cycle without all of them, (2) typical deficiency symptoms appear when one is not available, and symptoms disappear upon the application of the deficient element, and (3) each element has a specific metabolic role. The overall success of a fertilizer program is determined by the essential element which is provided in smallest quantity (limiting factor). Adequate fertilization together with soil nutrient reserves should provide all these elements in adequate quantities, thereby ensuring that mineral nutrition is not limiting vegetable growth and yield.
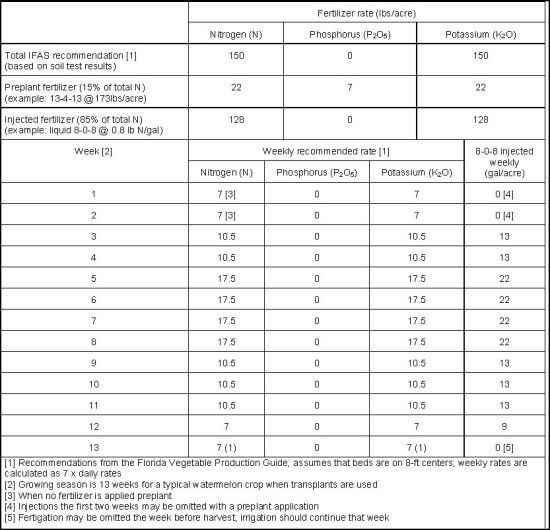
Fertilization principle 3. Soil test and follow the recommendation. The only scientific method to apply fertilizer to vegetables is to use a calibrated soil test. A soil sample has to be recent, representative, and large enough to ensure valid results. The soil test recommendation has to be understood, and properly implemented. Typically, 20% to 50% of N and K2O, and 100% of P2O5 and micronutrients are applied preplant. The remaining 50% to 80% of N and K2O are injected through the drip system. A fertilizer program may be simply designed from UF/IFAS recommendation using a spreadsheet format (Figure 1). Correctly implementing soil test results is essential in increasing nutrient management to a level acceptable in the BMP era (Table 4).
Some growers do not believe that economical vegetable yields can be produced with UF/IFAS fertilizer recommendations. Fertilizer recommendations are based on multiple trials and correspond to the fertilizer rates above which no yield response is likely to occur. UF/IFAS fertilizer rate may not be optimal if excessive irrigation is applied. In this case, the solution is to adjust irrigation management, rather than increasing fertilizer rates. Fertilizer applications in excess of the recommended rate should not be made on a routine basis, but only when exceptional circumstances (leaching rain) occur or based on the results of petiole sap test and/or foliar nutrient analyses. UF/IFAS definition of a leaching rain is 3 in. of rain in 3 days or 4 in. of rain in 7 days.
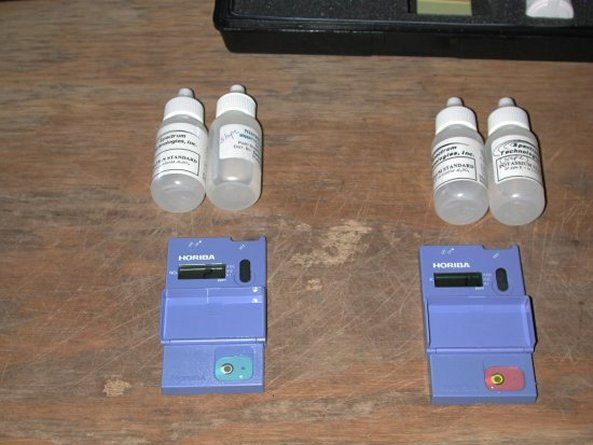
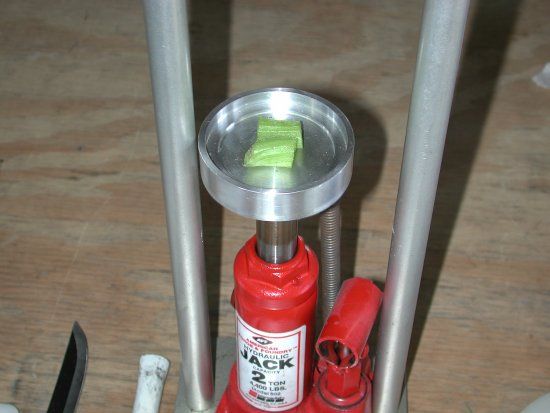
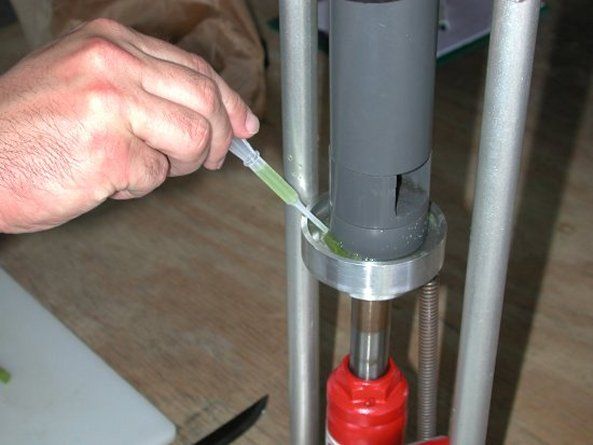
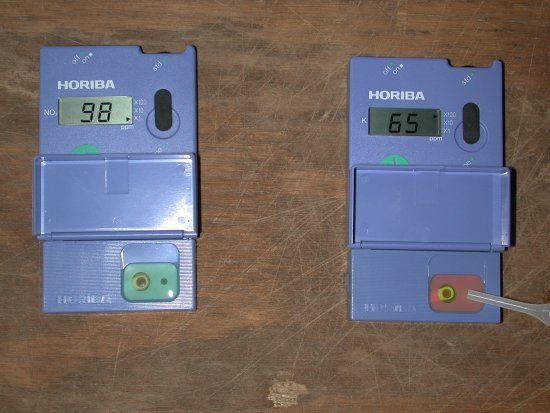
Fertilization principle 4. Monitor crop nutritional status and discover how healthy the vegetable plants are. The nutritional status of vegetables may be monitored with sap test or foliar analysis early in the season (from transplanting to fruit set). A representative sample for petiole and leaf analysis should be made with at least 20 leaves selected randomly throughout the field from most recently, fully mature leaves. For sap analysis, blades should be carefully separated from the petiole and discarded. Figure 2 shows how to collect sap and perform a reading. For leaf analysis, the sampled part should be the blade and its petiole attached.
Principles of Irrigation Scheduling in the BMP Era
Irrigation scheduling is knowing when to start irrigation and how much to apply, in a way that satisfies crop water needs, conserves water, and does not leach mobile nutrients. Irrigation scheduling requires (1) a target water volume, (2) guidelines on how and when to split irrigation, (3) a method to account for rainfall, and (4) a practical method to monitor soil moisture.
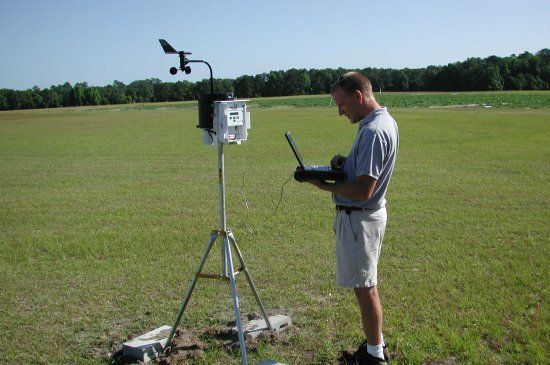
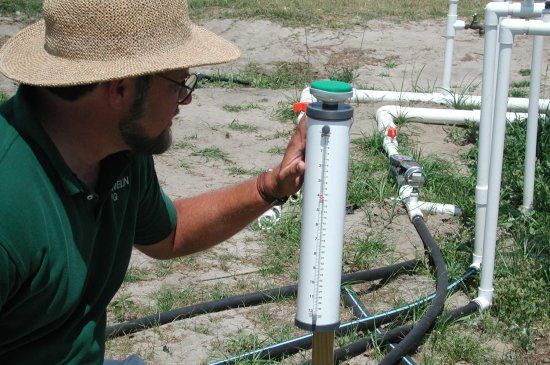
Irrigation principle 1. Irrigation amount must reflect crop water use, no more, no less. Irrigation amounts may be estimated using historical weather data, climatic measurement in real-time, class A pan evaporation, atmometers, and empirical amounts (Table 5, Figure 3). Empirical values have the advantage of being simple. However, they often result in excessive irrigation early in the season, and insufficient ones later in the season. This method alone (without monitoring of soil moisture) is unlikely to be part of the BMPs.
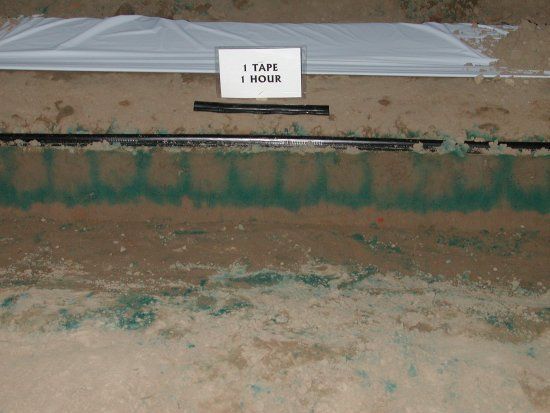
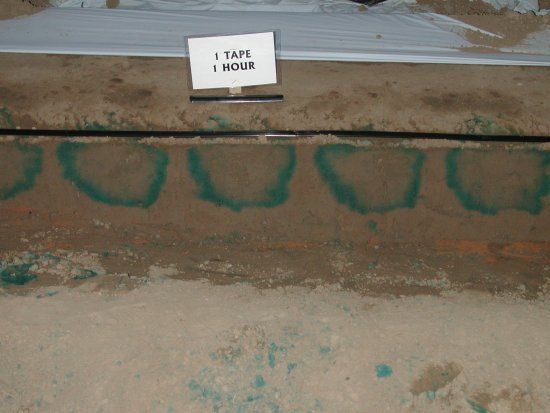
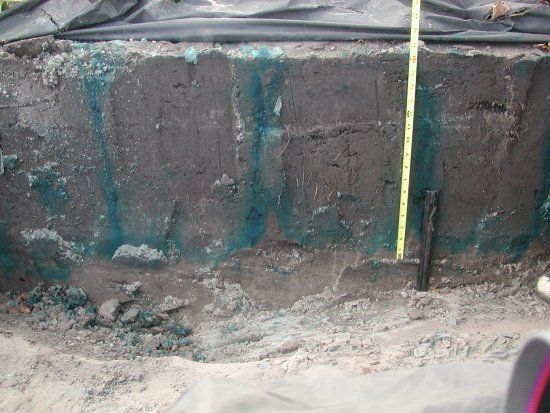
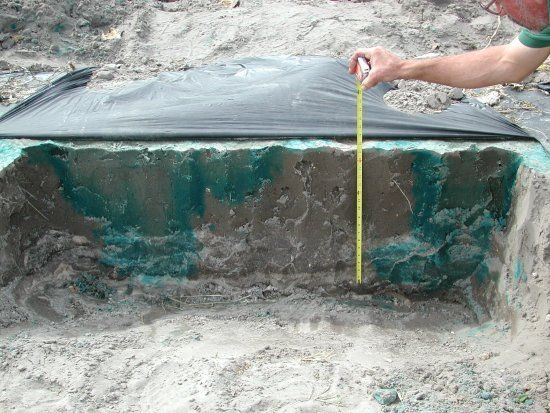
Irrigation principle 2. Irrigation amount should not exceed soil water holding capacity. Otherwise, water is wasted and mobile nutrients are leached. How far water moves down the soil profile is a rather abstract concept because it is not visible. However, it is possible to visualize soil water movements by using colored dyes (Figure 4). Wetting patterns are affected by soil type, irrigation amount, and emitter spacing (Table 6). In the sandy soils of Hillsborough and Hendry counties, the wetting front reached maximum rooting depths at irrigation rates nearing 80 gallons/100ft.
Theoretical highest irrigation amounts can be simply calculated based on the soil physical properties. For a soil where the wetting width is 12 inches (6 inches each side of the drip tape), assuming a 0.75 in/foot soil water holding capacity and allowing a 50% soil water depletion, the theoretical largest water amounts that can be stored in the soil are 24 gal/100 ft within the top 12 inches, 36 gal/100 ft within the top 18 inches, and 48 gal/100 ft within the top 24 inches. These numbers can be used as guidelines. Actual amount that can be applied in one irrigation also depends on the rate of crop evapotranspiration, number of drip tapes, and soil type. The difference between observed (Table 6) and theoretical maximum water holding capacity may be due to bed compaction and wetting widths greater than 12 in. Irrigation greater than the maximum water holding capacity is likely to leach mobile nutrients below the root zone. This is why irrigation, fertilization, BMPs and TMDLs are tied together.
Irrigation principle 3. Rainfall contributes little to replenish soil moisture because of the plastic mulch. Several IFAS fertilizer recommendations for bare ground production allow for additional N and K fertilizer after leaching rains. Leaching rains are defined as three inches of rain in three days, or four inches in seven days. However, it would take less rain to leach through the soil profile in the coarse soils found in South Florida. Since the plastic mulch protects the bed from rainfall, there is no need to apply additional fertilizer after a leaching rain. However, when the field gets flooded, mobile nutrients may be leached out of the root zone or carried out of the field through surface run off. The need for additional fertilizer may be assessed after field drainage by monitoring sap tests levels of nitrate and potassium. Another consequence of using the plastic mulch is that an irrigation may be still needed after a small rain. Soil moisture measurements may be used to assess the need for additional irrigation.
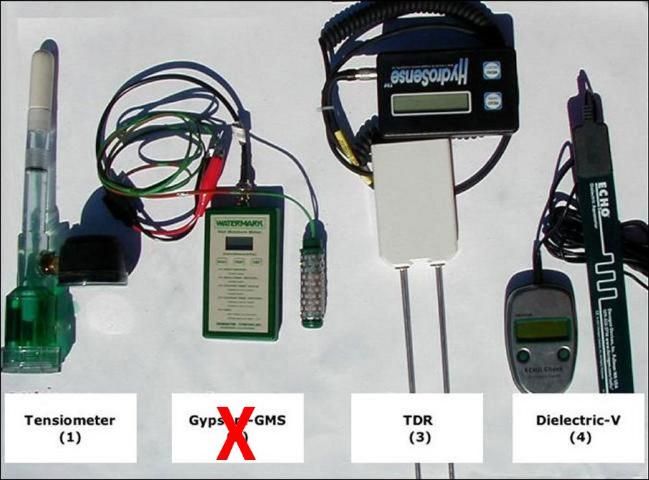
Irrigation principle 4. Monitor soil moisture level daily to discover how much water stress the crop is exposed to. Soil moisture may be reported in terms of soil water tension (SWT) or volumetric water content (VWC). SWT represents the suction force that is necessary to free soil water from the soil attraction. The higher the value of SWT, the greater is the force needed. In some publications, SWT values are reported as negative values. The negative (-) sign is there to reflect the fact that the attraction is generated by the soil particles and therefore the plant has to spend energy to absorb water. SWT may be expressed in atmospheres (atm), bar (b), or kilo Pascals (kPa; the international unit). The conversion between units is 1 atm = 1.013 b = 101.3 cb = 100 kPa. The recommended range for vegetable production is to maintain SWT between 6 to 8 cb (field capacity) and 15 cb. Vegetables may tolerate SWT up to 25 cb without yield reduction on loamy soils. However, sandy soils with SWT above 15 cb may be difficult to re-wet. On the other hand, VWC represents the volume of water present in a volume of soil. VWC for sandy soils range between 14% and 18%, whereas it may reach 38% in clay soils. Instruments available for routine monitoring of soil moisture for vegetable crops are tensiometers, time domain reflectometry probes (TDR), and dielectric probes (Figure 5). Table 7 summarizes a comparison of these instruments in terms of cost, accuracy, response time, preparation, installation, management, and durability.
Irrigation principle 5. Keep irrigation records daily. Vegetable growers are required to keep pesticide records. Fertilization records are usually kept in relation to soil testing and implementing the recommendations. However, vegetable growers seldom document their irrigation practices. For example, a daily log could contain soil moisture measurements (SWT or VWC) at selected depths, rainfall, an estimate of weather demand for water (evapotranspiration), and irrigation amount (gallons/field or duration of irrigation). Most growers who are already keeping irrigation records find them to be a useful management tool. It is likely that the documentation requested to support a BMP plan will include irrigation records, at the farm level and possibly at the field level.
Drip System Maintenance and Troubleshooting
Application uniformity of 85% to 95% is expected from a new, well-designed drip irrigation system (Figure 6). As the irrigation system is used for water and fertilizer applications throughout the growing season, the application uniformity may remain the same if the system is well managed, but will most likely decline with time. A comprehensive maintenance plan will reduce the adverse effects of the agents that reduce application uniformity: small solids in suspension, organic matter, micro-organisms, and chemical residues on application uniformity (Figure 7). Without a maintenance plan, the risk of complete emitter clogging and crop loss becomes real.
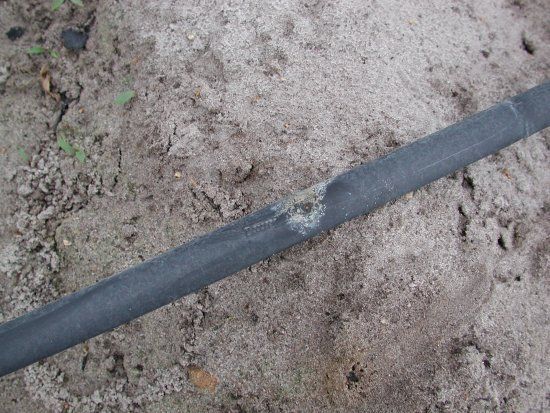
Every vegetable grower who uses drip irrigation should recognize that PREVENTION IS THE BEST MEDICINE in drip system maintenance. A maintenance plan should include (1) a filtration system, (2) chlorination and acidification, (3) flushing, and (4) regular observation of irrigation system components (Table 8 and Table 9).
References and Additional Readings
Related Websites
UF/IFAS North Florida Research and Education Center—Suwannee Valley: https://svaec.ifas.ufl.edu/main-menu-tab/resources/suwannee-valley-reports/ [September 2011]
UF/IFAS Horticultural Sciences Department: http://www.hos.ufl.edu
Florida Department of Environmental Protection: http://www.dep.state.fl.us/water
Suwannee River Water Management District: http://www.srwmd.state.fl.us/
Small Scale Irrigation for Arid Zones (FAO): http://www.fao.org/docrep/W3094E/w3094e00.htm#TopOfPage
Crop Evapotranspiration—Guidelines for Computing Crop Water Requirements—FAO Irrigation and Drainage Paper 56: http://www.fao.org/docrep/X0490E/X0490E00.htm
UF/IFAS Extension Soil Testing Laboratory: http://soilslab.ifas.ufl.edu/#ESTL
NRCS Nutrient Management homepage: http://www.nrcs.usda.gov/TECHNICAL/nutrient.html
General Irrigation
D. Z. Haman and F. T. Izuno. Soil Plant Water Relationships. Circ. 1085. Gainesville: University of Florida Institute of Food and Agricultural Sciences. https://edis.ifas.ufl.edu/AE021
F. T. Izuno and D. Z. Haman. Basic Irrigation Terminology. AE-66. Gainesville: University of Florida Institute of Food and Agricultural Sciences. https://edis.ifas.ufl.edu/AE115
E. H. Simonne, M. D. Dukes, D. Z. Haman. "Principles and Practices of Irrigation Management for Vegetables." In: D. N. Maynard and S. M. Olson (eds.) Vegetable Production Guide for Florida, pp.31–37. Gainesville: University of Florida Institute of Food and Agricultural Sciences.
Drip System Maintenance
Treating Irrigation Systems with Chlorine, G. A. Clark and A. G. Smajstrla, Circ. 1039. Gainesville: University of Florida Institute of Food and Agricultural Sciences. https://edis.ifas.ufl.edu/AE080
Injection of Chemicals Into Irrigation Systems: Rates, Volumes, and Injection Periods, G. A. Clark, D. Z. Haman and F. S. Zazueta. Bul. 250. Gainesville: University of Florida Institute of Food and Agricultural Sciences. https://edis.ifas.ufl.edu/AE116
Causes and Prevention of Emitter Plugging in Microirrigation Systems, D. J. Pitts, D. Z. Haman and A. G. Smajstrla, Bul. 258. Gainesville: University of Florida Institute of Food and Agricultural Sciences. https://edis.ifas.ufl.edu/AE032
Drip System Components
Micro-irrigation on Mulched Bed Systems: Components, System Capacities, and Management, G.A. Clark, C.D. Stanley, and A.G. Smajstrla, Bul. 245. Gainesville: University of Florida Institute of Food and Agricultural Sciences. https://edis.ifas.ufl.edu/AE042
Media Filters for Trickle Irrigation in Florida, D.Z. Haman, A.G. Smajstrla, and F.S. Zazueta, Fact Sheet AE-57. Gainesville: University of Florida Institute of Food and Agricultural Sciences. https://edis.ifas.ufl.edu/WI008
Screen Filters in Trickle Irrigation Systems, D.Z. Haman, A.G. Smajstrla and F.S. Zazueta, Fact Sheet AE-69. Gainesville: University of Florida Institute of Food and Agricultural Sciences. https://edis.ifas.ufl.edu/WI009
Principles of Micro Irrigation, D.Z. Haman and F.T. Izuno, Fact Sheet AE-24. Gainesville: University of Florida Institute of Food and Agricultural Sciences. https://edis.ifas.ufl.edu/WI007
Chemical Injection Methods for Irrigation, D.Z. Haman, A.G. Smajstrla and F.S. Zazueta, Circ. 864. Gainesville: University of Florida Institute of Food and Agricultural Sciences. https://edis.ifas.ufl.edu/WI004
Measuring Pump Capacity for Irrigation System Design, A.G. Smajstrla, D.Z. Haman and F.S. Zazueta, Circ. 1133. Gainesville: University of Florida Institute of Food and Agricultural Sciences. https://edis.ifas.ufl.edu/AE067
Florida Backflow Prevention Requirements for Agricultural Irrigation Systems, A.G. Smajstrla, D.S. Harrison, W.J. Becker, F.S. Zazueta, and D.Z. Haman, Bul. 217, UF/IFAS Extension. Gainesville: University of Florida Institute of Food and Agricultural Sciences.
Drip System Design
Water Hammer in Irrigation Systems, G.A. Clark, A.G. Smajstrla, and D.Z. Haman, Circ. 848. Gainesville: University of Florida Institute of Food and Agricultural Sciences. https://edis.ifas.ufl.edu/AE066
Design Tips for Drip Irrigation of Vegetables, D.Z. Haman and A.G. Smajstrla, Fact Sheet AE-260. Gainesville: University of Florida Institute of Food and Agricultural Sciences. https://edis.ifas.ufl.edu/AE093
Efficiencies of Florida Agricultural Irrigation Systems, A.G. Smajstrla, B.J. Boman, G.A. Clark, D.Z. Haman, D.S. Harrison, F.T. Izuno, D.J. Pitts and F.S. Zazueta, Bul. 247. Gainesville: University of Florida Institute of Food and Agricultural Sciences. https://edis.ifas.ufl.edu/AE110
Field Evaluation of Microirrigation Water Application Uniformity, A.G. Smajstrla, B.J. Boman, D.Z. Haman, D.J. Pitts, and F.S. Zazueta, Bul. 265. Gainesville: University of Florida Institute of Food and Agricultural Sciences. https://edis.ifas.ufl.edu/AE094
Flushing Procedures for Microirrigation Systems, A.G. Smajstrla and B.J. Boman, Bul. 333. Gainesville: University of Florida Institute of Food and Agricultural Sciences. https://edis.ifas.ufl.edu/WI013
Irrigation Scheduling
Microirrigation in Mulched Bed Production Systems: Irrigation Depths, G.A. Clark and D.Z. Haman, Fact Sheet AE-49. Gainesville: University of Florida Institute of Food and Agricultural Sciences. https://edis.ifas.ufl.edu/AE049
Using Reference Evapotranspiration Data, G.A. Clark, Fact Sheet 251. Gainesville: University of Florida Institute of Food and Agricultural Sciences. https://edis.ifas.ufl.edu/AE073
Scheduling Tips for Drip Irrigation of Vegetables, D.Z. Haman and A.G. Smajstrla, Fact Sheet AE-249. Gainesville: University of Florida Institute of Food and Agricultural Sciences. https://edis.ifas.ufl.edu/AE092
Alternatives of Low Cost Soil Moisture Monitoring Devices for Vegetable in South Miami-Dade County. R. Muñoz-Carpena, Y. Li and T. Fact Sheet AE-230. Gainesville: University of Florida Institute of Food and Agricultural Sciences. https://edis.ifas.ufl.edu/AE230
Using Tensiometers for Vegetable Irrigation Scheduling in Miami-Dade County, T. Olczyk, Y. Li, and R. Munoz-Carpena, FactSheet ABE 326. Gainesville: University of Florida Institute of Food and Agricultural Sciences. https://edis.ifas.ufl.edu/TR015
On-farm Irrigation Scheduling for Vegetables Using the Watermark Soil Moisture Sensor, E. Simonne, A. Andreasen, D. Dinkins, J. Fletcher, R. Hochmuth, J. Simmons, M. Sweat, and A. Tyree, Proceedings of the 2001 Florida Agricultural Conference & Trade Show, Lakeland FL, October 2-3, 2001, pp. 17-22.
Basic Irrigation Scheduling in Florida, A.G. Smajstrla, B.J. Boman, D.Z. Haman, F.T. Izuno, D.J. Pitts and F.S. Zazueta, Bul. 249. Gainesville: University of Florida Institute of Food and Agricultural Sciences. https://edis.ifas.ufl.edu/AE111
Irrigation Scheduling with Evaporation Pans, A. G. Smajstrla, F. S. Zazueta, G. A. Clark, and D. J. Pitts, Bul. 254. Gainesville: University of Florida Institute of Food and Agricultural Sciences. https://edis.ifas.ufl.edu/AE118
Trickle Irrigation Scheduling. I: Duration of Water Application, A.G. Smasjtrla, D.S. Harrison, and G.A. Clark, Bul. 204. Gainesville: University of Florida Institute of Food and Agricultural Sciences.
Potential Impacts of Improper Irrigation System Design, A.G. Smajstrla, F.S. Zazueta, and D.Z. Haman, Fact Sheet AE-73. Gainesville: University of Florida Institute of Food and Agricultural Sciences. https://edis.ifas.ufl.edu/AE027
Tensiometers for Soil Moisture Measurement and Irrigation Scheduling, A.G. Smajstrla and D.S. Harrison, Circ-487. Gainesville: University of Florida Institute of Food and Agricultural Sciences. https://edis.ifas.ufl.edu/AE146
Tensiometer Service, Testing and Calibration, A.G. Smajstrla and D.J. Pitts, Bul. 319. Gainesville: University of Florida Institute of Food and Agricultural Sciences. https://edis.ifas.ufl.edu/AE086
Nutrient Management
G. Hochmuth. Plant Petiole Sap-testing for Vegetable Crops. Circ. 1144. Gainesville: University of Florida Institute of Food and Agricultural Sciences. https://edis.ifas.ufl.edu/CV004
G.J. Hochmuth and A.G. Smajstrla. Fertilizer Application and Management for Micro (Drip)-irrigated Vegetables Cir. 1181. Gainesville: University of Florida Institute of Food and Agricultural Sciences. https://edis.ifas.ufl.edu/CV141
G.J. Hochmuth and E.A. Hanlon. Commercial Vegetable Fertilization Principle. Circ. 225-E. Gainesville: University of Florida Institute of Food and Agricultural Sciences. https://edis.ifas.ufl.edu/CV009
G.J. Hochmuth and E.A. Hanlon. IFAS Standardized Fertilization Recommendations for Vegetable Crops. Circ. 1152. Gainesville: University of Florida Institute of Food and Agricultural Sciences. https://edis.ifas.ufl.edu/CV002
Simonne, E.H. and G.J. Hochmuth. Soil and Fertilizer Management for Vegetable Production in Florida. In: D.N. Maynard and S.M. Olson (eds.) Vegetable Production Guide for Florida. Gainesville: University of Florida Institute of Food and Agricultural Sciences.
Typical bed spacing used in vegetables production and corresponding linear bed feet per acre. This spacing is used for fertilizer recommendations. When a different bed spacing is used, fertigation should be adjusted accordingly.
Levels of fertilizer and water management and corresponding fertilization and irrigation practices for vegetables.
Comparison of methods available for determining crop water use and their adoption level by the vegetable industry in Florida. Although the most promising method uses real-time potential evapotranspiration data, empirical methods are most commonly used by the industry.
Effect of irrigation amount on water movement in three vegetable growing areas of Florida. Increasing irrigation volume increases vertical downward movement at a faster rate than the lateral movement. Emitter-to-emitter coverage (length) was reached after 3 hours with 12-in emitter spacings, while it was reached in only one hour with 4-in emitter spacing.
Comparison of soil moisture measuring devices available to vegetable growers. While cost of the unit is always an issue, adoption of these techniques has been mainly determined by maintenance, reliability and dedication issues.