The Savvy Survey #6c: Constructing Closed-Ended Items for a Questionnaire
Introduction
There are five publications in the Savvy Survey Series that provide an introduction to important aspects of developing items for a questionnaire. In particular, this publication presents an overview of constructing closed-ended items for a questionnaire. Several resources that give in-depth information on developing questionnaires that may be useful during the construction phase include Dillman, Smyth, and Christian (2014) and de Leeuw, Hox, and Dillman (2008).
Remember, the two major question types used in a questionnaire include
- open-ended—a blank answer space provided for a description of explanation, a list of items, numbers, or dates; and
- closed-ended—response choices provided (scale, ordered, unordered, or partial).
Each of these question types has unique characteristics that may be of use within a survey. This publication looks at the characteristics of the closed-ended question.
What are closed-ended questions?
Closed-ended questions are often used to describe a person's attributes, beliefs, or attitudes (Dillman et al., 2014).
The closed-ended format provides the person taking the survey with a range of response options that he/she can select from to indicate his/her answer.
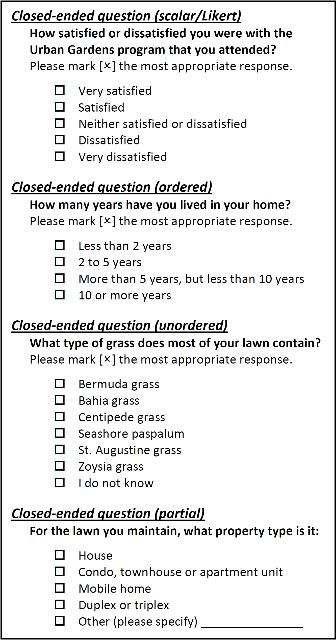
There are four closed-ended question types (see Figure 1):
- Scalar/Likert—responses use a predetermined scale or continuum
- Ordered—responses have some identifiable order
- Unordered—responses have no identifiable or logical order
- Partial—responses include an "Other, (please specify)" option
These four question types can all be used within a single questionnaire.
Regardless of the closed-ended question type selected, it is important to carefully craft the options being provided. To ensure greater confidence in the findings, response options for closed-ended questions should be:
- Easy to understand
- Avoid using jargon or language that is difficult to understand.
- Avoid using "negatives" in the question stem since negative questions can be confusing to those taking the survey.
2. Mutually exclusive answers
- Ensure that responses do not overlap.
3. Exhaustive answers
- Include a list of all answers that are reasonably possible.
- In situations where an exhaustive list is not available or practical, the survey designer can choose to use a partial closed-ended question with a response option that states Other (please specify).
4. Equal in presenting both the positive and negative sides in the question stem
- This is especially true when asking either/or types of questions.
- Poor construction: How much do you agree with the following statement...
- Better construction: How much do you agree or disagree with the following statement...
5. Conceptually spaced so that the categories are consistent with measurement intent
- Unbalanced categories may be limited to only certain types of analysis, while balanced categories can be used for more advanced statistical analysis.
- See Savvy Survey Series #6e for a more detailed discussion on measurement levels and analysis.
It is also possible to group scalar questions that target the same concept in order to create a matrix (see Figure 2). In a matrix, the response categories are typically placed horizontally along the top of the response area, with the targeted items listed vertically down the left-hand side (as shown in Figure 2).
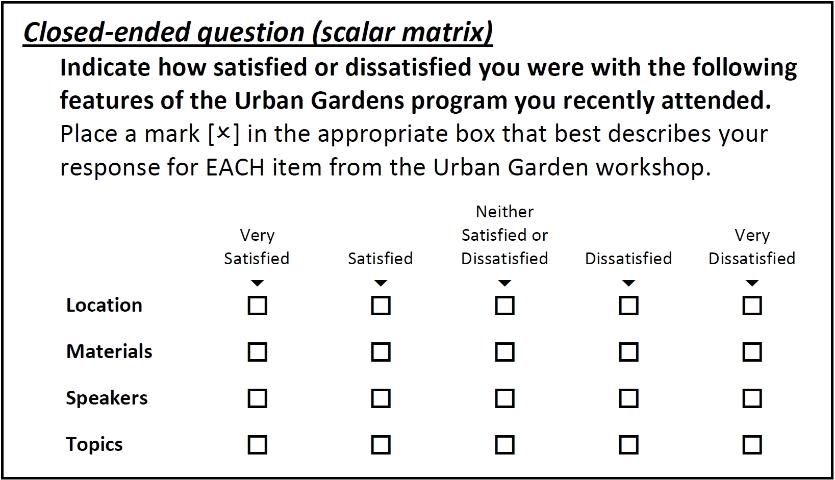
If using a scalar matrix, it is important to limit the items that are included in a single matrix to the number needed for an accurate and reliable measure (so that the burden on respondents is minimized). Respondents can tire over the course of answering a long list to a greater extent than for a short list and, thus, pay comparatively less attention to the items (Kinnell and Dennis, 2011). On the other hand, to gain a more accurate picture of attitudes or beliefs, it is a best practice to use a set of 5–8 items in a single matrix for measuring many concepts.
In addition to limiting the number of items in a list, it is also a common practice to limit the number of response categories in the scale. In general, bipolar scales that measure both direction and intensity (e.g., strongly agree to strongly disagree) should have 5 or 7 response options (Dillman et al., 2014). Similarly, unipolar scales that measure intensity only (e.g., no agreement to complete agreement) typically have 4 or 5 response options.
Depending on how the question stem is worded, there are several possible scales that could be used for rating questions. The scale chosen should be matched carefully with the wording used in the question stem so that a logical set of responses is provided. Some common bi-polar scales include
- very satisfied to very dissatisfied,
- strongly agree to strongly disagree,
- complete success to complete failure, and
- numerical (e.g., -3 to +3).
Common uni-polar scales include
- extremely important to not at all important,
- high priority to low priority,
- completely agree to no agreement,
- all of the time to never, and
- numerical (e.g., 1 to 5).
Note that numerical scales should be used carefully, since respondents may actively avoid using mid- and low-values when labeled with zero and negative codes (Sangster et al., 2001). It is possible to reduce or eliminate the effect of numeric labels when all scale points have both word labels and numeric codes or if the numeric scale is being used for items that are seen as "less personal."
Here are some additional considerations to think about when constructing a scalar matrix:
- Conceptually grouping items
- Group items that are similar together; this helps increase a person's recall of relevant information while they are taking the survey.
2. Providing balanced scales and question stems
- In addition to avoiding biased language in the question stem, use an equal number of "positive" and "negative" response options.
- If two positive options are on the scale (Strongly Agree, Agree), then two negative options of equal weight must be provided (Strongly Disagree, Disagree).
3. Limiting the number of scalar categories to four or five
- Use four categories if opting for no "middle ground" response.
- Use five if wishing to include a neutral response option.
- A "neutral" response is different than No Opinion or Not Applicable. A neutral response captures a truly neutral stance (one that exists, but is neither positive nor negative in nature), while the others are statements that either no opinion actually exists or the item is not applicable to the respondent.
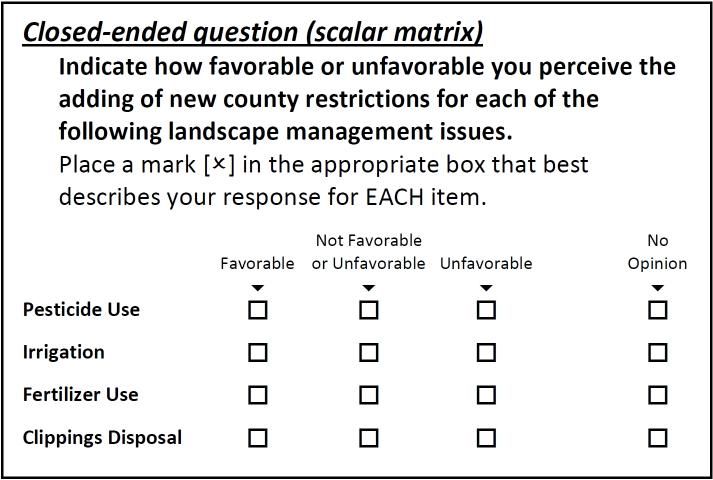
4. Whether it is appropriate to include a non-scalar option like Not Applicable or No Opinion (see Figure 3)
- This option is not mandatory, but does provide people with an appropriate way to answer the question when no other response is accurate for them.
- If a non-scalar option is included, then it is important to visually separate these non-scalar responses from scalar ones, as seen with the No Opinion response option in Figure 3.
Guidelines for Creating Closed-Ended Questions
Several guidelines for creating closed-ended items have been suggested by Dillman et al. (2014).
When asking unordered closed-ended questions:
- If asking respondents to rank items, provide respondents with several small groups of target items (5–7) rather than a single, long list.
- Avoid bias from unequal comparisons by avoiding adjectives that might impact how the respondent views the choices.
- amazing UF/IFAS Extension staff
- volunteers
- participants
- UF/IFAS Extension staff
- Volunteers
- Initial version: Which of the following has the greatest impact on the success of a UF/IFAS Extension program?
- Improved revision: Which of the following has the greatest impact on the success of a UF/IFAS Extension program?
Participants
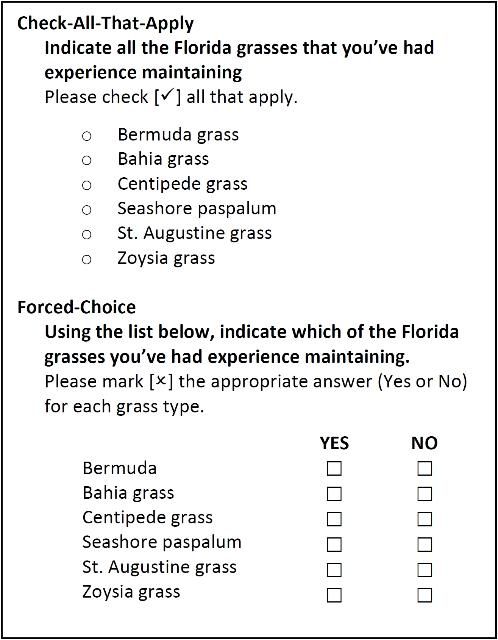
3. Use forced-choice questions by either asking for the best answer or Yes/No (see Figure 4) instead of check-all-that-apply (Smyth et al., 2006).
4. Consider using differently shaped answer spaces (i.e., circles versus squares) to help respondents distinguish between single- and multiple-answer questions.
- This guideline becomes moot when using an online mode, as it is a standard feature within most online survey platforms (i.e., Qualtrics).
When asking ordered closed-ended questions, be sure to:
- If using a scale, choose an appropriate scale length:
- 5 or 7 response options for bipolar scales
- 4 or 5 response options for unipolar scales
2. Choose direct or construct-specific labels to improve understanding and avoid confusion.
- If you ask about the importance of a topic, use a response scale that also uses "importance" language.
- Initial version: strongly agree to strongly disagree
- Improved revision: not at all important to very important
3. Provide scales that approximate the actual distribution of the variable characteristic in the population of interest.
- For example, when using income categories (Less than $15,000, $15,000 to $29,999, $30,000 to $44,999, $45,000 to $59,999, $60,000 and above), the middle category should contain the median income for the population of interest.
- Note the use of the median income, not the average, since income is a variable that is known to be easily impacted by only a few very high responses. In variables such as these, it is better to select the middle (median) number as opposed to the average (mean).
4. Provide balanced scales where categories are relatively equal distances apart conceptually.
- Again, use equal positive and negative options with similar weights: If (Strongly Agree, Agree), then (Strongly Disagree, Disagree).
- Also, attempt to make the weight of categories conceptually equal (e.g., for the income category example above, each category has approximately the same weight, about $15,000, except for the last category).
5. Consider how verbally labeling and visually displaying all response categories may influence answers.
- Visual spacing can impact responses
- Use equal spacing between items to limit bias
6. Align response options vertically in one column or horizontally in one row.
Limitations of Closed-Ended Questions
Though quite useful, closed-ended questions do have some limitations. Closed-ended questions can provide respondents with answers they may not have considered otherwise, while at the same time, not offering an answer that accurately captures their true answer. By lacking the desired answer, the respondent can become frustrated in the survey process. This limitation points to the value of pre-testing every instrument prior to using it for actual data collection (see Savvy Survey #8 for further information on pre-testing questionnaires).
In Summary
Developing a high-quality questionnaire is a critical step for collecting useful data for assessing program needs and evaluating the outcomes of programs. The items that are used to collect information must be carefully constructed so that those taking the survey have the ability to answer as easily and accurately as possible. This publication provided an overview of the guidelines for constructing and using closed-ended questions in a questionnaire. The next publication will continue with this topic by examining how to construct indices for a questionnaire.
References
de Leeuw, E. D., Hox, J. J., and Dillman, D. A. (Eds.). (2008). International handbook of survey methodology. New York, NY: Lawrence Erlbaum Associates.
Dillman, D. A., Smyth, J. D., and Christian, L. M. (2014). Internet, phone, mail, and mixed-mode surveys: The tailored design method. (4th ed.). Hoboken, NJ: John Wiley and Sons.
Kinnell, Angela and Dennis, S. (2011). The list length effect in recognition memory: an analysis of potential confounds. Memory & Cognition, 39(2), 348–63.
Sangster, R. L., Willits, F. K., Saltiel, J., Lorenz, F. O., and Rockwood, T. H. (2001). The effects of numerical labels on response scales. Paper presented at the annual meeting of the Survey Research Methods Section of the American Statistical Association, Atlanta, GA.
Smyth, J.D., Dillman, D. A., Christian, L. M., and Stern. M. J. (2006). Comparing check-all and forced-choice question formats in web surveys. Public Opinion Quarterly, 70(1), 66–77.