Particulate Phosphorus in the Everglades Agricultural Area: II—Transport Mechanisms
Introduction
In Part I of this series (SL 197), sources and characteristics of particulate phosphorus in the Everglades Agricultural Area (EAA) farm canals were discussed. The particulate phosphorus discharged from EAA farms originates primarily from the aquatic plant growth within farm irrigation and drainage canals. This system contains a biological pool of aquatic and planktonic plants in various stages of growth and senescence, and their accompanying detritus, which is also in various stages of decomposition and consolidation.
The biomass that makes up this pool has a phosphorus mass fraction that is, on average, substantially higher than that of farm soil and field litter. The normal transport mode for dense mineral sediments found in upland drainage systems is movement by saltation as bed load along the channel bottom. This transport mode is not the case in the EAA. Here, the transported solids are typically light, flocculent, and mobile, moving as suspended load distributed throughout the water column.
These solids may be existing suspended matter such as plankton, disengaged material from floating aquatic plants, or re-suspended detrital material from the channel bed. They may also be material eroded from the base sediment that is continually being built by the processes of biological senescence, deposition, and consolidation. The biological nature of this pool gives rise to dynamic changes that may not normally occur in systems that are principally mineral in nature. The heterogeneity of the sources of suspended solids results in varied erosion rates, sedimentation velocities, and rates of disengagement of attached plant growth from plant substrates.
This document presents the principles of erosion and transport that apply to EAA sediments and suspended solids. The impact of the biological sources and the heterogeneous nature of the suspended solids on particulate phosphorus export is discussed, with examples. Finally, general recommendations for control of particulate phosphorus export are made.
Cohesive Sediment Erosion Principles
The organic sediments of the EAA are similar to cohesive clay sediments in their erosion characteristics (Stuck, 1996). The behavior of cohesive sediments may be illustrated briefly in simplified form as follows:
As water flows over material, its energy may cause some of the material to disengage and enter the flowing water. Resistance to this disengagement is referred to as shear strength. An idealized sediment bed will have a shear strength and a yield strength. Hydraulic stresses less than the bed shear strength will cause minimal erosion. As shear stress on the bed increases beyond the bed shear strength, erosion from the surface of the bed will proceed at a rate that is proportional to the excess of the bed shear stress compared to the bed shear strength. This is called the Bed Erosion Regime. At some point the shear stress will exceed the yield strength of the bed. At this point the forces on the bed exceed the cohesive forces holding the bed together and the bed starts to break up. As water velocity increases, the bed continues to break up more rapidly. Solids mobilization in this region is much greater than in the Bed Erosion Regime. This phase is called the Bed Transport Regime.
In both regimes erosion rate is directly proportional to shear stress. It is important to understand, however, that shear stress is proportional to the square of velocity. In the most simplified form the relationship between erosion rate and velocity in the Bed Erosion Regime is given by the equation in Figure 1:
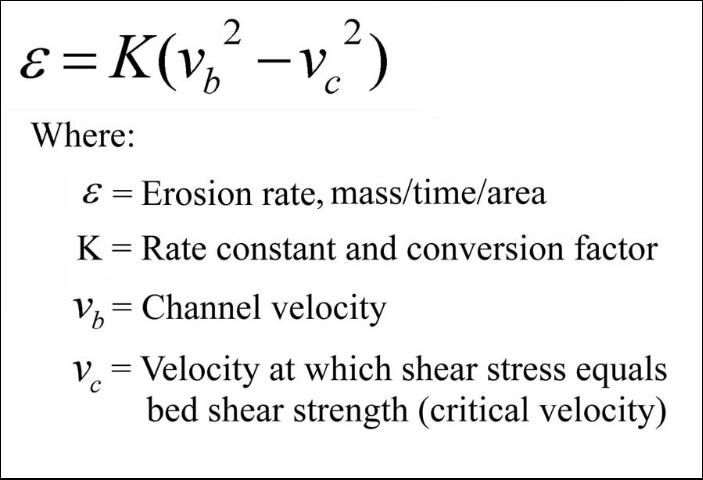
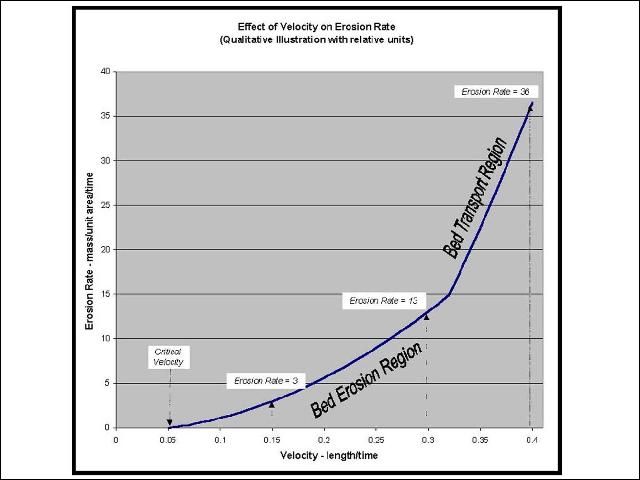
Figure 2 shows this relationship in qualitative form with arbitrary units. In this idealized case, no erosion takes place until the critical velocity of 0.05 units is reached. At that point, the erosion rate increases as a function of the difference between the square of the channel velocity and the square of the critical velocity. At a velocity of 0.32 units the yield strength of the bed is exceeded, the bed starts to disintegrate, and the regime shifts to Bed Transport. The bed transport region may be described by an equation similar to Figure 1, but with a different critical velocity, and a much higher erosion coefficient.
Several important points may be made from this simplified illustration:
-
First, at relatively low velocities, there is zero to minimal erosion and particle mobilization.
-
Beyond the critical velocity, the particle-mobilization rate increases with the square of the velocity. In our example, the erosion rate at a velocity of 0.15 velocity units is 3 rate units. Doubling the velocity to 0.30 velocity units increases the erosion to 13 rate units, more than a four-fold increase in particle mobilization.
-
An additional increase in velocity to 0.40 units causes the system to enter the Bed Transport Region. Here, where mobilization is even greater, the erosion rate increases to 36 units, almost a three-fold increase arising from a 25% increase in velocity.
This example illustrates the significant changes that may occur within relatively narrow flow rates. In the EAA, pumping rates may easily be doubled or tripled by running multiple pumps or switching from small to large capacity pumps. Velocities may also change rapidly when canals are drawn down to low levels. These operating factors can have profound impact on particle mobilization rates.
Distribution of Particle Characteristics
The diversity of particulate phosphorus sources in the farm channel systems gives rise to a particle population that has a broad spectrum of properties. The simplified erosion curve shown in Figure 2 must be replaced by a family of curves to describe this diversity of phosphorus sources, including multiple classes of organic and inorganic particulate matter in various stages of growth, senescence, and decomposition.
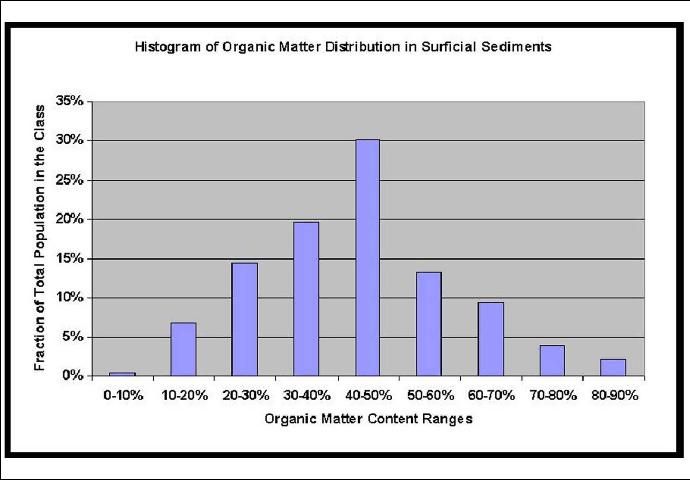
An example of the diversity of population characteristics is illustrated in Figure 3, which shows a histogram of the organic matter mass fraction of surficial sediment samples taken from a typical sugarcane farm in the EAA over a two-year period. The dispersion of organic matter mass fraction is evident in this histogram. The chemical and transport characteristics of EAA sediments are strongly influenced by the organic matter mass fraction, as well as the biological status of the organic matter. At the upper end, high organic-mass fraction matter tends to be light and flocculent, with high phosphorus mass fractions. It has low bulk density, and is readily transportable. Conversely, at the low end, low organic-mass fraction matter tends to be dense, stable, and relatively immobile, with low phosphorus mass fractions.
The amount and physiological condition of the various types of organic matter present in a water conveyance system varies with time and flow. Biological growth incorporates soluble phosphorus into particulate matter, represented by the plant biomass. Plant death and decomposition releases some phosphorus as soluble phosphorus, and releases some plant biomass as mobile particulate matter. In stagnate conditions the particulate matter accumulates in place. In irrigated conditions, this matter may be transported upstream. With drainage conditions, particulates may be transported downstream and ultimately discharged. The response to all these conditions causes a continuing change in the amounts and locations of particulate phosphorus.
The Effect of Time on Characteristics of the Particulate Phosphorus Pool
One important result of this dependence on time and flow is the build-up of organic material in canals during inter-event times (times between pumping events), followed by the discharge of some or all of this material during pumping events. Figure 4 illustrates this effect. The data for Figure 4 comes from a one-year study of an 8,000-acre drainage basin that discharges to Lake Okeechobee through a single pump station location (Izuno et al., 1998). Total suspended solids (TSS) concentration is used as the measure of particulate matter present in the drainage water. he concentration is the average TSS concentration during the first day of pumping of each pumping event. Interevent Time is the time from cessation of pumping in the prior event to the start of pumping of the current event.
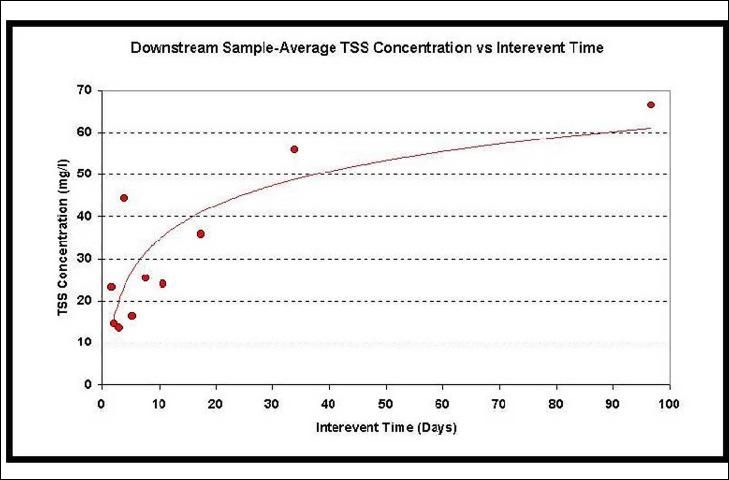
There is a clear pattern of increasing TSS concentration with increasing interevent time. This general pattern is measured consistently at all locations studied in the EAA. This pattern is interpreted as an indication of the build-up of living biomass and detritus between events, followed by the partial flushing of the mobile fraction of the built up biomass. As time passes, detritus released by plant senescence becomes compacted and more difficult to mobilize, thus the increase of TSS with time tends to taper off as long interevent times are encountered.
The Effect of Turbulence on the Characteristics of Transported Particulate Phosphorus
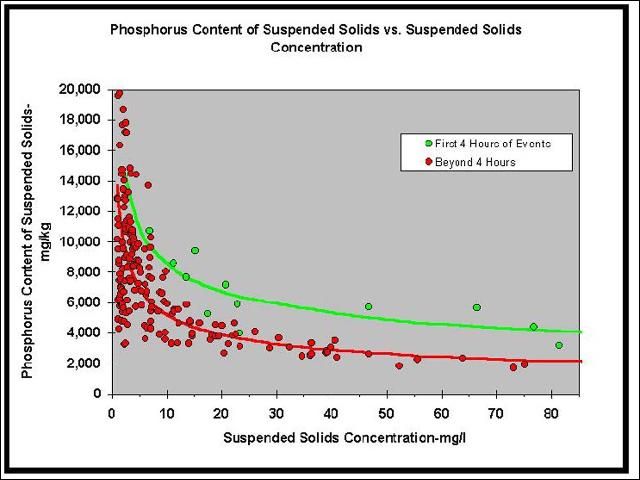
The various classes of material present in a water conveyance system also respond differently to changing hydraulic conditions. Figure 5 shows the phosphorus concentration of suspended solids, sampled from the discharge of an EAA farm through one wet-season cycle, plotted against the TSS concentration of those samples. Phosphorus mass fraction is an indicator of the biological viability of organic matter. In general, the higher the phosphorus mass fraction, the more labile the organic matter, and the lower the phosphorus mass fraction, the older and more mineralized the organic matter.
The graph in Figure 5 clearly shows decreasing phosphorus mass fraction of the TSS as the TSS concentration in the farm discharge increases. This plot should not be interpreted to imply that phosphorus mass fraction is a function of TSS concentration. More appropriately, both phosphorus mass fraction and TSS concentration are a function of another controlling parameter, namely the level of turbulence present in the system.
The best interpretation of Figure 5 is as follows. At low turbulence levels, where TSS concentrations are low, only light, flocculent readily mobilized matter will be transported. As turbulence levels increase the forces of disengagement, erosion, and particle transport increase and TSS levels increase. Progressively increasing these forces causes progressively denser material to be mobilized. In general, the light material is the freshest biologically, with the highest phosphorus mass fraction, while the densest material corresponds to the oldest, most mineralized organic matter. In between, there is a spectrum of ages, degrees of mineralization, and relative proportions of young-light and old-dense matter.
The effect of interevent time is also shown in this graph. The data points are segregated into two classes. The first class contains samples that were taken during the first four hours of a pumping event. The second class contains samples that were taken after four or more hours of pumping time. For any given TSS concentration, the samples taken during the first four hours of pumping consistently have higher phosphorus mass fraction than those taken four hours or more after the start of a pumping event. This is a strong indication that the material first mobilized during pumping events comes from the labile organic pool that has been formed by biological activity during the quiescent interevent period. Figure 5 shows why the amount of particulate phosphorus and the phosphorus mass fraction of system particulate matter can vary with time and flow.
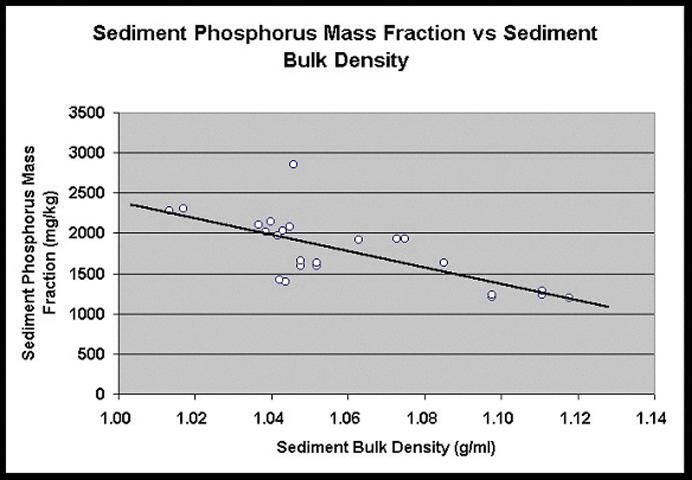
This trend can also be shown in a more general way. The bulk density of a sediment is related to its transportability. Sediments with lower bulk densities are more mobile than sediments with higher bulk densities. In a study specific to the EAA, samples of discharged suspended solids were collected during several pumping events from three representative farms. These suspended solids were then settled in the lab and analyzed as if they were sediments. Figure 6 shows the relationship between bulk density and phosphorus mass fraction for these samples. There is a clear relationship between lower bulk densities, i.e. higher transportability, and higher particulate phosphorus mass fraction.
Factors that Affect Particulate Phosphorus Transport
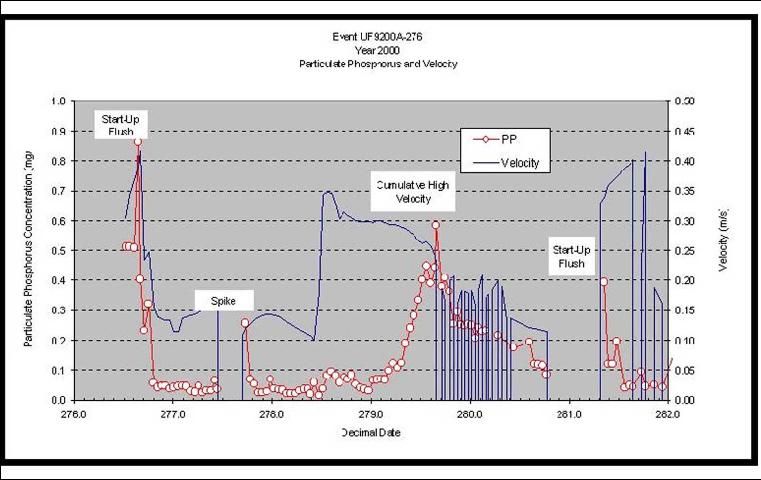
Figure 7 shows an event where discharge particulate phosphorus is plotted as a function of canal velocity. The grower typically pumps either with one large or one small electrical pump, both of which have on-off level control. Before this event, he had pumped relatively infrequently, using the small pump for a total of 82 hours and the large pump for less than 2 hours during the preceding 70 days, so there was ample opportunity for biological material to accumulate in the canals. During the pumping event, he switched from the large pump to the small one, and back, several times. There were also several instances of pump oscillation using the on-off control mechanism.
Large pump operation is indicated by velocities in the range of 0.25–0.40 m/s. Small pump operation is indicated by velocities in the range of 0.10–0.18 m/s. The effect of the interevent buildup is clearly illustrated by the initial particulate phosphorus surge, which rose to more than 0.85 mg/L (850 ppb). Figure 7 clearly shows two subsequent waves of particulate phosphorus that are associated with high velocities from the operation of the large pump.
This graphical illustration contains good examples of the primary motivating factors for the transport of particulate phosphorus. They are defined as follows:
First Flush—During the (relatively) quiescent period between pumping events, biological material can grow and accumulate in the canals. This fresh material, along with solids that were suspended at the time of shutdown in the preceding event, can be readily suspended by the turbulent conditions that exist at pump start-up. This highly mobile material causes a high concentration of suspended solids during the early periods of pump events. Eventually, this highly mobile material flushes out and the process of erosion proceeds on the less mobile particulate matter in the canals.
Cumulative High Velocity—The normal erosion process at constant velocity produces (in the idealized case) a steadily increasing discharge concentration of suspended solids. The reason for this increase is that water farther upstream has a longer time to accumulate eroded suspended solids as it moves downstream to the discharge point. There is, as mentioned previously, a critical velocity below which erosion is negligible. It was also illustrated that the erosion rate process is proportional to the square of the velocity that is in excess of the critical velocity. So if, for example, excess velocity increases to twice its original rate, the process of erosion will proceed four times as fast. However, if there is a substantial increase in velocity, there will not necessarily be an immediate increase in suspended solids concentration at the pump discharge, because of the lag time (just described) for the flowing water to accumulate additional suspended solids. There are often circumstances during pumping events when velocity may change significantly, such as when a larger pump is started up or when canal depth becomes shallow, significantly reducing crossectional area available for flow. The effects of this velocity increase are not seen until sometime later, so changes in concentration may be affected by cumulative high velocity.
This process also proceeds after first flush, as long as velocity is sufficiently high. First flush mobilizes the material remaining close to the pump station from the previous event as well as the highly mobile new material that has grown in the interevent period. After first flush, the sustained high velocity will continue to mobilize particulate phosphorus, the continued export of which will exhibit the lag just described.
Restart Flush—When pumping is terminated, suspended solids in the canal system settle out into place. If there had been a significant concentration of suspended solids in the downstream reaches of the canal system at shutdown, there will be a high initial concentration in the discharge when the pump is restarted.This is similar to First Flush, except that the time between pump shut down and restart is less that that for First Flush. In fact, the break between First Flush and Restart Flush is somewhat arbitrary, in that an event is defined as the start of pumping after more than twenty-four hours of quiescence, so a pump start after twenty-three hours would give rise to a Restart Flush, whereas a pump start after twenty-five hours would give rise to First Flush. Because they are similar, both these phenomena are grouped into the category "Start-Up Flush".
Particulate Phosphorus Spike—A spike is defined by a somewhat arbitrary definition that if the particulate phosphorus concentration for a particular sample is more than twice that of either the preceding or succeeding samples, then a spike has occurred. The spike is assumed to originate from a random release of particulate material from upstream sources, such as a collection of floating macrophytes.
Times when Particulate Phosphorus Export is Greatest
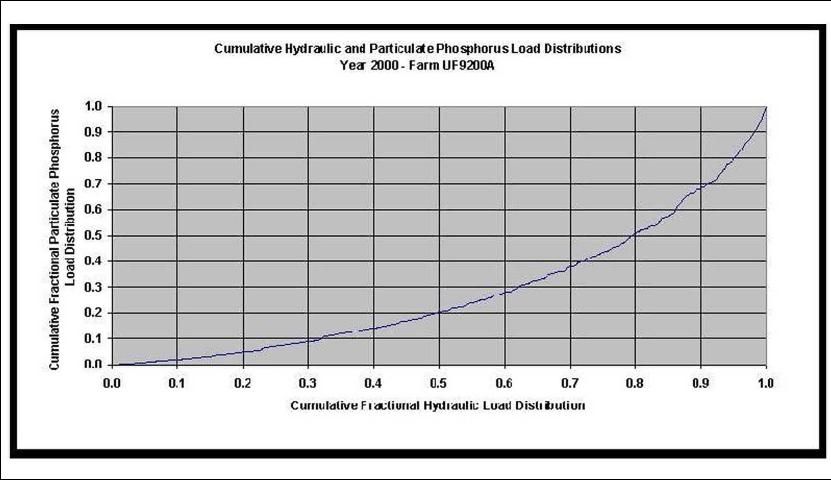
Statistical analysis of discrete sampling data taken from multiple farm locations has indicated that the bulk of the annual particulate phosphorus load is generated either during start-up flush or after times of continued high velocity. Figure 8 shows the distribution of hydraulic loads compared to the distribution of particulate phosphorus loads for a typical sugarcane farm throughout the wet season of 2000.
In Figure 8, the various "packets of water"—typically the volume pumped during a one- or two-hour period—were ranked by their particulate phosphorus load rate (kg particulate phosphorus discharged per hour). The cumulative hydraulic and particulate phosphorus loads were then calculated, in the ranked state. The resulting distribution curve shows the volumes of water sampled in their relative importance. Volumes of water that are adjacent to one another on the graph are there because they have similar particulate phosphorus load rates. They may not necessarily have been anywhere near to one another in time.
The important information to draw from Figure 8 is that 50% of the total annual particulate phosphorus load at this farm was generated by less than 20% of the hydraulic load. This pattern is seen consistently at all farms studied, and reinforces the contention that the majority of particulate phosphorus export takes place during concentrated times when specific conditions prevail. Focusing on these specific conditions when developing control strategies will yield the most productive return.
Summary of Typical Transport Mechanisms
The following picture of particulate phosphorus transport emerges:
-
The primary source of exported particulate phosphorus is biological growth in the main canal system. The hydraulic conditions in field ditches are such that particulate matter that is formed there tends to stay there in most circumstances. High velocity is the single most important factor in particulate phosphorus transport. The velocities in main canals are highest in the most downstream reaches of the canals, so the greatest tendency toward particulate phosphorus mobilization will be in the lower reaches of the main farm canals.
-
The biomass that contributes to the particulate phosphorus load is typically light and flocculent, with specific gravities and settled bulk densities much lower than those of field soil particles or compacted base sediment. The suspended solids that contribute to any given pumping event represent a thin layer, at most a few centimeters thick, of this flocculent material, along with planktonic mass dispersed in the water column, and detachable detritus and epiphytic bacterial growth associated with the floating aquatic plants in the canal system. This biomass is heterogeneous, containing materials with a wide spectrum of densities, particle sizes, and phosphorus mass fraction. The heterogeneity of the population means that different fractions of the exportable particulate phosphorus will be mobilized at different flow rates.
-
The simplest description of the system is one of a tri-modal population. The first group of particles is light and mobile and is readily re-suspended and transported in mild to moderate turbulence conditions. The second group is denser, and more strongly associated with either the underlying base sediment or the overlying aquatic weeds. This second fraction requires the continued application of shear stress to either erode it from the bottom, or dislodge it from the overlying plants. Continued application of shear stress, in the form of high velocity, can cause this second fraction to be mobilized in large amounts. These two fractions correspond roughly to what is exported during first flush and after continued high velocity, respectively. The third part of the tri-modal population is the particulate phosphorus that is randomly generated. The randomly generated matter can come from localized concentrations of biomass, atypical hydraulic conditions at some point in time or space, special rainfall, canal level, or pump operation circumstances, or other non-uniform events.
Conclusion—General Control Recommendations
The majority of the particulate phosphorus load of interest is sourced either by first flush or by continued high velocity. Control efforts may thus be focused on reduction of first flush and minimization of continued high velocities.
Reduction of first flush may be accomplished by preventing the formation and deposition of light biomass in the downstream reaches of the main farm canals. Continued high velocity may be addressed by both infrastructure changes and water management strategy modifications. General recommendations may be made for immediate actions to reduce particulate phosphorus export:
-
Prevent the accumulation of floating aquatic plants in the vicinity of pump stations by the use of floating booms at least 1000 ft. upstream of the pump station.
-
Regularly remove the biomass accumulated behind these booms, and transport it well away from the canal.
-
Evaluate pumping strategies and revise them to reduce velocity spikes.
-
Wherever consistent with crop drainage rate requirements, pump a given volume of water slower and throughout a longer period of time.
-
Institute level controls to prevent low canal levels, which give rise to high velocities.
-
Implement a regular canal cleaning program that focuses effort on the main farm canals, particularly the sections immediately upstream of the pump stations.
Subsequent fact sheets in this series will deal with specific actions that may be undertaken to effect these general recommendations.
References
Izuno, F.T.; Rice, R.W.; Stuck, J.D.; and Lang, T.A. 1998. Everglades Agricultural Area Sediments and Effectiveness of Soil Sediment Trapping in Rock Pit Diversions. Final Project Report submitted to the Florida Department of Environmental Protection and the Everglades Agricultural Area Environmental Protection District. Tallahassee, FL.
Stuck, J.D. 1996. Particulate phosphorus transport in the water conveyance systems of the Everglades Agricultural Area. Ph.D. dissertation submitted to the University of Florida Department of Agricultural and Biological Engineering, Gainesville, FL.