Vertical Distribution of Moisture in a Growing Sweet Corn Canopy During MicroWEX-4
Introduction
For accurate prediction of weather and near-term climate, root-zone soil moisture is one of the most crucial components driving the surface hydrological processes. Soil moisture in the top meter is also very important because it governs moisture and energy fluxes at the land-atmosphere interface and it plays a significant role in partitioning of the precipitation into runoff and infiltration.
Energy and moisture fluxes at the land surface can be estimated by Soil-Vegetation-Atmosphere-Transfer (SVAT) models. These models are typically used in conjunction with climate prediction models and hydrological models. Even though the biophysics of moisture and energy transport is well-captured in most current SVAT models, the computational errors accumulate over time and the model estimates of soil moisture diverge from reality. One promising way to improve significantly model estimates of soil moisture is by assimilating remotely sensed data that is sensitive to soil moisture, for example microwave brightness temperatures, and updating the model state variables.
The microwave brightness at low frequencies (< 10 GHz) is very sensitive to soil moisture in the top few centimeters in most vegetated surfaces. Many studies have been conducted in agricultural areas such as bare soil, grass, soybean, wheat, pasture, and corn to understand the relationship between soil moisture and microwave remote sensing. Most of these experiments conducted in agricultural regions have been shortterm experiments that captured only a part of growing seasons. It is important to know how microwave brightness signature varies with soil moisture, evapotranspiration (ET), and biomass in a dynamic agricultural canopy with a significant biomass (4-6 kg/m2) throughout the growing season.
An important component in surface microwave radiative transfer is absorption of radiation by the canopy. The absorptive effect of the canopy can be characterized by the canopy optical depth, which is a function of moisture distribution, canopy dielectric properties, and frequency. This report describes the methods and measurements of the canopy moisture distribution in sweet corn during a growing season. A physicallybased model for canopy optical depth can help improve model estimates of microwave brightness.
Fourth Microwave Water and Energy Balance Experiment (MicroWEX-4)
MicroWEX-4 was fourth in the series of experiments conducted by the Center for Remote Sensing at the University of Florida. The objective of the experiments is to understand the microwave signature of agricultural crops such as corn and cotton during different stages of growth. MicroWEX-4 was conducted during the sweet corn growing season from March 10 (Day of Year, DoY, 69) through June 14 (DoY 165) in 2005 on a 37,000 m2 field in the UF/IFAS Plant Science and Education Unit in Citra, FL (Casanova et al. 2005) During the experiment, we observed microwave brightness at 6.7 GHz using the tower-mounted University of Florida C-band Microwave Radiometer (UFCMR). Concurrent measurements were also made of micro-meteorological and vegetation parameters, soil moisture and temperature profiles, and radiation and heat fluxes at the land surface. Vertical distribution of moisture in the canopy was measured five times during the experiment: two times during the vegetative stage and three times during the reproductive stage. Casanova et al. (2005) describe the observations during MicroWEX-4. This report describes the sampling methods and the observations of vertical distribution of canopy moisture during MicroWEX-4.
Sampling Methods
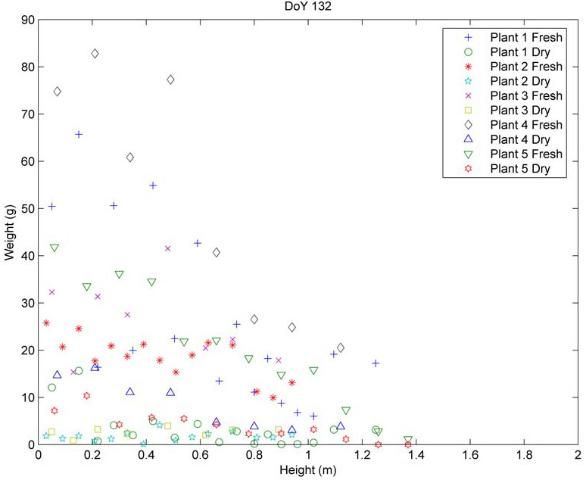
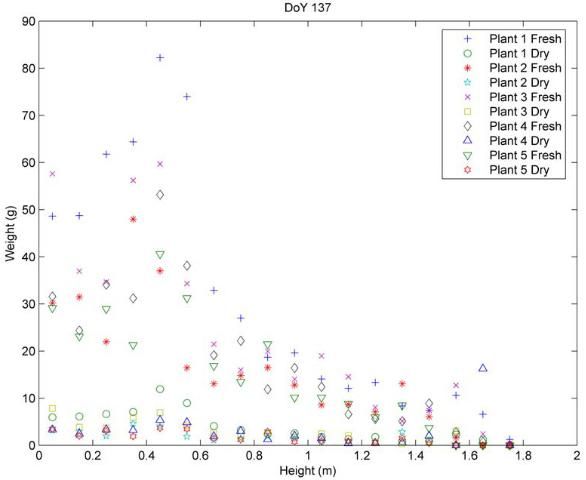
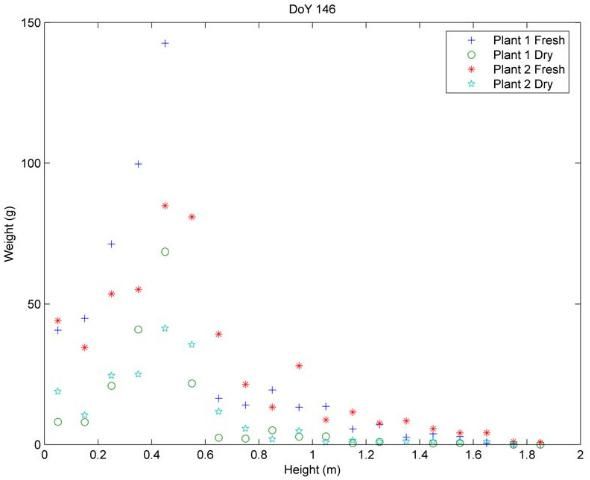
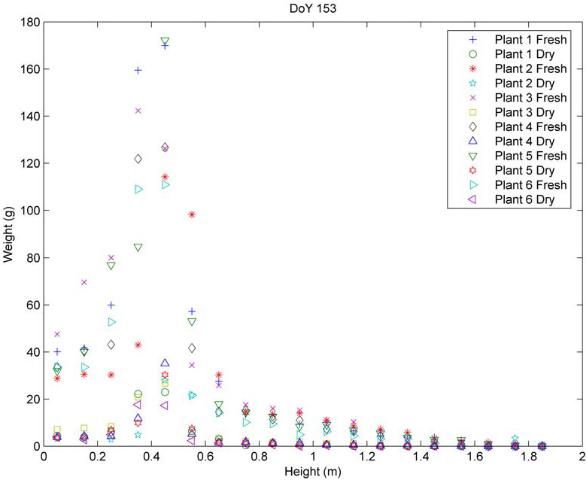
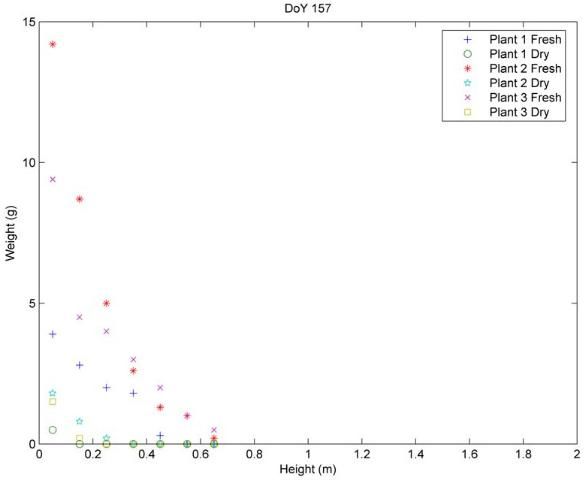
We measured the wet and dry biomass of discrete horizontal layers of individual corn plants. Five samplings were conducted during MicroWEX-4, with five plants on May 12 (DoY 132) , five plants on May 17 (DoY 137), two plants on May 26 (DoY 146), six plants on June 2 (DoY 153), and three plants on June 6 (DoY 57). The samples collected on DoY 132 and 157 consisted of plants in the vegetative stage, i.e., before tasseling, while those collected on other days consisted of plants at various reproductive stages. An additional one plant sample was obtained on DoY 157 to determine the solid density of wet vegetation.
Each sampling was conducted by selecting a representative sample of plants along a row. The plants were taken out of the ground, with roots still attached, and taken indoors to prevent moisture loss. Each plant sample was carefully laid out on a metal sheet with grid spacing of 2 cm, as shown in Figure 1(a). The leaves were "arranged" to closely match their natural orientation in the field. The plant was sliced every 10cm. The samples on DoY 132 were sliced every 5 cm to ensure that finer samples were not needed to obtain accurate moisture distribution, as shown in Figure 1(b). The sample in each layer was weighed, both fresh and after drying in the oven at 70°C for 24 hours. Weights for each plant and each layer are shown in Figures 2(a-e).
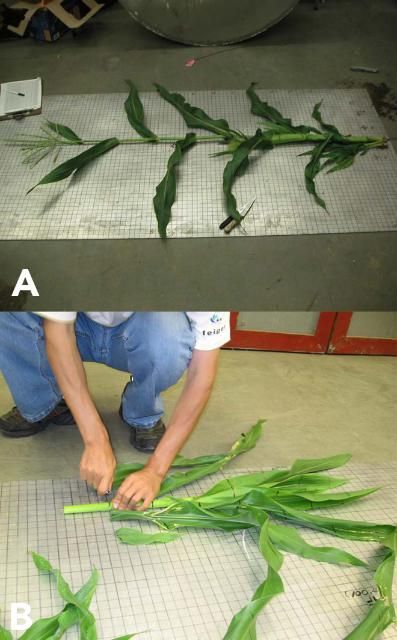
Credit: Joaquin Casanova and Mi-Young Jang, UF/IFAS
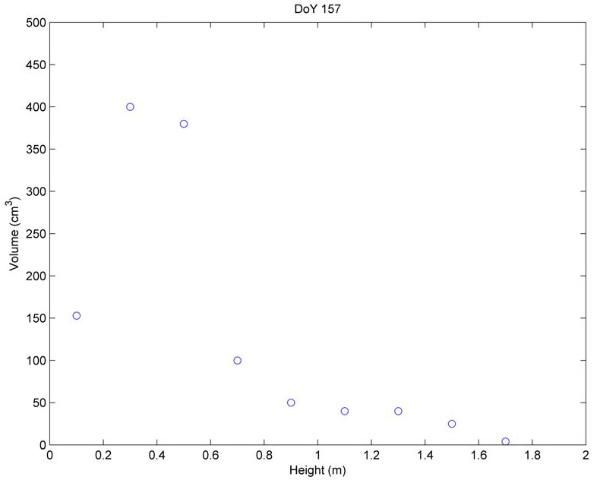
To determine the solid density of wet vegetation, the additional plant sample collected on DoY 157 was cut into 20 cm layers and weighed when fresh. The samples were then immersed in water in a graduated cylinder. The volume of the displaced water was observed, shown in Figure 3. The density of each vegetation layer was calculated as the ratio of the fresh weight to the volume displaced.
Acknowledgements
This research was supported by funding from the NASA-New Investigator Program Grant #0005065. The authors would like to thank Mr. James Boyer and his team at the PSREU for land and crop management.
Reference
Casanova, J., T. Lin, M. Jang, K. Tien, J. Judge, O. Lanni, and L. Miller. (2005). Field Observations During the Fourth Microwave Water and Energy Balance Experiment (MicroWEX-4): From March 10-June 14, 2005. Center for Remote Sensing. AE362. Gainesville: University of Florida Institute of Food and Agricultural Sciences. https://edis.ifas.ufl.edu/AE362
