Citrus Land Values Decline as Other Land Values Increase: 2001 Survey Results
The 2001 Florida Land Value Survey results indicate that the value of all types of agricultural land, except citrus, increased during the past year. Survey respondents cited nonagricultural factors (purchases by developers, speculators, and the government, as well as individuals wanting land for second homes, recreational uses, and larger homesites away from urban areas) for the relatively strong increases over the past year. Agricultural land values vary by the type of land use and geographic area.
The Florida Land Value Survey, conducted by the Food and Resource Economics Department at the University of Florida, provides estimates of the value of different types of agricultural land for geographic regions of the state. The survey questionnaire was designed to obtain estimates of the market value for different types of land as of May 2001. Survey respondents included rural appraisers, farm lenders, real estate brokers, farm managers, land investors, county extension agents, Farm Services Agency and Natural Resource and Conservation Service personnel, county property appraisers, and others who develop and maintain information about rural land values in their areas. Respondents provided 210 usable county reports for the 2000 survey.
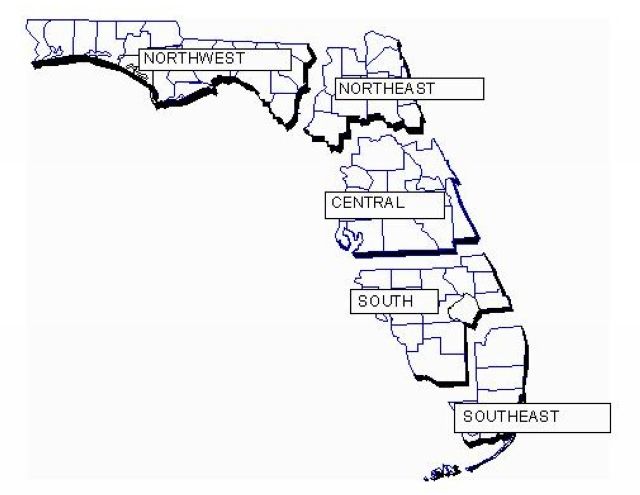
The state was divided, based on agricultural production, into four major regions, namely Northwest, Northeast, Central, and South (Figure 1). A fifth region, Southeast, was delineated as a result of the impact of urbanization in southeast Florida. Even though the state was divided into more homogeneous regions, wide variation in agricultural land values still exists within each region.
Changes in Type of Land Use
The value of land used for crops and pasture increased in all regions. The value of cropland increased from three to 17 percent, and the value of improved and unimproved pasture land increased from six to 12 percent. The value of farm woods increased 12 percent. However, the value of orange groves declined from nine to 11 percent and the value of grapefruit groves declined from four to 10 percent (Table 1).
Citrus
After two years of improved grove values, the value of orange and grapefruit groves declined in both the Central and South regions. The value of orange groves declined 9.4 percent in the South and 11 percent in the Central region. The value of grapefruit groves decreased 10 percent in the South and 4.3 percent in the Central region. The value of land with 5- to 7-year-old citrus plantings decreased 1.8 percent in the South region and 3.2 percent in the Central region.
Cropland
The value of cropland increased in all regions. The value of irrigated cropland increased five to six percent in the Northeast, Central, and South regions and 12.7 percent in the Northwest region. The value of nonirrigated cropland increased from 2.7 percent in the Central region to 17.4 percent in the South. The value of nonirrigated cropland increased 6.1 percent in the Northwest and 10.9 percent in the Northeast region.
Pastureland
The value of pastureland increased in all regions. The value of improved pasture increased nine to 10 percent in the southern regions and 11 percent in the northern regions. The value of unimproved pasture increased six to seven percent in the southern regions and 11 to 12 percent in the northern regions.
Farm Woods
The value of farm woods increased 12.4 percent in the Northwest region and 12.2 percent in the Northeast.
Regional Comparisons of Land Values
The average value of citrus land was higher in the South region than in the Central region. However, the value of other types of agricultural land was higher in the Central region than it was in other regions. The average value of orange groves was $6,410 per acre in the South region, about $270 per acre higher than in the Central region. The estimated value of grapefruit groves was $4,344 per acre in the South region, about $100 per acre higher than in the Central region. The average value of land with 5- to 7-year-old citrus groves was $5,802 per acre in the South region, more than $1,000 per acre higher than in the Central region.
The values of cropland and pastureland were higher in the Central region than in other regions. The lowest agricultural land values were reported in the Northwest region.
The value of irrigated cropland was $2,580 per acre in the Central region and $2,561 in the Northeast. The value of irrigated cropland in the South region was $2,150 per acre and $1,630 in the Northwest. The value of nonirrigated cropland was $2,271 per acre in the Central region and $1,960 in the Northeast. The value of nonirrigated cropland in the South region was $1,630 per acre and $1,396 in the Northwest.
The value of improved pasture ranged from $2,418 per acre in the Central region to $1,291 per acre in the Northwest. The value of unimproved pasture ranged from $1,735 per acre in the Northeast region to $1,088 per acre in the Northwest. The values of improved and unimproved pastureland in the South region were 62 and 75 percent, respectively, of those in the Central region. The value of both types of pastureland in the Northwest region were 63 percent of those in the Northeast.
Transition Land
Transition land is defined as agricultural land that is being converted, or likely to be converted, to nonagricultural uses as sites for homes, subdivisions and commercial uses. Transition land values were analyzed by metropolitan and non-metropolitan counties for each region. Metropolitan counties are those areas that are classified as Metropolitan Statistical Areas by the U.S. Office of Management and Budget and are considered urban or urbanizing areas. Non-metropolitan counties are the more rural counties where less land is being converted to urban uses. This year, transition land values were again at least three times higher in the Southeast region than in the other regions. In the other regions, the values for transitional land in metropolitan counties were about two times as high as the values for transition land in non-metropolitan counties (Table 3).
The value of transition land within five miles of a major town in the metropolitan counties increased 10 to 12 percent in the northern areas and 14 to 17 percent in the southern regions. The value of transition land within five miles of a major town ranged from $11,000 to $13,120 per acre, except in the Southeast region where transition land values were $40,000 per acre. Transition land values for land more than five miles from a major town in metropolitan counties ranged from $5,635 to $7,904 per acre, except in the Southeast region where transition land values were $26,250 per acre. Transition land values for land within five miles of a major town in non-metropolitan counties ranged from $3,853 to $5,275 per acre, while transition land values for land more than five miles from a major town in non-metropolitan counties ranged from $2,928 to $3,533 per acre.
Cash Rents
The estimated cash rent for nonirrigated cropland was $31.88 per acre in the Northwest region and $25.00 per acre in the Northeast region (Table 2). The estimated cash rent for improved pastureland was $22.60 per acre in the Northwest region, $20.08 per acre in the Northeast region, $19.14 per acre in the Central region, and $18.17 per acre in the South region. Cash rent for unimproved pastureland ranged from $14.60 per acre in the Northwest region to $9.93 per acre in the Central region. The 2001 cash rent estimates indicate that cash rents for improved pasture increased in the Northwest, Northeast, and Central regions. Cash rents in the South region and for other types of land changed by only small amounts.
Cash rent as a percentage of the estimated value of cropland and pastureland continues to be quite low as compared to other areas of the country. These low rates of return have been consistent for several years, indicating that the market value of agricultural land has been "bid up" beyond the income earning capacity from agricultural uses. This reflects the influence of the nonagricultural demand for land on the market value of agricultural and rural land.
Expected Trends
Survey respondents were asked if they expected agricultural land values to be higher, lower, or remain unchanged during the next 12 months. Seventy-one percent of the respondents in the Northwest and Northeast regions expected agricultural land values to increase in their regions, while 43 percent of the respondents in the southern (Central, South, and Southeast) regions expected land values to increase (Table 4). Respondents in the northern regions expected larger land value increases during the next 12 months than respondents in the Central and South regions. Agricultural land values are expected to increase 7.8 percent in the Northwest region and 4.5 percent in the Northeast during the next year. In the southern regions, respondents indicate that they expect agricultural land values to increase 2.2 percent in the Central region and one percent in the South. The Southeast region is expected to see the largest increase (nine percent), primarily due to the impact of urban development in this region.
Use of the Survey Results
The estimates of land values provided in this report are based on the opinions of many people involved in the real estate market. Care must be exercised when making year-to-year comparisons between surveys for several reasons. First, the group of participating respondents changes from year to year. Second, government rules and regulations for water, land use, and the environment may change and affect agricultural land values. Finally, with these changes, the results may not be directly comparable with results from previous years.
Despite limitations, this survey has provided estimates of agricultural land values that have been fairly consistent since the mid-1980s. These estimates serve as a guide to the relative value of different land uses within areas and between areas. It is important, however, to emphasize that the value of a specific tract of land may vary substantially from these estimates because of the physical characteristics of the tract, the location of the tract, and the economic and institutional factors that may affect or restrict its use. Therefore, the value of a specific tract of land should not be determined by these survey results. A professional appraiser should be used to determine the value of a specific tract of land.
References
Reynolds, John E. and Amy Deas. "Florida Agricultural Land Values Increase: 2000 Survey Results" Florida Food and Resource Economics Number 145. Food and Resource Economics Department, University of Florida, Gainesville, FL, July-August 2000. https://edis.ifas.ufl.edu/publication/FE214