UF/IFAS Analytical Services Laboratories (ANSERV Labs): Analytical Procedures and Training Manual
Introduction
The UF/IFAS Analytical Services Laboratories (ANSERV Labs) have been in operation, under slightly different names, for nearly 70 years. Since 2008, the ANSERV Labs have been reorganized to accomplish specific research and UF/IFAS Extension missions through two sections in each area— Analytical Research (ARL) and NELAC Certified Environmental Water Quality Labs (EWQL) for all researchers and students, as well as Extension Soil Testing (ESTL) and Livestock Waste Testing Labs (LWTL) for all citizens and agencies of Florida.
Purpose of This Manual and Intended Audience
The procedures described in this manual reflect the current methodologies for agricultural testing offered by the UF/IFAS Extension Soil Testing Laboratory (ESTL), the Livestock Waste Testing Laboratory (LWTL), the Analytical Research Laboratory (ARL), and the Environmental Water Quality Laboratory (EWQL). This Circular replaces previous information that is contained in other EDIS publications.
The ESTL services are offered as part of the Nutrient Management Extension Program in fulfillment of the public service mandate of the land-grant university mission. Only tests that have been shown through research/experience to assist in crop-management decisions are offered by the ESTL to Florida residents. It is the intention of UF/IFAS Extension to offer only analytical procedures whose results can be interpreted, and thus render assistance with management decisions involving water, plants, soils, and nutrients. The soil test methods and interpretations are effective only when validated through field calibration studies (Mitchell and Mylavarapu 2014). The ESTL will strive to provide the best assistance in locating a UF/IFAS specialist for interpretation and guidance. However, information on new landscape plants and varieties is not always available.
The LWTL offers analytical tests, interpretations, and nutrient recommendations for animal manure and other waste by‐products. Their laboratory services and the educational programs are available to all citizens of Florida and are provided as a fee-based service.
The testing of soil, solutions, and plant tissues is available in the ARL to UF/IFAS researchers for a fee, to assist them in making nutrient management decisions, particularly when establishing field research experiments. Descriptions of each test offered to researchers through the labs are detailed later in this manual and are also available on our website at https://soilslab.ifas.ufl.edu/index.asp.
The EWQL offers UF/IFAS researchers high-quality analytical services for an appropriate selection of standard tests, through adoption of The NELAC Institute (TNI) certification protocols. The EWQL can provide certified testing of non-potable water for analytes cited on the Laboratory Scope of Accreditation, which can be found on our website at https://arl.ifas.ufl.edu/EWQL%20Home.asp.
Extension Soil Testing Laboratory: Mission and Purpose
UF/IFAS Extension Soil Testing Laboratory (ESTL) was established to serve the people of Florida with their soil, plant, water, and waste testing needs for ensuring economically and environmentally sustainable crop production. The ESTL clientele receive accurate agricultural test results, interpretations, and recommendations regarding appropriate rates, use of nutrients, and nutrient management techniques developed for Florida.
ESTL Mission Statement
The mission of the UF/IFAS Extension Soil Testing Laboratory is "to serve the citizens of Florida, by providing appropriately selected soil, plant and water testing, interpretation, and recommendations as an educational service through the Cooperative Extension Service to guide management decisions affecting lime and fertilizer use efficiency."
There are three main categories of soils regarding soil test procedures applied in Florida. Most soils predominantly are acid-mineral soils, which are part of the typical coastal plain physiography of the southeastern United States with sandy textures and low cation exchange capacity (Mylavarapu et al. 2014a). The other two categories are calcareous soils and organic or muck soils. In most of Miami-Dade and Monroe counties and in other localized areas of the state, calcareous soils can be found with >90% free calcium carbonate on the surface. The organic soils are found in the Everglades Agricultural Area spreading over 280,000 hectares south and east of Lake Okeechobee, with >80% organic matter (Mylavarapu et al. 2014a).
The ESTL provides chemical analyses of acid-mineral and calcareous soils, container media, plant tissue nutrients, irrigation and household water samples, and animal manures and waste analyses for all Florida residents. Testing is restricted to samples originating from the state of Florida only. Send muck or organic soil samples to the UF/IFAS soil testing laboratory at the Everglades Research and Education Center in Belle Glade directly. The chemical procedures used and/or the interpretations for organic soils of Florida can be distinctly different.
Also, testing of materials such as drinking water, sewage sludge, hazardous chemical or biological tests of water or soil, or limestone are referred only to other governmental or private laboratories.
Description of ESTL Tests Offered
Commercial Crop Production on Mineral Soils (Agronomic, Vegetable, Ornamental, and Fruit Crops)
The ESTL uses Mehlich-3 extraction procedure for extracting soil samples in preparation for further soil-fertility analyses. The Mehlich-3 extraction solution, (0.2M CH3COOH, 0.25M NH4NO3, 0.015M NH4F, 0.013M HNO3, 0.001M EDTA), is intended for use in extracting phosphates, micronutrients, and exchangeable cations effectively from soils generally with a wider pH range (4.0-7.4) (Zhang et al. 2014; Mylavarapu et al. 2014; Pittman et al. 2005; Mylavarapu 2002). Also, the Mehlich-3 procedure has been the only soil test extraction method validated through interlaboratory studies for extraction of plant-available phosphorus and for use as a reference method in testing soil materials for extractable P (Zhang et al. 2009). For calcareous soils of Florida, the recommended extractant is ammonium bicarbonate-DTPA (AB-DTPA method).
The ESTL offers a Standard Soil Fertility Test for acid-mineral (noncalcareous, inorganic) soils of Florida. The standard test includes analyses for soil pH and macronutrients—phosphorus (P), potassium (K), calcium (Ca), and magnesium (Mg) levels in the soil, as well as extractable micro-nutrients sulfur (S), boron (B), copper (Cu), manganese (Mn), and zinc (Zn). The ESTL does not test for soil nitrogen (N) as there is no reliable soil test for predicting N availability to the plants.
To obtain a buffer pH value for the soil being tested, it is important to select crop codes for each sample submitted. Select up to six crop codes for each soil sample. When selecting a crop code on the analysis request form, a test for Buffer pH may be determined using Adams-Evans Buffer solution (pH 8.00), if the soil pH obtained is lower than the Target pH of the crop code selected.
The Target pH for a crop is the specific soil pH at which a crop achieves optimal crop performance and yield. The laboratory will select crop codes if not selected by the client, and the resulting buffer pH may not be of value to the client. After the buffer pH determination, the amount of lime required to raise the soil to the target pH is calculated using the amount of exchangeable (potential) acidity in the soil. The ESTL does not provide information concerning methods of lowering soil pH on a commercial scale.
Results from the above soil tests are interpreted for crop response based on Table 1. The interpretation values are determined from several long-term, field calibration studies conducted for various crops and soils in Florida, thus forming the basis for nutrient and management recommendations of lime, as detailed on the soil test report sent to the clients.
The ESTL Soil Test Report will recommend specific quantities of macronutrients (N, P, K, Ca, and Mg) for application to the soil of the tested crops in order to increase their nutrient supply levels, promoting optimum yield and/or quality of these crops. Quantities are reported in either pounds per acre, pounds per 100 linear bed feet, pounds per 1000 square feet, or pounds per 100 square feet, depending on the crop (Mylavarapu et al. 2014). The P and K recommendations are both reported as the oxide forms (P2O5 and K2O) to comply with current fertilizer-label requirements. Recommended quantities of N, Ca, and Mg are reported as the elemental form. The report also will indicate the amount of lime that the specific crops’ soil needs, if any, to raise the soil pH to the Target pH level.
The primary value of the micronutrient soil test is to determine if adequate levels of micronutrients already exist in the soil. The interpretation of the soil micronutrient test results and proper micronutrient fertilization is included within the report. Micronutrient fertilizers should be used with discretion since it is possible to build up toxic levels of these elements in a soil. Use of the “shotgun” approach (i.e., addition of micronutrients as “insurance”) should be avoided. Note that pesticide formulations frequently contain one or more of these micronutrients. Therefore, if pesticides are applied, additional application of micronutrient fertilizer is often unnecessary.
Note that recommendations for N are not based on soil testing. The ESTL does not currently test for N in soil due to lack of a meaningful soil test method, which can predict plant-availability of N. The recommendations for N shown on the soil test report form are instead based on research studies that measured the response of the indicated crop to various levels of applied N fertilizers. The results of these studies are then used to determine the correct amount of N needed for optimum crop response. If part of the soil N requirements will be met through nutrient release from organic sources such as crop residue or organic soil amendments, the N fertilizer recommendation should be lowered appropriately by estimating the N availability of the amendment material.
Footnotes, directions, and guidance on micronutrients are all integral parts of the recommendations and the test report. The additional data included in the report elaborate on many aspects of fertilization and cultural management for the specified crop(s). It is strongly recommended that the producers consider the information contained in the footnotes, directions, and guidance sections of the report when making management decisions for efficient fertilizer use.
ESTL Tests Available to the Public
Landscape, Lawn, and Vegetable Garden Test
The UF/IFAS ESTL offers two soil testing options for the homeowner or home gardener. The first soil test option is Test A available for $3 per sample, which provides soil pH and a lime requirement determination. No other nutrient analysis or fertilizer recommendation is provided under this option. The measured soil pH is compared to the Target pH for the crop specified by the homeowner or gardener, and a lime requirement, if any, is determined using the Adams-Evans Buffer pH Index. Both the soil pH and the recommended lime application rate for the specified crop are included in the soil test report.
General fertilizer recommendations for landscape, lawns, and vegetable gardens can then be found in a variety of UF/IFAS Extension publications by visiting http://edis.ifas.ufl.edu or your local UF/IFAS Extension office. Note that general recommendations do not account for nutrients supplied to the plant from sources already within the soil. Instead, all nutrition is assumed to come only from the fertilizer added to the soil.
The second option, Test B, is available for $10 per sample and includes pH tests plus a Standard Soil Fertility Test (pH, lime requirement, Mehlich-3 extractable P, K, Ca, Mg, Cu, Mn, S, B, and Zn). This information is then used to calculate specific lime and fertilizer recommendations for the crop of interest and is included in the soil test report along with the appropriate footnotes. This test allows the homeowner or gardener to develop their fertilization program according to the specific fertilizer needs of the crop they are growing. Recommendations are made for a variety of crops including landscaping plants, ornamentals, vegetable gardens, and lawn grasses (bahia, bermuda, centipede, St. Augustine, etc.) and are reported as either pounds of nutrient per 100 square feet or per 1000 square feet.
Pine Nursery Soil Test
Soil samples from a pine nursery should be obtained from the 0- to 6-inch soil depth only and will be analyzed for the following parameters: pH, lime requirement, Mehlich-3 extractable P, K, Ca, Mg, Cu, Mn, S, B, Zn, and organic matter. The cost of this test is $20 per sample.
Container Media Test
The ESTL Container Media Test is used to measure the levels of water-soluble nutrients in soilless media (e.g., mixtures of materials such as perlite, expanded plastics, vermiculite, peat, pine bark, wood shavings, compost, and sand). Analyses include pH, electrical conductivity, nitrate-N, P, K, Ca, Cu, Mn, Mg, S, B, and Zn. All are measured in a saturated water extract from the soilless media. This test is recommended as a diagnostic tool for fertilizer management in commercial container-plant production as a means of monitoring nutrients in the media throughout the growing season. The test report also provides a fact sheet that assists in the interpretation of the results.
For container media tests, interpretations are meaningful only in commercial nursery situations. Unlike the other soil tests offered by the ESTL, container-media samples should NOT be dried prior to their delivery to the laboratory. Drying these types of media can adversely affect the results of the test by changing the amounts of nutrients extracted from the media. The cost of this test is $10 per sample.
Plant Tissue Test
In addition to soil testing, the ESTL also offers a Plant Tissue Test. Test results from samples submitted by commercial growers are forwarded to a UF/IFAS Extension specialist, where available, who evaluates the data and provides a report to the grower. The Plant Tissue Test includes N, P, K, Ca, Mg, B, Fe, Cu, Mn, S, and Zn. The cost of this test is $10 per sample. Fertilization recommendations are not provided with this report.
Water Test
The ESTL offers testing of both household and other water supplies used for irrigation/micro-irrigation for mineral determinations only. All health-related and drinking water quality inquiries should be directed to the nearest county Health Department. Additionally, questions concerning municipal water supplies should be referred to the Department of Health and Rehabilitative Services, as that agency is responsible for monitoring the quality of municipal water sources.
The ESTL Water Test Report includes values for pH, Ca, Mg, Fe, Mn, Na, Cl, hardness, total carbonates, and electrical conductivity. The cost of this test is $9 per sample. The irrigation water test includes all parameters listed above, as well as a test for suspended solids. The cost of this test is $10 per sample. The report provides tables assisting with the interpretation of results.
In Florida, many irrigation-water sources originate from limestone aquifers, resulting in high-pH waters. Crops that are pH-sensitive, such as blueberries or pine seedlings, may benefit considerably by pretreating such water with acid to destroy carbonates and concurrently lower the pH. Results from the total carbonates test can be used to determine the amount of acid required to reduce this high-pH condition.
Producer Soil Test
The UF/IFAS ESTL offers up to four soil testing options for producers of commercial agronomic, vegetable, fruit, and ornamental landscape crops. Soil samples for this test should be obtained from the 0- to 6-inch soil depth. Samples should be stored at room temperature in sample boxes or containers, under a shade without exposing to extreme heat or cold. The test options include soil pH and lime requirement determination, a Standard Soil Fertility Test (pH, lime requirement, P, K, Ca, Mg, Cu, Mn, S, B, and Zn), organic matter, and electrical conductivity (soluble salts). The cost of these tests per sample is $3, $10, $10, and $2 respectively.
The measured soil pH is compared to the Target pH for the crop specified by the homeowner or gardener and a lime requirement, if any, is determined using the Adams-Evans Buffer pH Index. Both the soil pH and the recommended lime application rate for the specified crop are included in the soil test report. The list of crops that can benefit from this test is provided with respective crop codes on the Producer Soil Test Information Form.
If a crop of interest is not on the list, the ESTL may be contacted to find an Extension crop specialist who can help interpret the test. It is important to denote the exact crop code to ensure appropriate nutrient recommendations. The nutrient recommendations and all additional information included in this report should always be carefully read, understood, and followed for optimum economic and environmental benefits.
Nutrient Testing for Bahia Pastures
The ESTL offers different options for bahia pastures depending on whether it is a new planting or an established pasture on the Nutrient Testing Form for Bahia Pastures. For a new planting, a soil sample is submitted as for the Producer Soil Test. For established pastures, there are two options available to the producer: a soil sample can be submitted either with or without plant tissue. However, to receive a recommendation for phosphorus, the test protocol requires collecting a soil and a plant tissue sample at the same time and submitting them to the ESTL for determining crop phosphorus requirement and making a recommendation for phosphorus application.
Details on this protocol and more can be obtained from EDIS publication #SL129 entitled, “UF/IFAS Standardized Fertilization Recommendations for Agronomic Crops.” The nitrogen option selected on the submission form is chosen based on usage. Refer to #SL129 for the nitrogen options.
The Standard Soil Fertility Test is available on this submission form (pH, lime requirement, P, K, Ca, Mg, Cu, Mn, S, B, and Zn) for a cost of $10. The Standard Soil Fertility Test plus Plant Tissue Test is available for a cost of $20 per sample. Testing for organic matter and electrical conductivity is also available for an additional fee of $10 and $2, respectively.
Producer Citrus Test
The Producer Citrus Test Form available from the UF/IFAS Extension Soil Testing Laboratory is designed to estimate the nutritional needs of Florida citrus grown under commercial conditions.
Analyses available include pH and Lime Requirement for $3 per sample, a Standard Soil Fertility Test (pH, lime requirement, P, K, Ca, Mg, Cu, Mn, S, B, and Zn) for $10 per sample. Organic Matter and electrical conductivity are available for an additional $10 and $2 per sample, respectively. For trees over 4 years of age, a leaf tissue sample must be submitted to receive a recommendation for phosphorus; the cost of this test is $20 per sample. This protocol is detailed in Ask IFAS publication #SL279, “Diagnostic Nutrient Testing for Commercial Citrus in Florida.”
Commercial Sod Test
The test is designed to estimate the nutritional needs of Florida sod grown under commercial conditions. Analyses available include pH and lime requirement for $3 per sample or a Standard Soil Fertility Test (pH, lime requirement, P, K, Ca, Mg, Cu, Mn, S, B, and Zn) for $10 per sample. Also, organic matter and electrical conductivity tests are available for an additional $10 and $2 per sample, respectively.
Phosphorus Index Test
To assess the risk of phosphorus leaving agricultural lands, a tool has been developed called the Phosphorus Index specific to Florida conditions. The pH of the soil is determined, and the SPSC (Soil Phosphorus Saturation Capacity) is estimated from the Mehlich-3 extractable P, Fe, and Al in this test. The cost of this test is $10 per sample.
Livestock Waste Test
Laboratory analysis will include a test for nitrogen (N), ammonia nitrogen (NH3-N), total phosphorus (P) and potassium (K) as well as percent moisture, percent solids, percent ash, and pH. The cost of this test is $35 per sample, and micronutrient analysis is available for an additional $5 per sample.
Based on test results, nutrient recommendations for N, P, and K are provided for selected crops, and up to six crops can be selected from a given list for each sample submitted.
Sample Submission
How to Submit Samples to the ESTL
A Sample Submission Form and full payment for the requested services should accompany the samples. Sample Submission Forms can be printed directly from the ESTL website (https://soilslab.ifas.ufl.edu) or can be picked up from the local county UF/IFAS Extension office. Contact soilslab@ifas.ufl.edu with any questions you may have regarding sample submissions, etc.
Samples may be sent directly to the ESTL via the US Postal Service or express delivery companies. Instructions for collection of a representative sample, proper sample amount, mailing address, and other vital information needed for proper sample processing are printed on the forms (described below).
Do not mail soil sample bags without containing them inside a sturdy box or envelope. Mailing the soil bag alone can result in your sample not arriving at the laboratory, thus incurring additional charges. Mailing boxes for shipping samples to the ESTL are available from the post office or other shipping centers. Samples may also be personally delivered directly to the laboratory to avoid shipping/mailing delays. Follow instructions at the laboratory when you arrive to drop off samples.
Sample analysis generally requires an average of three working days from the time the sample is received at the ESTL. Additional time is required if samples are wet when they arrive at the laboratory or if the plant tissue samples need to be dried prior to processing. If AB-DTPA extraction is required for sample pH above 7.4, results could take up to seven to eight business days to receive from the laboratory.
Analytical results are e-mailed directly to the customer email address provided on the submission form. Additionally, a copy of these results is emailed to the county UF/IFAS Extension office. Clients are encouraged to contact their county Extension office when seeking further assistance understanding results presented within the testing report. Reports can also be printed and mailed to customers if requested.
Sample Submission
Relevant sample submission forms need to be filled out completely and accompany all samples submitted for testing. The following forms correspond to the tests and testing options described above and can be downloaded and printed by the clients from the following links. These and other information can also be accessed by visiting the ESTL website (http://soilslab.ifas.ufl.edu). The forms are also available from the nearest county UF/IFAS Extension office.
- Producer Soil Test Information Sheet (Ask IFAS publication #SL-135). This form has been designed for use by commercial producers. The information sheet is self-explanatory and provides pertinent information for samples submitted to the ESTL. https://soilslab.ifas.ufl.edu/ESTL%20Tests.asp
- Landscape and Vegetable Garden Soil Test Information Form (Ask IFAS publication #SL-136). Both private and commercial clients fertilizing plants in the landscape, primarily home horticulture, should use this form. https://soilslab.ifas.ufl.edu/ESTL%20Tests.asp
- Container Media Test Information Form (Ask IFAS publication #SL-134). This form is designed for use by commercial growers using soilless media for container-plant production. https://soilslab.ifas.ufl.edu/ESTL%20Tests.asp
- Pine Nursery Soil Test Information Sheet (Ask IFAS publication #SL-132). Commercial operators of pine plantations and pine nurseries should use this form. https://soilslab.ifas.ufl.edu/ESTL%20Tests.asp
- Plant Tissue Analysis Information Sheet (Ask IFAS publication #SL-131). This form is used for submission of plant tissue samples. Plant tissue samples should be sent with the consent of an Extension agent or state specialist. The agent or specialist assumes the responsibility for interpretation of the plant tissue report. No interpretation is provided with this report. https://soilslab.ifas.ufl.edu/ESTL%20Tests.asp
- Water Test Information Sheet (Ask IFAS publication #SL-133). This form should be used for analysis of irrigation water or household well water (not municipal or drinking water). https://soilslab.ifas.ufl.edu/ESTL%20Tests.asp
- Nutrient Testing Form for Bahia Pastures (Ask IFAS publication #SL-395). This form is used to submit samples for bahia pastures. For new plantings, send a soil sample using crop code 35. For established pastures, send the soil sample with a plant tissue sample using crop code 36 and test B15. A Plant Tissue Test is necessary before we can give a recommendation for phosphorus fertilization. With no plant tissue, no phosphorus recommendation will be made. Use test 15 in this case. https://soilslab.ifas.ufl.edu/ESTL%20Tests.asp
- Producer Citrus Test Form (Ask IFAS publication #SL-396). This form is used to submit samples from commercial citrus groves. For trees less than four years of age, submit a soil sample using test C15 and the appropriate crop code. For trees older than four years of age, use test C25 and include a sample of the leaf tissue. Leaf tissue is required to get a phosphorus recommendation. https://soilslab.ifas.ufl.edu/ESTL%20Tests.asp
- Phosphorus Index Test Form (Ask IFAS publication #SL-394). This form is used to submit samples for the Phosphorus Capacity Index Test. Send the soil sample and select either the Standard Soil Fertility Test and the Phosphorus Index Test or the Phosphorus Index Test by itself. https://soilslab.ifas.ufl.edu/ESTL%20Tests.asp
- Livestock Waste Test Form (Ask IFAS publication #SL-397). This form is used to submit livestock waste, poultry litter, and other composted samples for nutrient analysis. Customers can choose the Standard Manure Test, and there is an option to include test for micro-nutrients, if desired. https://soilslab.ifas.ufl.edu/LWTL%20Forms.asp
Other supplies related to testing and sampling including soil sample bags are available at your local UF/IFAS Extension office. Do not send soil bags alone through the mail to the lab. Soil bags should be mailed inside a box or rigid envelope available at your local post office or mailing centers.
Sample Preparation Prior to Shipment to Laboratory
Soil Samples
Soil samples should be air-dried before shipment to the ESTL. Drying is best accomplished by spreading a thin layer of soil on clean wrapping paper or newspaper and placing it in a dry shaded area for at least 24 hours. Drying samples in direct sunlight or using a household oven is NOT recommended. Samples received wet will be dried at the laboratory prior to processing. This drying step will increase the time it takes to deliver a report to the client. Wet samples also cost more to ship to the laboratory, so drying samples ahead of shipping will reduce time and costs for the customer. Approximately 2 cups of dried soil are required for testing.
Once received at the lab, soil samples have to undergo a preliminary step of homogenization before chemical analysis to reduce variability in results. Soil test laboratories homogenize soil samples by first drying the soil, if necessary, and then pulverizing the soil to a consistently small particle size. Soil samples are dried by placing them into hot air ovens at 40o C (104o F) or less, if wet. Soils dried in this manner are referred to as air-dried soils. Soil can be transferred to boxes or trays for placement in the oven. Alternatively, the entire bag or box containing the sample can be placed in the oven with the top left open to allow moisture release (Mylavarapu and Miller 2014).
Container Media Samples
Container media samples should not be dried before shipment to the ESTL. Drying media samples will adversely affect the test results decreasing the usefulness of the test. Approximately 1 quart of container media is required for testing.
Plant Tissue Samples
The quality of the tissue samples submitted for analysis is of importance in ensuring proper processing and interpretation of the results. Tissue samples should not be contaminated with soil or sprays. If the tissue is dusty or contaminated, the sample should be gently washed with flowing distilled water and allowed to dry overnight prior to shipping. Approximately 25 grams of dried material is required for testing. Do not sample diseased or damaged plant materials. Consult your local UF/IFAS Extension agent to determine the proper plant part and the proper time to sample. Always place plant tissue samples in paper bags only, to prevent mold growth during shipment.
Water Samples
The container in which a water sample is sent to the ESTL can influence results greatly. For example, residual soap from a plastic dish soap container will contaminate the water sample. The sample container should be cleaned and rinsed to avoid contamination of the sample.
The sample should be taken several minutes after the water source has been flowing from the spigot or irrigation pump. The container should be flushed thoroughly several times with the flowing water. The container should be filled completely with no airspace at the container top. Entrapped air in the container may affect well-water samples due to shifts in carbon dioxide, potentially affecting its pH. Approximately 16 ounces of water is required for testing.
An old plastic drinking water bottle or other similar container can be used for sample collection and delivery to the lab. Glass containers should not be used due to the risk of breakage during shipment.
Analytical Procedures for Soil in the Laboratory
ESTL Soil Scooping Technique
Soil scooping technique is employed to draw an estimated weight of soil sample for testing from the soil sample submitted/prepared. The soil-scooping technique requires practice, despite its unsophisticated appearance. The technique depends upon uniform actions by the technician from sample to sample to produce consistent packing of soil into the scoop. To check scooping consistency, repeatedly scoop soil from one sample and check the weight of each scoop. If the procedure is being carried out properly, the weights should be uniform. Scoop weights will vary from soil to soil depending on differences in soil texture (Table 2).
ESTL Soil Scooping Procedure
- Dip the scoop into the center of the soil sample and fill the scoop with a twisting motion so that extra soil is mounded above the rim of the scoop. Do not press the scoop or force the soil against the side of the container.
- Strike the handle near the scoop two times with a plastic rod to settle soil particles.
- Level the scoop with the plastic rod. Strike off all excess soil above the rim of the scoop in a single stroke so that the soil is not compacted into the scoop.
Analytical Procedure to Obtain Soil pH (1:2 v/v)
This ESTL procedure uses a 20 cm3 soil scoop and 40 mL of pure water to obtain a 1:2 soil-to-water ratio. Samples must soak in the DI (de-ionized) water solution for 30 minutes prior to measuring solution pH. Sample pH may be affected by contaminated water, by microbial activity, or by changes in solution chemistry if samples sit longer than 2 hours prior to analysis. Other common errors associated with this method include improper scooping technique and improper electrode use.
The pH meter should be calibrated daily using commercially available buffer solutions. Fresh aliquots of buffer solution must be used each day. A method blank and laboratory control sample shall be analyzed for each pH probe used to collect sample data. The frequency of analysis is at a minimum once per day, preferably once per analytical set. The pH buffer solutions shall be read at the end of the analysis run. The pH range of the buffer solutions should cover the range of measurements collected.
Standard Solutions
Obtain commercially available standard buffer solutions of pH 4.00, 7.00, and 10.00.
Procedure
- Standardize pH meter according to manufacturer’s directions.
- Scoop 20 cm3 of soil and pour into a 90-mL (3-oz) plastic cup.
- Add 40 mL of pure water to each cup using an automatic pump or dispenser. Stir each sample with a rod and let the sample stand for 30 min but not more than 2 hours. Stir samples again just prior to analysis.
- Collect and record pH data to the nearest 0.01 pH unit using the LabFit software.
- Upload data file into WebLIMS.
Adams-Evans Buffer pH
This procedure (Adams and Evans 1962) uses a 15-cm3 soil scoop and 30 mL of Adams-Evans Buffer solution for a soil to solution ratio of 1:2. Errors associated with this method include improper standardization of the Adams-Evans Buffer solution, improper use of the electrode, and delays in analysis beyond the recommended equilibration period.
Reagents
Reagents used in this procedure are p-Nitrophenol, boric acid, and potassium hydroxide. Since it is a toxic chemical, p-Nitrophenol must be disposed of according to UF Division of Environmental Health and Safety (EH&S) guidelines for disposal.
Solutions
The Adams-Evans Buffer solution is prepared as follows:
- Weigh 180 g of the p-Nitrophenol into a 6-L Erlenmeyer flask containing about 4 L of pure water. Add 135 g of the boric acid and dissolve. Use low heat to dissolve, if necessary.
- Dissolve 95 g of the potassium hydroxide in approximately 200 mL of pure water contained in a 500-mL beaker.
- Using a 20-L carboy calibrated at 18-L volume, add 6 L of pure water. Weigh 666 g of the potassium chloride and transfer to the carboy.
- Combine all solutions by quantitatively transferring the p-Nitrophenol/boric acid solution, followed by the potassium hydroxide solution, to the carboy containing the potassium chloride solution. Bring to 18-L final volume with pure water.
- Adjust the solution pH to 8.00 ± 0.02 with small amounts of potassium hydroxide (for raising pH) or hydrochloric acid (for lowering pH), as needed. Let stand overnight and check pH prior to first use.
- Alternately, a commercially prepared Adams-Evans Buffer solution can be purchased. Purchased solution should be diluted prior to use with samples. Dilution ratio is 1:1(v/v).
Procedure
- Standardize the pH meter according to the manufacturer’s directions.
- Measure the pH of the Adams-Evans Buffer Solution to ensure that the solution reads 8.00 ± 0.02. The blank should read between 7.98 and 8.02 pH units.
- Scoop a 15-cm3 volume of soil into a plastic cup.
- Add 30 mL of the buffer solution using an automatic pipette or dispenser.
- Stir samples for 4 min on a mechanical stirrer. The timing of this test is critical. The reaction starts when the buffer solution is added to the sample.
- Immediately after stirring, load samples onto LabFit pH machine and measure the solution pH.
- Collect and record pH data to the nearest 0.01 pH unit using the LabFit software.
- Upload data file into WebLIMS.
Mehlich-3 Extractable P, K, Ca, Mg, B, S, Cu, Mn, and Zn
This procedure uses a 2.5-cm3 scoop (approximately 2.5 g of mineral soil) and 25 mL of the Mehlich-3 extraction solution to provide a soil to solution ratio of 1:10. Once the extraction is complete, the sample is filtered through Whatman No. 42 filter paper or its equivalent. The filtered solution should be analyzed as soon as possible following the extraction procedure. Common errors associated with this method include mistakes in sample shake time, delayed filtration, and contamination of reagent, filter paper, or cup.
Reagents
Reagents used in this procedure are acetic acid, ammonium nitrate, ammonium fluoride, nitric acid, and EDTA.
Solutions
Mehlich-3 Extracting Solution
Prepare a stock solution of 3.75M NH4F – 0.25-M EDTA by dissolving 138.9 g of ammonium fluoride and 73.05 g EDTA in 1 L of DI (de-ionized) water.
To prepare the Working Extractant, pour approximately 15 L of DI water into a 20-L plastic carboy. Add 400 g of ammonium nitrate and stir to dissolve. Add 80 mL of the stock solution prepared above and mix. Add 230 mL of acetic acid and 16.4 mL of concentrated nitric acid, bring to a final volume of 20 L with DI water, and mix well. The pH of this solution should fall between 2.4 and 2.6 before use as an extraction solution.
Procedure
- Scoop 2.5 cm3 of mineral soil and transfer into a 50-mL extracting bottle.
- Dispense 25 mL of Mehlich-3 extracting solution into each extracting bottle using an automatic dispenser.
- Shake each sample for 5 min on a reciprocating shaker set to approximately 180 shakes per minute and then filter solution through filter paper (11-cm Whatman No. 42 or equivalent) into a plastic cup.
- Transfer the filtrate to an appropriate vial for analysis. If samples are not to be analyzed immediately, they should be capped or otherwise covered. Sample solutions are stable for 5 days.
- The filtrate is analyzed for nutrients using an ICP-OES (Inductively Coupled Plasma using Optical Emission Spectroscopy, EPA Method 200.7).
- ICP Data for Mehlich-3 extracts is acquired with a 10X dilution factor set in the instrument software.
- Instrument readings are in parts per million (ppm) and thus the results are recorded in milligrams per kilogram after conversion in WebLIMS.
Procedure for Determining Soil Organic Matter (SOM)
Walkley-Black Method
The Walkley-Black (WB) method used for determining Soil Organic Matter (SOM) involves a known volume of acidic dichromate solution reacting with an aliquot of soil to oxidize the SOM (Allison 1965; Mylavarapu 2014b). The oxidation step is then followed by titration of the excess dichromate solution with ferrous sulfate. The SOM is calculated using the difference between the total volume of dichromate added and the volume titrated after reaction.
Problems associated with this procedure include excessive organic matter in the soil. The limit for this procedure is approximately 6% organic matter. Higher levels of organic matter can make the end-point determination difficult. The use of a lighted stir plate can be of assistance in the end-point determination. The procedure uses potassium dichromate, which is categorized as a hazardous chemical. Waste generated by this procedure is hazardous and must be disposed of according to UF EH&S guidelines.
Reagents
Reagents used in this procedure are potassium dichromate, ferrous sulfate, sulfuric acid, and ferroin indicator.
Solutions
0.16M Potassium Dichromate
Dissolve 98.08 g of oven-dry/desiccated potassium dichromate in approximately 1500 mL of pure water and dilute to 2 L. After preparation of this solution, transfer to a clean glass bottle for use with a repipetter. Do not mix old potassium dichromate solution with the new solution.
0.5M Ferrous Sulfate
Dissolve 278.02 g of ferrous sulfate in approximately 1500 mL of pure water. Carefully add 30 mL of concentrated sulfuric acid, mix, cool, and dilute to 2 L. After preparation, transfer this solution to a clean 8-L plastic carboy. Do not mix old ferrous sulfate solution with the new solution. The tubing, stopcock, and attachments to the burette should be rinsed three times with new ferrous sulfate solution before titrating any blanks or samples. Prepare a new solution every 30 days.
Procedure
- Weigh 1.0 g of mineral soil into a 250-mL-wide mouth graduated Erlenmeyer flask.
- Titrate two blank samples (no soil) before proceeding with any unknown samples to standardize the ferrous sulfate solution.
- If the difference between the two blanks is not within 0.2 mL of ferrous sulfate solution, clean the burette and associated tubing.
- Reanalyze two more blanks to determine if the problem has been eliminated.
- Pipet 10.0 mL of the potassium dichromate solution into each flask containing unknown soil and mix by carefully rotating the flask to wet all the soil.
- Under a fume hood, carefully add 20 mL of concentrated sulfuric acid to each flask and mix gently.
- Allow flasks to stand for 5 min under the fume hood.
- Add pure water to each flask such that the final volume is approximately 125 mL. Mix by swirling gently and allow sample to cool to room temperature before proceeding to next step.
- Add 5 or 6 drops of phenanthroline complex and immediately titrate with the ferrous sulfate solution.
- As the titration proceeds, the solution will take on a green color and then finally a turquoise that will change abruptly to reddish brown when the endpoint of the titration is reached.
- Record each volumetric reading to the nearest X.X mL.
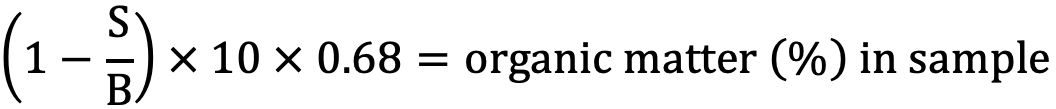
- The % OM is calculated as follows:
Credit:
Where:
S = Volume of ferrous sulfate solution required to titrate the sample, in mL.
B = Average Volume of ferrous sulfate solution required to titrate the two blanks, in mL.
10 = Conversion factor for units.
0.68 = A factor derived from the conversion of % organic carbon to % organic matter (1.724), the fraction of organic carbon oxidized to CO2 (0.76) and the milliequivalent weight of carbon (0.003 g).
Loss-on-Ignition Procedure
The Loss-on-Ignition (LOI) organic matter determination is used for analyzing soil samples in which the organic matter content is greater than 6%. This procedure involves exposing the soil sample to high temperatures in an oxygen atmosphere to convert any organic carbon compounds to carbon dioxide, which is then lost to the atmosphere. The difference between the soil dry weight and the weight of the sample after ignition is then used to calculate the amount of organic matter in the sample. This procedure has been reported to be consistent with even lower SOM levels (<6%) such as sandy soils in Florida. Studies are ongoing to determine the suitability and for possible replacement method for WB procedure.
Procedure
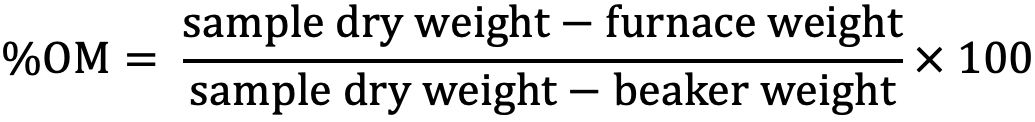
- Label an oven dried 50 mL Pyrex beaker and weigh. This weight is the beaker weight.
- Add approximately 10–12 g of soil to the beaker. Place sample in the oven at a constant temperature of 105°C and allow sample to dry for a minimum of 2 hrs.
- Remove sample from the oven at the end of 2 hours and immediately place it into a desiccator to cool. Allow sample to cool to room temperature (approximately 30 minutes) and then accurately weigh sample and beaker. This weight is the sample dry weight.
- After weighing, place sample into a muffle furnace and heat at 450°C for 6 hours. Do not exceed this temperature as CaCO3 may be converted to CO2 and cause erroneous results.
- At the end of the heating period, allow samples to cool slightly and then transfer immediately to a desiccator. Allow samples to cool to room temperature in the desiccator. If this is not possible, leave samples in muffle furnace overnight.
- After samples reach room temperature, remove from the desiccator or cooled muffle furnace and accurately weigh sample and beaker. This weight is the furnace weight.
- The % OM is calculated as follows:
Credit:
Electrical Conductivity (1:2 Soil: Water)
The ESTL offers a test for soil Electrical Conductivity (EC). In this test, 20 cm3 of a mineral soil are mixed with 40 mL of pure water resulting in a soil to water ratio of 1:2. The resultant suspension is allowed to equilibrate for 4 hours in order to allow slowly-soluble constituents to approach solution equilibrium. The electrical conductivity of the suspension is immediately determined. Sources of error include improper instrument calibration and incorrect equilibration times.
Standards
A solution of 0.005M KCl has an electrical conductivity of 720 decisiemens per meter (dS/m) at 25°C. Alternately, a commercially available NIST traceable reference solution of the appropriate concentration and conductivity may be used.
Procedure
- Weigh 20 g of soil and transfer to a plastic 90-mL (3-oz.) cup.
- Add 40 mL of pure water to each cup. Stir and allow the suspension to stand for 4 hours.
- At the end of 4 hours, stir the suspension to create slurry.
- Using the reference standard, calibrate the Electrical Conductivity Meter according to manufacturer’s directions. Measure the EC of the solution and report results to two significant figures in dS/m.
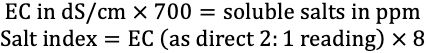
While the ESTL reports all electrical conductivity measurements in dS/m, many clients are accustomed to values given in ppm “soluble salts.” The calculation to convert EC to soluble salts is given below along with the formula for conversion of EC to salt index. There are many inaccurate assumptions included in these conversions, and clients are encouraged to adapt to the more precise and widely accepted terminology of EC in dS/m.
Credit: undefined
Combustion Procedure for Total Nitrogen and Total Carbon
- Weigh 0.2 g of oven-dry soil into a ceramic or stainless-steel crucible
- Duplicate every 20th sample to measure the precision of the test.
- Analyze at least one external or internal soil standard sample with each analytical run.
2. Place samples onto carousel.
3. Set up analysis run as indicated by Elementar procedures. Perform leak test and assure enough reagents to run the number of samples desired.
4. Prior to sample analysis make certain that the instrument is measuring TN and TC values appropriately.
5. Report values obtained into WebLIMS as %Nitrogen and %Carbon.
Analytical Procedures for Container Media
Water-Extractable P, K, Ca, Mg, B, Cu, S, Mn, Zn, NO3-N, pH and Electrical Conductivity
The entire sample (or that portion of the sample that nearly fills a 600-mL plastic beaker) is used for this diagnostic test. DI (de-ionized) water is added to the sample to the point of saturation. The sample is then filtered under vacuum, and the filtrate is analyzed. Under- or over-estimating the point of sample saturation will introduce some error.
If possible, the analysis of the filtrate should be completed on the same day that the extract is prepared. The sample analysis must be completed within 48 hours of preparation, or the sample must be re-extracted.
Container Media Extraction Procedure
- Place the entire sample (or a representative sample aliquot) into a 600-mL plastic beaker and conservatively add pure water to the point of complete saturation. At this point, the surface of the mix should glisten, but no water should puddle on the surface. Mix well with a spatula and let stand for 2 hours.
- Place a 9-cm, Whatman No.1 filter paper into a large Buchner funnel. Wet the filter paper with approximately 2 mL of pure water and transfer the saturated media onto the filter.
- Place the funnel under a vacuum and leave until enough solution is extracted from media to complete the necessary tests. Transfer the filtrate to an appropriate container for analysis.
pH
Standardize the pH meter according to manufacturer’s directions and then determine the pH of an aliquot of the filtrate. Results are reported to one decimal place.
EC
Standardize the EC meter according to manufacturer's directions and then determine the electrical conductivity of an aliquot of the filtrate. Report results to two significant figures in dS/m.
Water-Extractable NO3-N
The ESTL uses semi-automated colorimetric analysis (EPA Method 353.2) to determine NO3-N in the media extract. The instrument (Xylem FS3700 or equivalent) is set up and calibrated as per manufacturer’s directions. Instrument results are reported to one decimal place as mg L-1 NO3-N.
Water-Extractable P, K, Ca, Mg, B, S, Cu, Mn, Zn
- The filtrate may be analyzed for all other nutrients using ICP-OES.
- ICP data is collected at a 1X dilution factor for container media samples.
- Results for water extractable nutrients are reported in mg L-1 (ppm).
Analytical Procedures for Calcareous Soils
Ammonium Bicarbonate-DTPA (AB-DTPA) Extractable P, K, Mg, Cu, Mn, Zn
The AB-DTPA extractant works well on soils with high and neutral pH (Soltanpour 1991). It is being calibrated for the marl and Rockdale soils of southern Florida. Previous studies in Florida have shown that this procedure can be interpreted only for P test results. Results for other nutrients are included in the report, but only phosphorus recommendations are provided. This extraction procedure is used only on calcareous soils having a pH of 7.4 and above.
Reagents
Reagents used in this procedure are ammonium hydroxide, ammonium bicarbonate, hydrochloric acid, diethylenetriaminepentaacetic acid (DPTA), and hydrochloric acid.
(1.0 M AB - 0.005M DTPA) Extracting Solution
Prepare this solution under a fume hood to avoid possible contact with vapors. Add approximately 700 mL of pure water into a 2-L beaker. Add 0.5 mL (10 drops) of concentrated ammonium hydroxide. Dissolve 1.97 g of DTPA in this solution. If DTPA is slow to dissolve, add more NH4OH to the beaker. After the DTPA has been dissolved, add 79.06 g of ammonium bicarbonate, mix, and dilute to 1-L final volume. Adjust to pH 7.6 using concentrated hydrochloric acid (for lowering pH) or ammonium hydroxide (for raising pH). Prepare this solution daily, as it is pH unstable. A large beaker is most useful for making this solution. Once solution is dissolved and close to 1-L final volume, transfer to a volumetric flask for volume determination.
AB-DTPA procedure
- Prepare solution as described above.
- Using list from WebLIMS, prepare Extension samples with a pH greater than or equal to 7.4 by the following procedure.
- Using a 15-cm3 scoop, scoop an aliquot of soil into the plastic extraction containers suitable for the extraction.
- Add 30 mL of AB-DTPA extraction fluid to each 15-cc scoop of sample.
- Shake samples on reciprocating shaker at approximately 180 rpm for 15 minutes.
- Filter samples into 3-ounce cup or equivalent container.
- Add 0.5–1.0 mL of conc. HNO3 to each sample to acidify the extract.
- Transfer an aliquot from each sample to an appropriate container for analysis.
Analytical Procedures for Water
The following procedure lists the various subsections that deal with water analyses (SRIEG 1983). To preclude errors introduced by microbial activity, water samples should be analyzed as soon as possible after sampling. Sample containers should be filled completely with no headspace above the sample surface and should only be opened immediately prior to analysis, since exposure to air can cause changes in the chemical equilibrium of the sample.
pH
Standardize the pH meter according to manufacturer’s directions and then determine the pH of an aliquot of the sample. Results are reported to one decimal place.
EC
Standardize the EC meter according to manufacturer’s directions and then determine the electrical conductivity of an aliquot of the sample. Report results to two significant figures in dS/m.
Metals
Ca, Mg, Fe, Mn, and Na are analyzed by ICP-OES. ICP Data is acquired at a 1X dilution for water samples. Pour an aliquot of sample and analyze as received.
Chloride Test
The ESTL uses semi-automated colorimetric analysis (EPA Method 325.2) to determine chloride in waters. The instrument (SEAL Analytical AQ2+) is set up and calibrated as per manufacturer’s directions. Instrument results are reported to one decimal place as mg L-1 of chloride concentration.
Carbonate Equivalent Titration
A 50-mL aliquot of water sample is titrated against a standardized hydrochloric acid solution to a pH of 4.0. The volume of acid required is then used to calculate the carbonate and bicarbonate equivalence of the sample. While very low levels of bicarbonates may be present in solution below pH 7.0, these levels are assumed to pose no problems agriculturally. The volume of acid required to titrate the sample to the desired pH is assumed to be entirely due to the neutralization of carbonates and bicarbonates. The most common error associated with this method is degradation of the THAM buffer solution. The THAM titrant should be replaced at least once every week. Changes in carbonate and bicarbonate levels in samples can occur upon exposure to the air.
Reagents
Reagents used in this procedure are THAM solution (tromethamine solution) and concentrated hydrochloric acid.
THAM 0.020M Titrant
Place approximately 1.0 g of THAM into a glass beaker and cover the beaker with a watch glass. Dry at 75oC for 15 to 20 min and cool to room temperature in a desiccator. Accurately weigh 0.4846 g THAM and transfer it to a 200-mL volumetric flask. Dissolve the THAM by swirling and bring to volume with pure water.
Standardized Hydrochloric Acid
Using a pipette, measure 5.0 mL of concentrated hydrochloric acid and quantitatively transfer it to a 10-L carboy calibrated at 7-L. Bring the container to a 7-L volume with pure water. This solution should be standardized before use.
Acid Standardization procedure
Pipette 25.0 mL of the hydrochloric acid prepared above into a 100-mL beaker or Erlenmeyer flask. Titrate to pH 7.00 with the 0.020M THAM titrant solution. Repeat this procedure to obtain two readings. The difference between the two readings should be no more than 0.3 mL. Use the average of the two readings to calculate the molarity of the hydrochloric acid (HCl) according to the following equation:

Where: M HCl = the calculated Molarity (equivalent to normality for hydrochloric acid)
0.020 M THAM = the Molarity of 0.4846 g of THAM
mL of THAM = the quantity of THAM needed to reach a final pH of 7.0
mL of HCl = the original volume of hydrochloric acid used in the titration process
Record the calculated molarity to the nearest 0.001 and label the carboy accordingly. If properly prepared and standardized, the molarity of the acid should be within the range of 0.005 to 0.015 M. This solution should be standardized every month.
Carbonate Titration Procedure
- Calibrate the pH meter according to manufacturer’s instructions.
- Pipette 50.0 mL of the water sample into a 100-mL beaker.
- Read the pH of the sample.
- If the pH is greater than 7.0, proceed with the titration of the sample.
- Titrate to pH = 4.00 +/- 0.05 with the standardized hydrochloric acid solution. The sample should be stirred during the titration process.
- Record the volume of hydrochloric acid solution used to titrate the sample, to the nearest 0.1 mL. The concentration of total carbonate and bicarbonate, in mg L-1 in the sample is calculated as follows:

Where:
M HCl = molarity or the hydrochloric acid titrant
mL of HCl = amount required to titrate the sample
1000 = conversion factor for units
50.0 mL = volume of unknown (water sample)
Suspended Solids
A 50-mL aliquot of water sample is filtered using pre-weighed filter paper. The filter paper is dried at 103°C–105°C centigrade and weighed to give a measured amount of solids collected in the filtered sample. The reference method utilized in this procedure is EPA 160.2.
Supplies
- Environmental Express Item No. F93447MM-X - DoubleWeigh Filters for TSS, 47mm, 100pk, or equivalent
- Environmental Express Item No. NSIQCI-055 - Ready-to-use Solids Standard, 4 x 1-L Bottles, or equivalent
Suspended Solids Procedure
- Set up filtration manifold, with filters in place and sample tins labeled.
- Filter 50 mL of DI (de-ionized) water for a method blank.
- Filter 50 mL of Solids Standard as laboratory control standard (LCS).
- Filter 50 mL of sample.
- Collect and dry filters until dry, at least 1 hour typically. Samples can be left overnight.
- After filter papers are dry, remove from oven, and allow to cool.
- Weigh filters and record weights in logbook.
- Calculate amount of suspended solids in solution through the following equation:

Report values in WebLIMS.
Analytical Procedures for Plants
ICP Metals Procedures for the Determination of Ca, Mg, P, K, Na, Mn, Cu, Fe, Zn, and B in Plant Tissue
This digestion procedure has been developed with a sufficiently large dilution factor to allow accurate determination of macronutrients and secondary nutrients that are often in relatively high concentrations within the plant. This procedure may not be suitable for certain micronutrient or heavy metal analyses because of the selected dilution factor. If the expected micronutrient concentration in the plant is less than 5 mg kg-1, the element may be diluted below the detection limit of the method. Selection of muffle furnace temperature and its control directly affect the analytical results of this process. The use of borosilicate glassware can be a source of B and Si contamination. Recovery of iron in plant tissues prepared by this procedure is known to be lower than certified levels in plant tissue NIST standards.
Reagents
Reagents used in this procedure are hydrochloric acid and sulfuric acid.
Solutions
6.0 M Hydrochloric Acid
Add approximately 0.9-L of pure water into a 2-L acid bottle with a dispenser at the top. Under a fume hood, slowly add 1000-mL hydrochloric acid, and mix using a magnetic bar with stirrer. Adjust final volume to 2-L. Alternatively, any container to which equal volumes of pure water and concentrated hydrochloric acid have been added is sufficient.
0.5 M Hydrochloric Acid
Add approximately 1.5 L of pure water into a 2-L acid bottle with a dispenser at the top. Under a fume hood, slowly add 83-mL hydrochloric acid, and mix using a magnetic stir bar with stirrer. Alternatively, any container to which equal volumes of pure water and concentrated hydrochloric acid have been added will suffice.
5% Nitric Acid - 2% Hydrochloric Acid Solution
Add 50 mL HNO3 and 20 mL HCl to each 1 L of deionized water and mix well. Adjust amounts as needed.
Dry Ash Plant Tissue Preparation Procedure
- Weigh 0.2 g of oven-dry, ground plant tissue into a 50-mL glass beaker and place in a muffle furnace.
- Duplicate every 20th sample to measure the precision of the test.
- Digest at least one external or internal plant tissue standard sample with each digestion.
2. Place samples in muffle furnace. Ensure temperature controls are set to 500°C and turn on the furnace.
3. Once the internal temperature of the oven reaches 500°C, allow samples to ash for a minimum of 5 hours (ashing time should never exceed 16 hours). Shut off oven and allow oven to cool.
4. Once the furnace temperature is below 200°C, carefully open the furnace door to expedite the cooling process. CAUTION: The internal temperature of the muffle furnace should be below 200°C before opening the furnace door so that the samples are not ignited or disturbed by the rapid influx of air.
5. Once samples reach room temperature, remove them from the oven and moisten the ash by adding approximately 5 drops of pure water using an eyedropper followed by the addition of 20 mL of 0.5 M hydrochloric acid. Let this suspension stand for at least 30 minutes before proceeding.
6. Transfer an aliquot of the sample to an appropriate container for analysis. If filtration is required, use a (Whatman No. 42 or equivalent) filter paper.
7. The sample solution is analyzed ICP to determine the concentration of nutrients in the plant tissue.
8. Sample results are reported in mg kg-1 plant dry weight for B, Cu, Fe, Mn, and Zn and in percent plant dry weight for P, K, Ca, and Mg.
Combustion Procedure for Total Nitrogen and Total Carbon
- Weigh 0.2 g of oven-dry, ground plant tissue into a ceramic or stainless-steel crucible.
- Duplicate every 20th sample to measure the precision of the test.
- Analyze at least one external or internal plant tissue standard sample with each analytical run.
2. Place samples onto carousel.
3. Set up analysis run as indicated by Elementar procedures. Perform leak test and assure enough reagents to run number of samples desired.
4. Prior to sample analysis make certain that the instrument is measuring TN and TC values appropriately.
5. Report values obtained into WebLIMS as %Nitrogen and %Carbon.
Total Kjeldahl Nitrogen (TKN) in Plant Tissue
The TKN method is used to analyze for nitrogen in organic materials. Most organically-bound nitrogen (such as in amines, proteins, etc.) as well as any nitrogen in the form of ammonium ion can be determined using this method. In general, nitrates, nitrites, and some cyclic nitrogenous compounds resistant to digestion are not determined using this method. The Kjeldahl digestion process produces a highly acidic solution and is therefore not recommended for nitrate analysis, as it will cause damage to the instrument.
Reagents
Reagents used in this procedure are TKN mixture (commercially available) and sulfuric acid.
TKN Digestion Procedure for Plant Samples
- Weigh 0.20 grams of plant tissue onto a nitrogen-free weighing paper. Carefully fold the paper containing the sample and place into a TKN digestion tube (25 mm x 300 mm 100 mL volumetric tube).
- Duplicate every 20th sample to measure the precision of the test.
- Digest at least one external or internal plant tissue standard sample with each digestion.
2. Scoop approximately 2.0 g of Kjeldahl digestion mixture (this mixture may be obtained from Alfie-Packers, Omaha, NE 68127) and transfer to the bottom of the digestion tube with the aid of a long stem funnel.
3. Carefully add 5 mL of concentrated sulfuric acid to each tube.
4. Start the digestion by placing samples in a block digester. Set temperature to 250°C. When block reaches 250°C, let samples digest for 1 hour. Increase temperature to 380°C and continue digesting for 2.5 hours.
5. After digestion is complete, allow block to cool to 80°C. When tubes are cool enough to handle, remove from the digestion block and place into a wire rack to cool to room temperature.
6. Using a wash bottle, add 5 to 10 mL of pure water, washing the sides of each tube. Mix using a vortex mixer.
7. Bring to 100 mL volume with pure water, cap with rubber stopper, and mix well.
8. Filter using (Whatman No. 2 or equivalent) filter paper. Transfer an aliquot of the sample to an appropriate container for analysis.
9. The ESTL uses semi-automated colorimetric analysis (EPA Method 351.2) to determine nitrogen in TKN digestates. The instrument (FS 3700, or equivalent) is set up and calibrated as per manufacturer's directions. Instrument calibration standards and quality control samples should be digested in the same manner as the samples. Instrument results are reported to one decimal in mg L-1. Final results are reported as %N-plant dry weight and are converted from mg L-1 using the following equation:
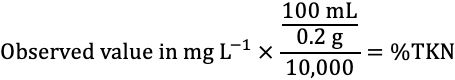
Credit: undefined
Livestock Waste Testing Laboratory: Mission and Purpose
The LWTL offers analytical tests, interpretations, and nutrient recommendations for animal manure and other waste by‐products. The laboratory services and the educational programs are available to all citizens of Florida and are provided as a fee-based service. These services are offered as a part of the Nutrient Management program in the Department of Soil, Water, and Ecosystem Sciences.
LWTL Mission Statement
The mission of the UF/IFAS Livestock Waste Testing Laboratory is "...to test livestock and other wastes, interpret and make science-based recommendations for properly managing the resource while maintaining soil quality for sustainable Florida agriculture and environment."
Analytical Procedures for Livestock Waste
Determination of P and K in Livestock Waste
Phosphorus and potassium are determined in livestock waste samples using the procedure in Chapter 5, Section 5.4 on page 35 of Peters’ Recommended Methods of Manure Analysis (2003). Calcium, magnesium, and the micro-nutrients—copper, manganese, and zinc—can also be determined using this digestion. The digested samples are analyzed using Inductively Coupled Plasma Spectrometry (EPA 200.7).
pH
The determination of pH in livestock waste is done using the procedure in Chapter 7 of Peters (2003).
Ammonia
Manure samples are prepared for ammonia analysis using the procedure in Chapter 4, Section 4.3 of Peters (2003). Liquid manure and KCl extracts of the solid manure samples are analyzed using EPA method 350.1.
Total Kjeldahl Nitrogen (TKN) in Livestock Waste
Livestock waste samples for Total Kjeldahl Nitrogen are digested by following the procedure in Chapter 3, Section 3.2.6 of Peters (2003), “Micro Kjeldahl Analysis,” using a block digester. The colorimetric determination is performed using EPA method 351.2.
Percent Moisture, Percent Solids
The determination of Percent Solids and Percent Moisture is performed using the procedure in Chapter 2 of Peters (2003).
Percent Ash
For the Percent Ash determination, the dry sample from the Percent Solids determination is heated at 500°C for 4 hours in a muffle furnace. The sample is cooled in a desiccator for 4 hours or until the sample is at room temperature and then weighed.
Procedure
- Take sample from Percent Solids determination and place in a muffle furnace.
- Set muffle furnace temperature to 500°C and turn on the furnace. Once the temperature reaches 500°C, allow the samples to ash for 4 hours. Shut off furnace and allow the furnace to cool.
- When the temperature is below 200°C, open the furnace and transfer samples to a desiccator. Allow samples to cool to room temperature.
- When the samples are at room temperature, accurately weigh them on an analytical balance.
- The Percent Ash is determined using the following equation:

Analytical Research Laboratory: Mission and Purpose
The ARL offers high-quality analytical services to all the UF/IFAS researchers statewide. Researchers are requested to contact the Lab for information on the available selection of tests and regarding their analytical needs. In specific instances, the Lab can offer some specialized need-based tests.
ARL Mission Statement
The mission of the UF/IFAS Analytical Research Laboratory is "to offer researchers high quality analytical services for an appropriate selection of standard tests in a timely manner, following standard procedures and quality assurance protocols."
Analytical Procedure for ARL
Procedures used in the ARL for soil analysis are very similar to ESTL procedures. The primary difference between the two laboratories’ approaches is that the ESTL scoops soil samples for analysis and the ARL weighs samples for analysis. The ARL also offers testing on solutions and plant tissue samples. Additional quality controls may be requested by researchers and reported with samples. Additional fees are charged for samples requiring dilution and/or reanalysis.
Description of ARL Tests Offered
Soil Testing
The ARL offers testing for nitrate + nitrite (NO3-N), ammonia (NH4-N), TKN, total phosphorus, ortho-phosphate, conductivity, pH, total N, total C, and extractable ICP metals in soil samples. ICP metals currently available for analysis by the ARL are P, K, Ca, Mg, Zn, Mn, Cu, Cr, Al, Na, Fe, B, Cd, Mo, Ni, Pb, Si, S, As, and Se. Many of these elements are not available through the Extension laboratory. Soil samples submitted to ARL should be dried and screened prior to submittal. Non-conforming samples may require additional charges for drying, sieving, etc. TKN testing is available for plant tissues, soils, and solutions through the ARL. Soil sample submission forms are available on our website.
Testing for total phosphorus in soil is available through the ARL. The procedure used by the ARL to prepare soil samples for Total Phosphorus analysis is described below.
Total Phosphorus Preparation Procedure
Total Phosphorus Digestion for Soils
- Weigh 1 g of sample into a 50-mL beaker. For each of 20 samples or part of 20 samples, weigh 1 replicate sample. There should be at least 2 method blanks and 2 LCS per set of 90 beakers.
- Put beakers in muffle furnace. Set temperature to 500°C and hold for 4 hours at this temperature.
- Turn off muffle furnace and allow to cool.
- Add 20 mL of 6N HCI to each beaker. Place on hot plate.
- Turn thermostat to #6 setting and turn on hot plate.
- After 1 hour increase temperature to #7 setting.
- Leave samples on hot plate until HCl has evaporated and samples are dry.
- Turn off hot plate.
- Add 1 mL of 6N HCl to each beaker after samples have cooled slightly. Allow samples to sit in acid solution for minimum of 15 minutes. Add 24 mL of 0.5N HCl for a final volume of 25 mL.
- Use a clean stir rod to mix soil with acid solution, scraping the bottom of the beaker before filtration into cup, and transfer to 20-mL scintillation vial for ICP analysis.
- Analyze on ICP for phosphorus.
Testing for Phosphorus Fractionation by the procedure of Zhang and Kovar (2000) will be available through the ARL. The sequential fractionation scheme for Inorganic P and Organic P are shown in Figures 1 and 2.
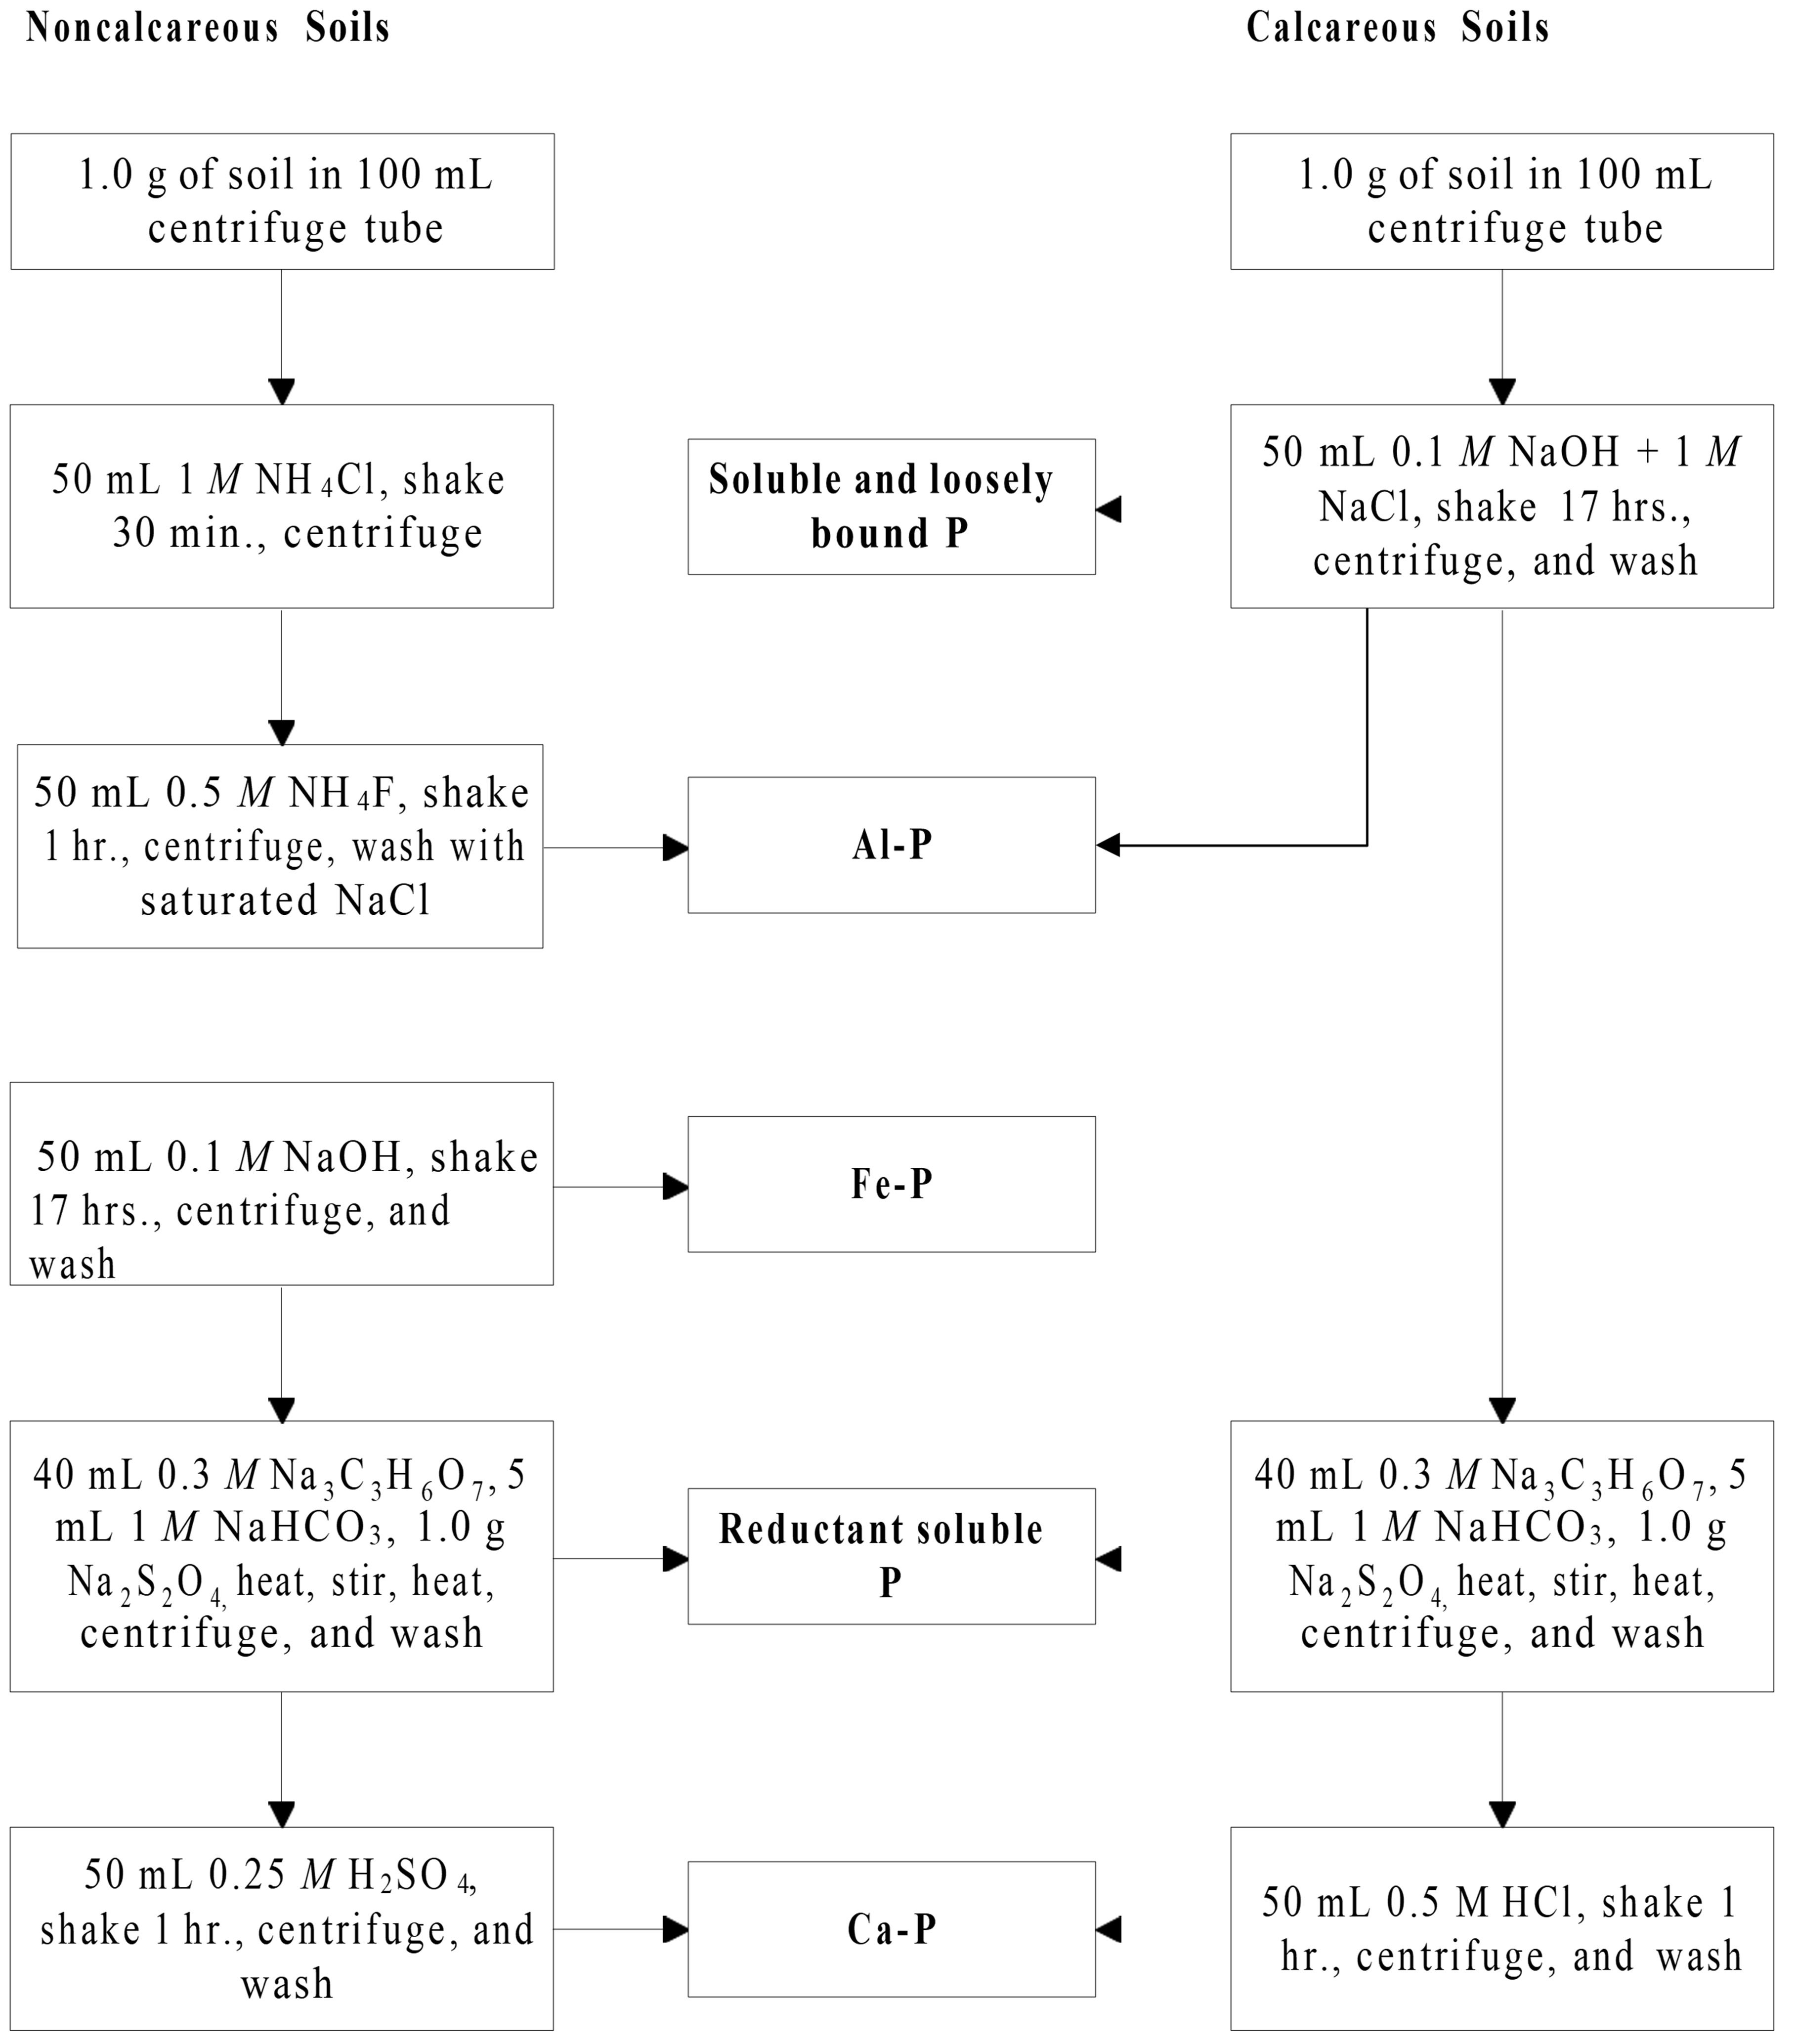
Credit: Adapted from Zhang and Kovar (2000)
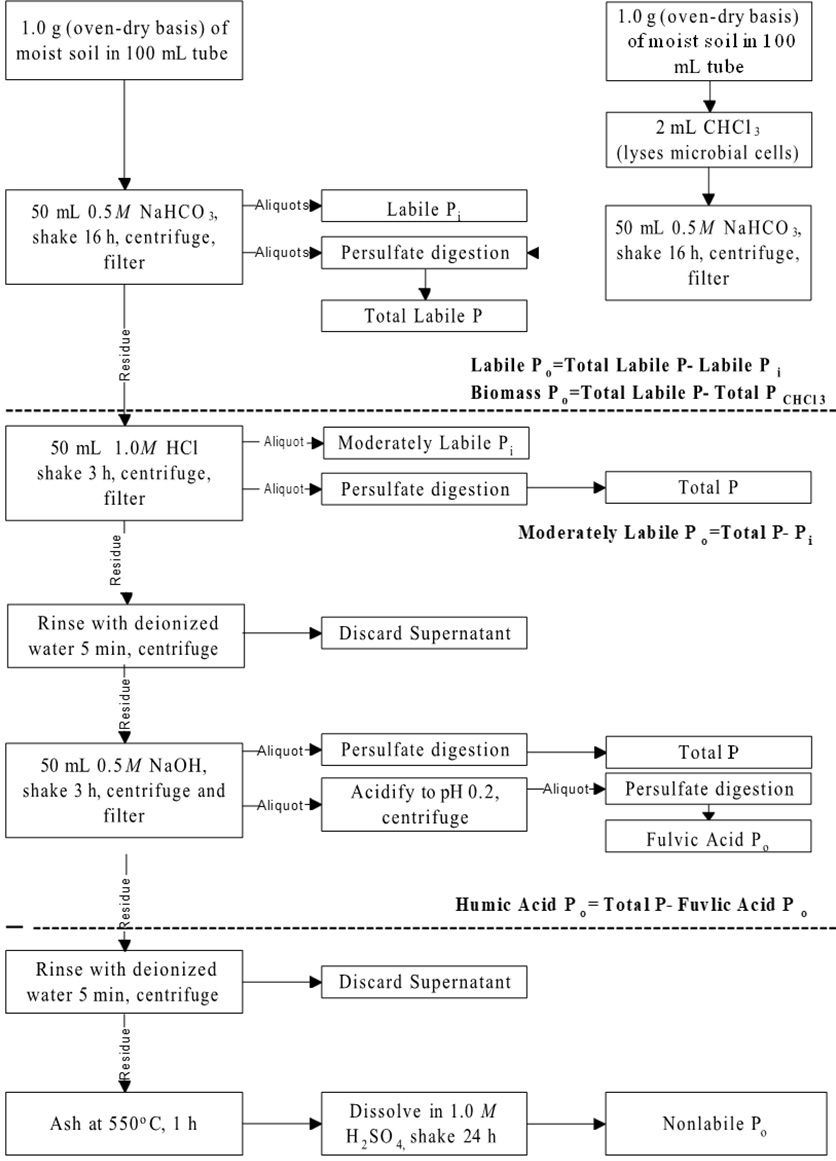
Credit: Adapted from Zhang and Kovar (2000)
Water Extraction Procedure
- Weigh 2 g of sample into appropriate extraction container. For each of 20 samples or part of 20 samples, weigh 1 replicate sample. There should be at least 1 method blank and 1 LCS per shake.
- Add 20 mL of DI (de-ionized) water to each sample and shake for 10 minutes at 180 rpm. Filter samples and collect aliquot for ICP metals, nitrate + nitrite, ammonia, and chloride analysis.
- Amounts can be adjusted if more parameters are required for analysis.
Potassium Chloride Extraction Procedure
Reagents
1M Potassium Chloride (KCl)
Dissolve 74.56 grams of KCl in 1 L of pure water.
KCL Extraction for Soils
- Weigh 5 g of sample into appropriate extraction container. For each of 20 samples or part of 20 samples, weigh 1 replicate sample. There should be at least 1 method blank and 1 LCS per shake.
- Add 25 mL of 1M KCl to each sample and shake for 30 minutes at 180 rpm. Filter samples and collect aliquot for nitrate + nitrite (NO3-N) and ammonium (NH4-N) analysis.
Solution Testing
The ARL offers testing for solution samples as well. Many of the tests offered for soil samples are available for solutions, as well, with the exception of organic matter analysis. Solution samples should be submitted in 20-mL scintillation vials. Solution sample submission forms are available on our website.
Tissue Testing
The ARL also offers testing for plant tissue samples. The list of tests offered for plant tissues are ICP metals by digestion, TKN, TN and TC. Tissue samples submitted should be dried and ground prior to submission or additional costs may be incurred. Plant tissue sample submission forms are available on our website.
Environmental Water Quality Laboratory: Mission and Purpose
UF/IFAS Environmental Water Quality Laboratory now performs the Certified Analysis that was earlier carried out by ARL. All the Analyses performed are NELAC Certified. It offers researchers affiliated with UF/IFAS high-quality analytical services through various tests on non-potable water.
EWQL Mission Statement
The mission of the UF/IFAS Environmental Water Quality Laboratory is “to offer UF/IFAS researchers high quality analytical services for an appropriate selection of standard tests in a timely manner, through adoption of The NELAC Institute (TNI) certification protocols.”
Description of Tests Offered in the EWQL
The EWQL scope of accreditation offers testing for nitrate + nitrite (NO3-N), ammonia (NH4-N), TKN, total phosphorus, ortho-phosphate, conductivity, and pH and ICP metals in non-potable water samples. ICP metals currently available for analysis by the EWQL are P, K, Ca, Mg, Zn, Mn, Cu, Cd, Al, Na, Fe, B, Ni, and Pb. Certified sample submission forms are available on our website: https://arl.ifas.ufl.edu/ARL_files/CertifiedAnalysisForm2011.pdf.
Analytical Procedure for EWQL
Analytical procedures used in the EWQL are the same as those performed in the ARL for solutions analyses; however, ICP metals are limited to our Scope of Accreditation. Specific methods and analytes certified are cited on the Laboratory Scope of Accreditation, which can be found on our website: https://arl.ifas.ufl.edu/EWQL%20Home.asp. Quality controls are more stringent in the EWQL when compared to the ARL (Table 6). Additional fees are charged for samples requiring dilution and/or reanalysis.
Quality Control
Operations within an analytical laboratory must address quality control to maintain both accuracy and precision. This dedication to quality control must begin with detailed procedures and address all steps in which inaccuracies can be introduced. Efforts to control inaccuracies are directed at three levels: quantitative chemical techniques, instrument monitoring, and managerial process inspection. The ESTL's Quality Control Plan addresses each of these areas assuring that the laboratory produces high quality and reliable data. Details concerning the ANSERV Laboratories Quality Control procedures can be obtained by contacting the laboratory director or the manager. The ESTL participates in the Agricultural Laboratory Proficiency Testing (ALP) Program which assists soil, plant, and water testing laboratories in their performance through interlaboratory sample exchanges and a statistical evaluation of the analytical data. The EWQL participates in Proficiency Testing (PT) studies for each field of accreditation biannually.
Laboratory Safety
The University of Florida has in place a Chemical Hygiene Plan developed by the Division of Environmental Health and Safety (EH&S) to assist UF departments in the recognition, evaluation, and control of hazards associated with laboratory chemical operations and is intended to meet the requirements of the OSHA Laboratory Standard, 29 CFR 1910.1450.
The primary focus of this core Chemical Hygiene Plan (CHP) is to provide guidance to the laboratory staff to safely use chemicals in the laboratory. All lab personnel are required to attend annual Hazardous Waste Management training sessions. In addition, there is an annual Laboratory Safety survey conducted by EH&S staff.
The following is a general list of safety requirements that should be followed by any person handling laboratory chemicals or working in a chemical laboratory:
- Always wear an acid/base resistant laboratory coat when handling corrosive chemicals.
- Always wear goggles/eyeglasses as minimum eye protection when handling chemicals and samples.
- Always wear appropriate gloves when handling chemicals.
- Never work alone in a chemical laboratory.
- Never eat or drink in the laboratory area.
- Do not store food in chemical refrigerators.
- If working with an unfamiliar chemical, always read the label and check the MSDS before proceeding.
- Always transport concentrated acids/bases or other dangerous chemicals in a rubberized safety bucket.
- Know where the nearest fire extinguisher and eye wash station are located.
- Know the location of the nearest phone and how to reach 911 or the local emergency number.
- Do not pipet chemicals by mouth.
- Wear appropriate laboratory clothing including closed-toe shoes and long pants. Tie back long hair.
- Over the ear headphones should not be worn in the laboratory.
- If earbuds are used, a single earbud should be worn.
- Awareness of one’s surroundings in the laboratory is key to safety.
- Being able to hear one’s surroundings is critical to safety. Volume should never be at a level to block ambient sounds from laboratory.
References
Adams, F., and C. E. Evans. 1962. "A Rapid Method for Measuring Lime Requirement of Red-Yellow Podzolic Soils." Soil Science Society America Journal. 26(4): 355–357. https://doi.org/10.2136/sssaj1962.03615995002600040015x
Allison, L. E. 1965. “Organic Carbon.” In C. A. Black, D. D. Evans, L. E. Ensminger, J. L. White, and F. E. Clark (ed.) Methods of Soil Analysis, Part 2: Chemical and Microbiological Properties, 9.2. 1367–1378. https://doi.org/10.2134/agronmonogr9.2.c39
Mitchell, C. C., and R. Mylavarapu. 2014. “Soil Test Correlation and Calibration for Recommendations.” In Soil Test Methods from the Southeastern United States. Southern Cooperative Series Bulletin No. 419. 11–18. USDA-SERA-IEG-6. ISBN 1-58161-419-5. http://aesl.ces.uga.edu/sera6/PUB/MethodsManualFinalSERA6.pdf
Mylavarapu, R. 2014. “Walkley-Black Method.” In Soil Test Methods from the Southeastern United States. Southern Cooperative Series Bulletin No. 419. 158–161. USDA-SERA-IEG-6. ISBN 1-58161-419-5. http://aesl.ces.uga.edu/sera6/PUB/MethodsManualFinalSERA6.pdf
Mylavarapu, R. S., J. F. Sanchez, J. H Nguyen, and J. M. Bartos. 2002. “Evaluation of Mehlich-1 and Mehlich-3 Extraction Procedures for Plant Nutrients in Acid Mineral Soils of Florida.” Communications in Soil Science and Plant Analysis. 33(5–6): 807–820. https://doi.org/10.1081/CSS-120003067
Mylavarapu, R., and R. Miller. 2014. “Soil Preparation, Measurement, and Storage.” In Soil Test Methods from the Southeastern United States. Southern Cooperative Series Bulletin No. 419. 20–22. USDA-SERA-IEG-6. ISBN 1-58161-419. http://aesl.ces.uga.edu/sera6/PUB/MethodsManualFinalSERA6.pdf
Mylavarapu, R., C. C. Mitchell, and H. J. Savoy. 2014. “Soils of the Southeastern US.” In Soil Test Methods from the Southeastern United States. Southern Cooperative Series Bulletin No. 419. 2–10. USDA-SERA-IEG-6. ISBN 1-58161-419-5. http://aesl.ces.uga.edu/sera6/PUB/MethodsManualFinalSERA6.pdf
Peters, J. D., ed. 2003. Recommended Methods of Manure Analysis. Dept. Soil Sci., University of Wisconsin-Madison, WI. Accessed on May 1, 2014. https://datcp.wi.gov/Documents/NMManureAnalysisUWEX.pdf
Pittman, J. J., H. Zhang, J.L. Schroder, and M.E. Payton. 2005. “Differences of Phosphorus Extracts Determined by Colorimetric and Spectroscopic Methods.” Communications in Soil Science and Plant Analysis. 46(11–12): 1641–1659. https://doi.org/10.1081/CSS-200059112
Soltanpour, P. N. 1991. “Determination of Nutrient Availability and Elemental Toxicity by AB-DTPA Soil and ICPS.” In B.A. Stewart (ed.) Advances in Soil Science. 16: 165–190. https://doi.org/10.1007/978-1-4612-3144-8_3
Southern Region Information and Exchange Group on Soil Testing and Plant Analyses (SRIEG 18). 1983. Reference Soil Test Methods for the Southern Region of the United States. Southern Cooperative Series Bull. 289. Univ. of Georgia, Athens, GA. https://aesl.ces.uga.edu/sera6/PUB/SCSB289.pdf
Zhang, H., D. H. Hardy, R. Mylavarapu, and J. J. Wang. 2014. “Mehlich-3.” In Soil Test Methods from the Southeastern United States. Southern Cooperative Series Bulletin No. 419. 101–110. USDA-SERA-IEG-6. ISBN 1-58161-419-5. http://aesl.ces.uga.edu/sera6/PUB/MethodsManualFinalSERA6.pdf
Zhang, H., S. Kaiuki, J. L. Schroder, M.E. Payton, and C. Focht. 2009. “Interlaboratory Validation of the Mehlich 3 Method for Extraction of Plant-Available Phosphorous." Journal of AOAC International. 92(1): 91–102. https://doi.org/10.1093/jaoac/92.1.91
Zhang, H., and J. L. Kovar. 2000. “Phosphorus Fractionation.” In Methods of Phosphorus Analysis for Soils, Sediments, Residuals, and Waters. Southern Cooperative Series Bulletin No. 396. 50–59. USDA-SERA-IEG-17. ISBN 1-58161-396-2. https://citeseerx.ist.psu.edu/document?repid=rep1&type=pdf&doi=c3713db4ecdc1f92ca2ea685ef940117bcfd27f2
Table 1. Current Interpretations for Mehlich-3 and AB-DTPA Soil Tests.
Table 2. Applications for Scoops Used at the Extension Soil Testing Laboratory.
Table 3. Extension Soil Testing Lab Methods and Control Checks.
Table 4. Livestock Waste Testing Lab Methods and Control Checks.
Table 5. Analytical Research Lab Methods and Control Checks.
Table 6. Environmental Water Quality Lab Methods and Control Checks.