Crop Water Use and Irrigation Scheduling Guide for North Florida
Crop Water Use and Irrigation
Scheduling Guide
Effective irrigation scheduling enables the irrigator to apply the right amount of water at the right time to meet the crop water demand. This guide presents information on average daily and weekly crop water use and crop growth stages for twelve north Florida crops that can be used to help schedule irrigation. This will allow a grower to develop a realistic irrigation schedule that minimizes plant water stress, saves water, and reduces nutrient leaching potential.
The crops included in this guide are: (i) Bermudagrass, (ii) Bean (Snap), (iii) Cabbage, (iv) Carrot, (v) Corn (Field), (vi) Corn (Sweet), (vii) Cotton, (viii) Cucumber, (ix) Grain sorghum, (x) Peanut, (xi) Potato, and (xii) Small grains.
Crop Evapotranspiration
Crop water use, also called crop evapotranspiration (ETc), is defined as the combined transfer of water from the land surface to the atmosphere in the form of water vapor by (i) evaporation and (ii) plant transpiration. Crop water use or ETc depends on many factors, which we can divide into three major categories.
- Weather and climatic conditions:
- Amount of sunshine (ETc is much greater on a sunny day than on a cloudy day)
- Air temperature (ETc increases from winter to spring to summer)
- Amount of wind (ETc is greater on a windy day than on a calm day)
- Humidity (ETc is greater on a dry day than on a humid day)
- Crop parameters:
- Crop type
- Crop age or crop growth stage
- Management practice:
- Planting dates
- Planting densities
- Irrigation method
- Crop residue
Crop Evapotranspiration (ETc) Calculations
The average daily ETc (inch/day) was calculated by adjusting the reference evapotranspiration (ETo, inch/day) by a specific crop coefficient (Kc) that takes crop type and age into account as:
The ETo is the rate of water loss by evaporation and transpiration from a healthy (free from water stress and diseases) hypothetical reference crop, e.g., grass. This closely resembles the ETc from an extensive surface of green grass of uniform height that is actively growing, well-watered, and completely shading the ground.
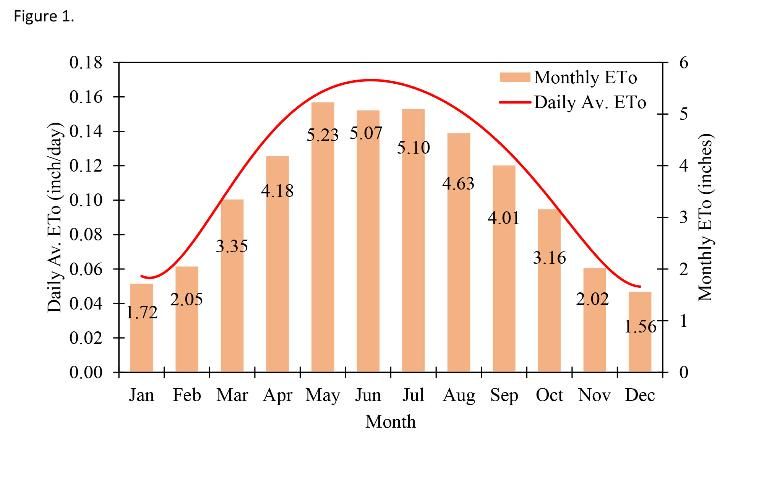
In this guide, the weather data from the Florida Automated Weather Network (FAWN; https://fawn.ifas.ufl.edu/), including maximum and minimum air temperature, relative humidity, solar radiation, and wind speed at 6 ft (2 m) height measured over the uniform grass surface, were used to calculate the ETo using the Standardized Penman-Monteith equation (ASCE 2005). Figure 1 presents the long-term average of daily (inch/day) and monthly (inches) ETo. A detailed description of the Standardized Penman-Monteith ETo calculation procedure is provided in EDIS publication AE459, Step by Step Calculation of the Penman-Monteith Evapotranspiration (FAO-56 Method) (https://edis.ifas.ufl.edu/ae459).
Credit: Vivek Sharma, UF/IFAS
The crop coefficient (Kc) is the integrated crop factor that incorporates the crop canopy characteristics and management practices. Each crop has different sets of Kc values depending on the growth stages of the crop and field/crop management practices. In this guide, Kc values for different crops were taken from FAO Irrigation and Drainage Paper No. 56 (FAO-56). These Kc values were further fine-tuned based on local data collected from various on-field trials.
Detailed descriptions of ETc and Kc are provided in EDIS publications AE455, Evapotranspiration-Based Irrigation for Agriculture: Sources of Evapotranspiration Data for Irrigation Scheduling in Florida (https://edis.ifas.ufl.edu/ae455), AE456, Evapotranspiration-Based Irrigation for Agriculture: Crop Coefficients of Some Commercial Crops in Florida (https://edis.ifas.ufl.edu/ae456), and AE457, Evapotranspiration-Based Irrigation Scheduling for Agriculture (https://edis.ifas.ufl.edu/ae457).
Irrigation Scheduling
Irrigation scheduling is the process to determine the amount of water application (volume) and timing (when to start and stop irrigation). In this guide, irrigation schedule for the aforementioned crops was developed for the following scenarios:
- Soil water-holding capacity of 0.7 inches per foot or 1.0 inches per foot.
- Management allowable depletion (MAD) of 50%.
Soil water-holding capacity is the amount of water stored between field capacity (FC) and permanent wilting point (PWP). FC is the amount of soil water remaining in the soil profile after excess water due to a heavy rain event or irrigation application has drained, and the rate of downward movement has decreased or stabilized. PWP is the soil water content at which the soil cannot supply water at a sufficient rate to maintain the turgidity of the plants, and the plants permanently wilt.
The MAD is the moisture level below which flow of water from the soil to the roots is reduced and causes a reduction in crop yield potential. If the soil water reservoir is not replenished by irrigation or rain, the water content continues to decrease and eventually reaches a point where a plant can no longer recover even if water is added. MAD is primarily a function of crop stress tolerance, crop species and varieties, crop growth stage, soil type, management approach, and climate. This value is small for sensitive crops such as vegetables, but larger for crops that can tolerate some water stress without affecting yields. In this guide, MAD is calculated as 50% of total available water content (TAW) in the crop root zone. The TAW is defined as:
TAW (inches) = Soil water holding capacity (inch per foot) * Rooting depth (inch)/12
Note that established perennial plants such as alfalfa, grasses, trees, and shrubs have relatively constant root zone depth. However, for annual crops, irrigation schedule changes as the crop progresses over the growing season. For this reason, in this guide the irrigation schedule was developed for different rooting depths (Tables 1 and 2).
When calculating the irrigation demand, account for the irrigation system inefficiencies and amount of precipitation within the period under consideration. In this publication, adjustments were made to ETc values considering the irrigation system efficiency of 75%. In case irrigation system efficiency is more than 75%, adjust the irrigation application rate as Iadj:
Iadj = Chart Irrigation Application Rate (Tables 1 and 2) * 0.75/Actual Irrigation Efficiency
For more information on irrigation scheduling and related terms, consult EDIS documents CV297, Principles and Practices of Irrigation Management for Vegetables (https://edis.ifas.ufl.edu/cv297), and AE457, Evapotranspiration-Based irrigation Scheduling for Agriculture (https://edis.ifas.ufl.edu/ae457).
How to Use This Guide
Caution: Depending on local weather conditions, ETc on a given day can differ substantially from the long-term average daily ETc values shown in this guide. For example, crop water demand will be higher than average on days that are warmer and/or windier than normal, and demand will be lower on days that are cooler and/or cloudier than normal. However, when estimating crop water demand for a period of several days, the values shown in this guide are of sufficient accuracy to help guide irrigation scheduling.
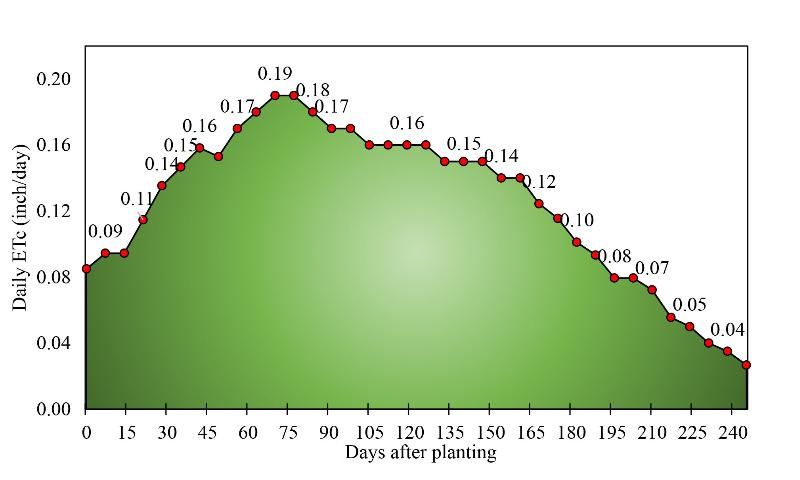
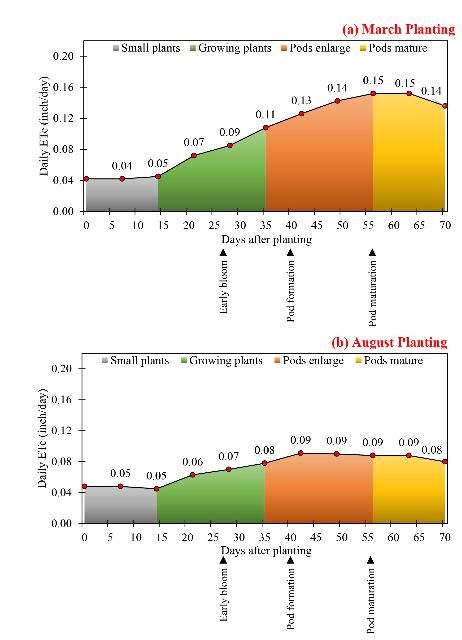
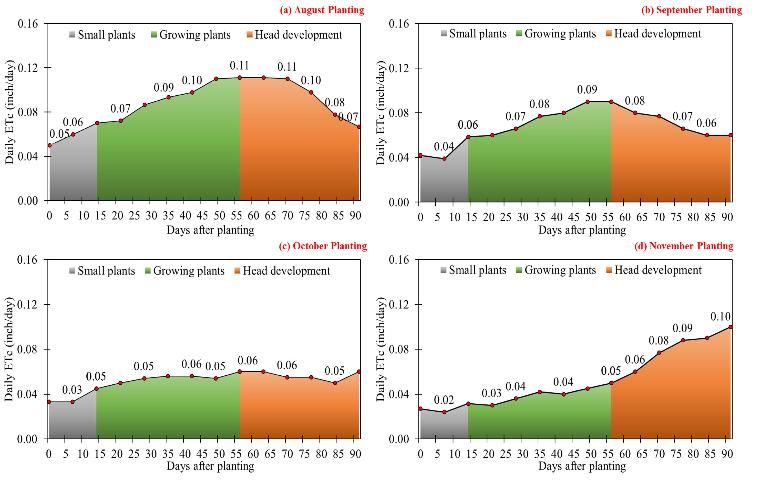
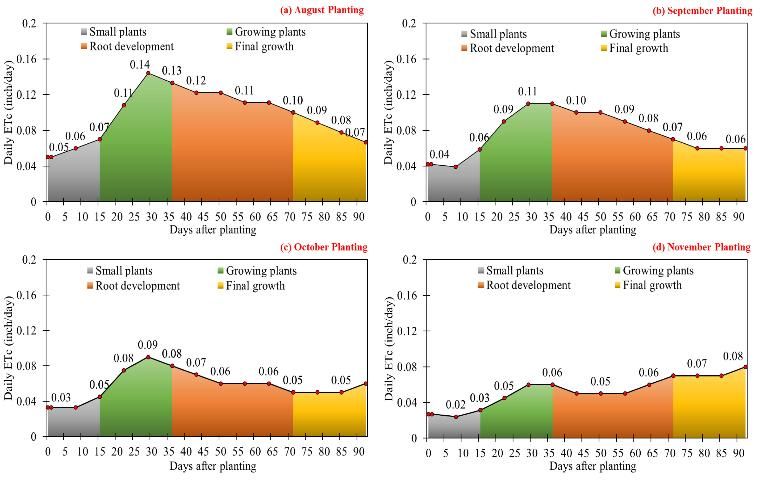
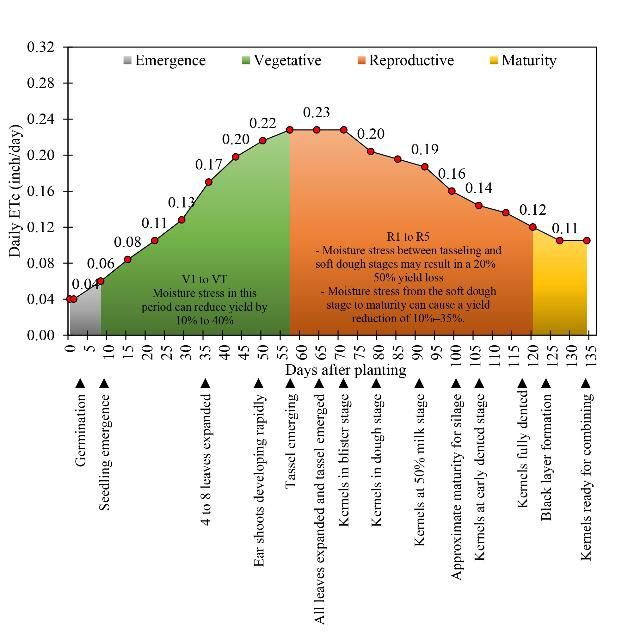
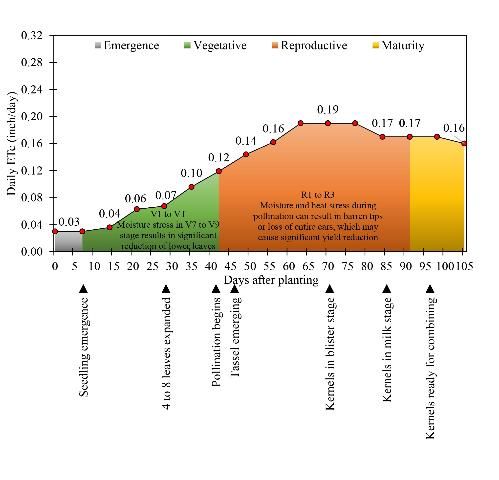
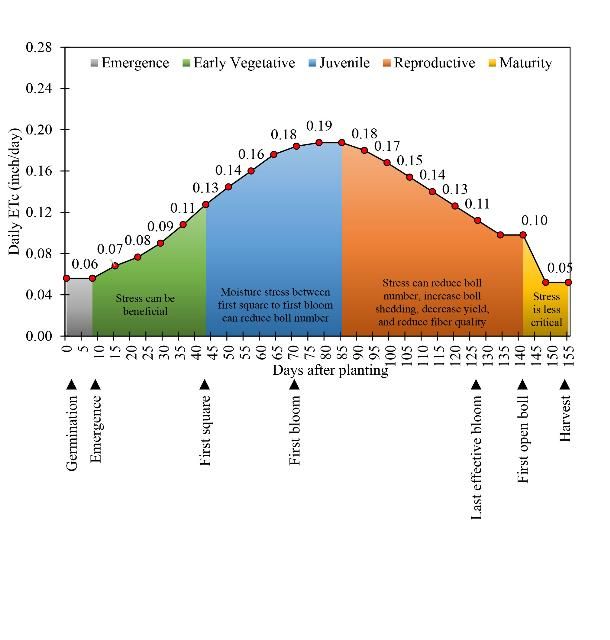
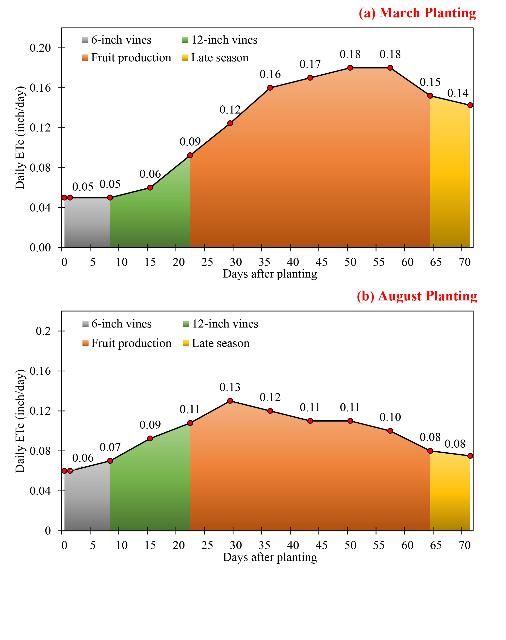
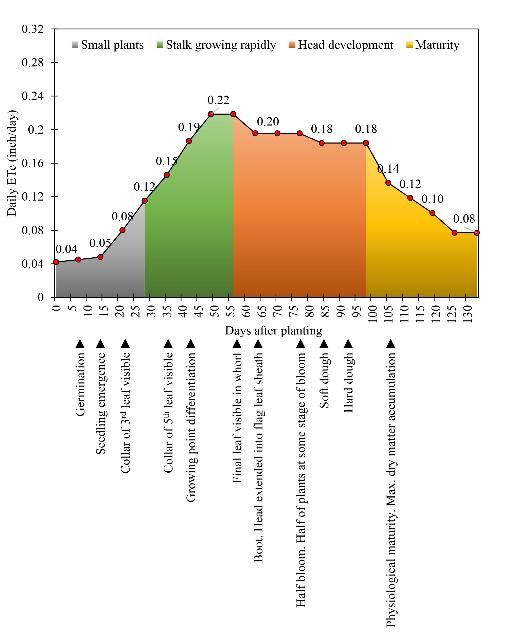
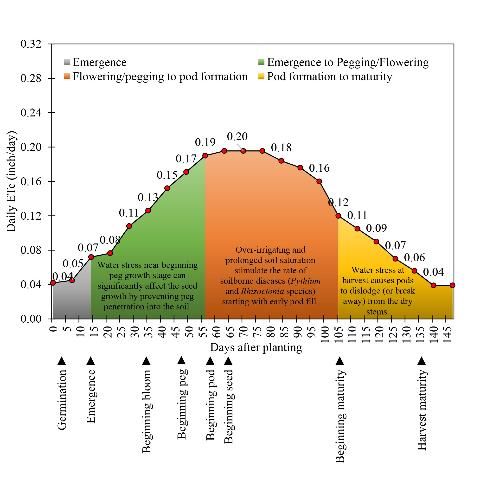
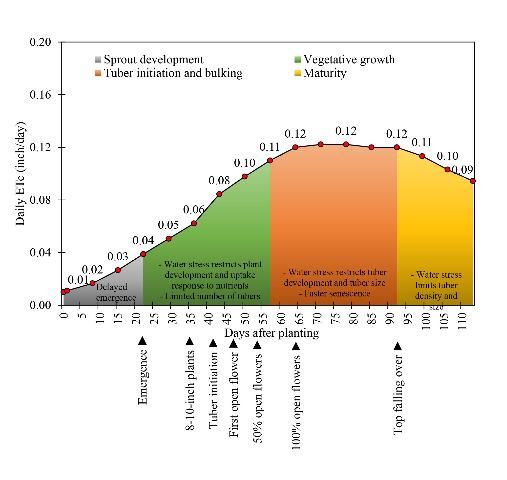
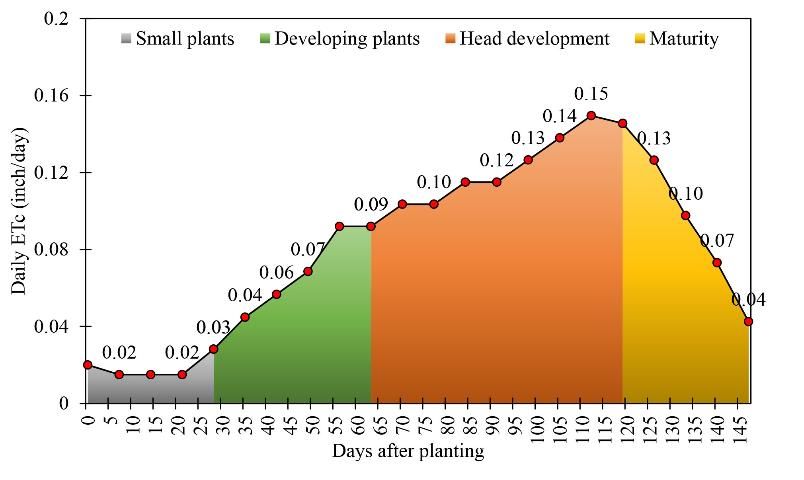
- Locate the graph for the crop of interest (Figures 2 to 13).
- Determine the point of interest in the growing season using the plant growth stage or days after planting. Key growth stages for different crops are provided.
- Estimated crop water use in inch per day is shown at the intersection of ETc (inch/day) (y-axis) and plant growth stage or day after planting (x-axis).
- Determine the crop rooting depth, then find a base irrigation schedule from the tables at the end of this guide (Tables 1 and 2).
- If the irrigation system, soil, or allowable depletion differs from above, adjust the irrigation schedule accordingly.
Credit: Vivek Sharma, UF/IFAS
Credit: Vivek Sharma, UF/IFAS
Credit: Vivek Sharma, UF/IFAS
Credit: Vivek Sharma, UF/IFAS
Credit: Vivek Sharma, UF/IFAS
Credit: Vivek Sharma, UF/IFAS
Credit: Vivek Sharma, UF/IFAS
Credit: Vivek Sharma, UF/IFAS
Credit: Vivek Sharma, UF/IFAS
Credit: Vivek Sharma, UF/IFAS
Credit: Vivek Sharma, UF/IFAS
Credit: Vivek Sharma, UF/IFAS
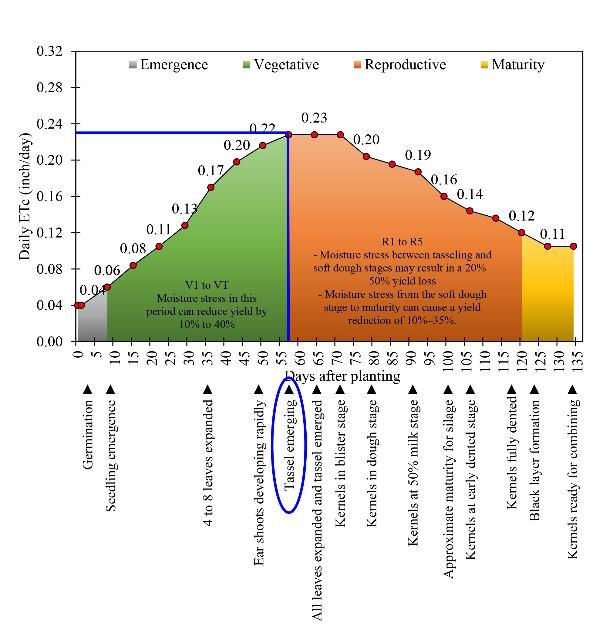
Example
Crop: Corn
Days after planting: 56
Growth Stage: Tassel emerging
Rooting depth: 24 inches
Soil type: Sandy
Water-holding capacity: 0.7 inch per foot
Application efficiency: 75%
Step 1: Locate the graph for the crop of interest.
Step 2: Locate the "Tassel emerging" growth stage on the x-axis of the crop water use chart. (If growth stage information is not available, use days after planting information.)
Step 3: Estimate crop water use (ETc) in inches per day corresponding to the "Tassel emerging" growth stage. In this case, it is 0.23 inches.
Step 4: Use Table 1 to identify nearest water use. In this case, it is 0.24 inches per day.
Step 5: Locate the rooting depth of 24 inches in Table 1.
Step 6: Determine the irrigation schedule for your setting corresponding to root depth and crop water use. In this case, irrigation of 0.64 inches is needed. The next irrigation is required after 2 days.
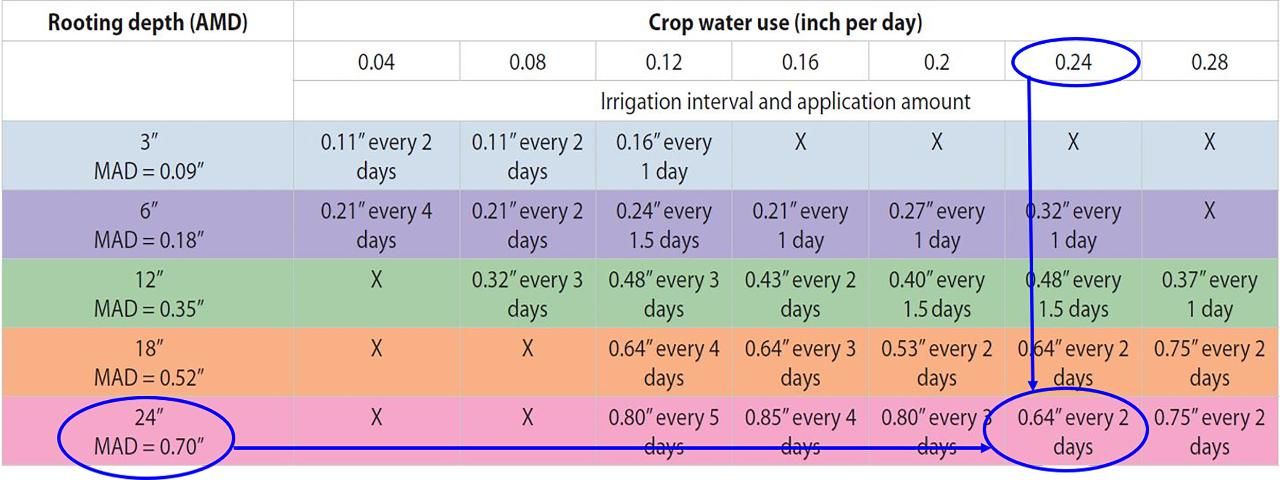
Note: This irrigation schedule is prepared assuming the irrigation system application efficiency (Eapp) of 75%. If the irrigation system's efficiency is more than 75% (e.g., 90%), adjust the irrigation application rate as (Iadj):
Iadj = Chart Irrigation Application Rate * 0.75/0.90 = 0.64 * 0.75/0.90 = 0.53 inches
References
ASCE-EWRI. 2005. "The ASCE Standardized Reference Evapotranspiration Equation." Technical Committee Rep. to the Environmental and Water Resources Institute of ASCE from the Task Committee on Standardization of Reference Evapotranspiration.
Dukes, M. D., L. Zotarelli, G. D. Liu, and E. H. Simonne. 2018. Principles and Practices of Irrigation Management for Vegetables. AE260. Gainesville: University of Florida Institute of Food and Agricultural Sciences. https://edis.ifas.ufl.edu/cv107
Kisekka, I., K. Migliaccio, M. D. Dukes, J. H. Crane, B. Schaffer, S. M. Guzman, and H. K. Bayabil. 2019. Evapotranspiration-Based Irrigation for Agriculture: Crop Coefficients of Some Commercial Crops in Florida. AE456. Gainesville: University of Florida Institute of Food and Agricultural Sciences. https://edis.ifas.ufl.edu/ae456
Kisekka, I., K. W. Migliaccio, M. D. Dukes, B. Schaffer, J. Crane, H. K. Bayabil, and S. Guzman. 2020. Evapotranspiration-Based Irrigation Scheduling for Agriculture. AE457. Gainesville: University of Florida Institute of Food and Agricultural Sciences. https://edis.ifas.ufl.edu/ae457
Kisekka, I., K. W. Migliaccio, M. D. Dukes, B. Schaffer, J. Crane, K. Morgan, H. K. Bayabil, and S. Guzman. 2020. Evapotranspiration-Based Irrigation for Agriculture: Sources of Evapotranspiration Data for Irrigation Scheduling in Florida. AE455. Gainesville: University of Florida Institute of Food and Agricultural Sciences. https://edis.ifas.ufl.edu/ae455
Zotarelli, L., M. D. Dukes, C. C. Romero, K. W. Migliaccio, and K. T. Morgan. 2018. Step by Step Calculation of the Penman-Monteith Evapotranspiration (FAO-56 Method). AE459. Gainesville: University of Florida Institute of Food and Agricultural Sciences. https://edis.ifas.ufl.edu/ae459
Approximate irrigation interval and application amount for soil with 0.7 inch per foot water-holding capacity. Amounts shown are based on management allowable depletion (MAD) of 50% and the average application efficiency for a well-designed and maintained center pivot or lateral move irrigation system of 75%.
Approximate irrigation interval and application amount for soil with 1.0 inch per foot water-holding capacity. Amounts shown are based on the management allowable depletion (MAD) of 50% and the average application efficiency for a well-designed and maintained center pivot or lateral move irrigation system of 75%.