Using Journey Mapping within Extension: A Tool for Supporting Behavior-Change Programs
Introduction
Extension is an important change agency, and Extension professionals use innovative strategies to help target audiences adopt research-based practices and technologies (Rogers, 2003). Concepts from commercial marketing can be applied to behavior-change campaigns through an underused approach known as social marketing. Journey mapping is a conventional research technique "used to document and understand the many different steps or stages in a journey that a person may undertake" (Crosier & Handford, 2012, p. 68). Journey maps can be developed with Extension clients to provide insight into their progression and decision-making from one place or state of being to another. A journey can be the steps a person takes when selecting plants for the landscape, the decision-making process used when identifying agricultural business strategies, the support and advising received through a peer or professional mentorship experience, or the steps a person takes when leaving a workshop and travelling to their home. This document was developed to provide an overview of this tool for Extension professionals working in any program area.
Journey Mapping to Understand Behavior Change
Behavior change often takes place in incremental stages (Conroy & Allen, 2010; Prochaska et al., 1997; Warner et al., 2014, Zobeidi et al., 2022), and providing information at decision points is one of the most important features to consider when designing effective household behavior-change interventions (Stern & Wolske, 2017). (For more information about stages of change, visit https://edis.ifas.ufl.edu/publication/wc189).
Journey maps have been lauded as a powerful tool for understanding the customer's point of view (Temkin, 2010). Journey maps are visualizations of a person's experience as they work toward a goal, often with added information, such as feelings or emotions, at key points (Howard, 2014; LeFebvre et al., 2016). A journey map can also be used to systematically track client experiences accessing and using services (Panzera et al., 2017). In addition to physical actions and decisions, journey maps may help to identify and illustrate problems, successes, and emotional responses to relevant services to develop a personal narrative of an experience (Panzera et al., 2017).
Journey mapping has been used in market research for over 50 years but has been drastically underused by social science and behavioral researchers, especially to track and evaluate behavior change and adoption (Crosier & Handford, 2012). Journey mapping can be applied and adapted in a variety of ways. Across, most journey maps, touchpoints are used to identify and describe the most critical interactions that may impact how a customer or client feels about a service or product (Patterson, 2009). In this document we discuss how journey mapping could be used by Extension professionals and data, such as touchpoints, could be analyzed to improve behavior change strategies. A worksheet is also included in Appendix A for readers to apply journey mapping in real-world Extension contexts.
Credit: J. Shellhouse, UF/IFAS
Examples of Using Journey Maps in Behavior-Change Contexts
While journey mapping has been predominately applied in the retail and product-design sectors, more recently the technique has been employed for social and behavior change, primarily in the public-health context (Esposito & Zeledon, 2013). Examples include tracking the journeys of substance abusers in rehabilitation programs (Roarty et al., 2012), observation of shopping experiences for blind or visually impaired individuals (Brahme et al., 2016), and evaluation of public health programs (Panzera et al., 2017).
An example to learn from is the Special Supplemental Nutrition Program for Women, Infants, and Children (WIC), which conducted a health program evaluation using journey mapping to understand economically disadvantaged families' access to nutrition and health services (Panzera et al., 2017). Journey mapping was used to investigate the reasons for dropping family enrollment since 2012 in Kentucky (Panzera et al., 2017). The program attempted to reconstruct the experiences of WIC participants and use journey mapping to collect data visualizing perceived emotions, issues, stigmas, and successes of people who stopped participating. WIC's data collection methods included direct observation, abbreviated participant observation to mimic participant experiences, and focus groups (Panzera et al., 2017). Data were analyzed to identify key failures or opportunities by the program at various steps (touchpoints). The journey map is an excellent example of the visual output associated with this technique (see https://s3.amazonaws.com/aws.upl/nwica.org/wic_journey_map.pdf). The technique allowed the program staff to visualize user-reported benefits and barriers. For example, data demonstrated that many participants had trouble scheduling appointments and accessing transportation to appointments (Panzera et al., 2017).
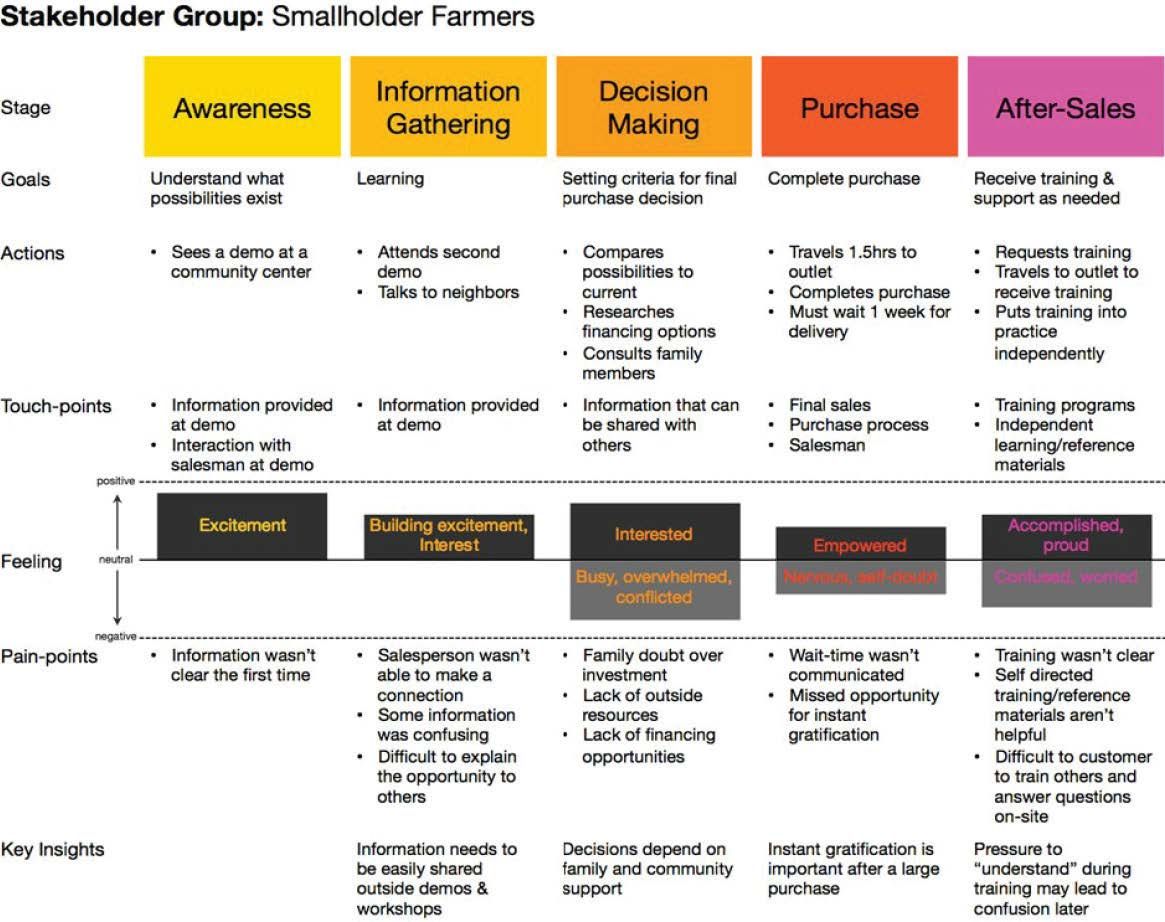
Researchers have also applied journey mapping in the social entrepreneurship field, testing an adapted version of the technique to identify key stakeholders and their needs in the establishment of a for-profit affordable greenhouse venture to benefit smallholder farmers in Sierra Leone (Ortbal et al., 2016). Journey mapping was used to aid project planners to facilitate a collaborative and efficient process to document different types of stakeholders’ needs and opportunities. The researchers explained that "the visual nature of journey mapping facilitates active participation and listening within a diverse group where members have various strengths and weaknesses and prefer different communication methods" (Ortbal et al., 2016, p. 250). In constructing the journey map, touchpoints were identified by participants at each anticipated stage in the launch of the greenhouse venture and were categorized as pain points or opportunity points. These two categories were assigned according to participants' anticipated emotional responses at the stages. The project team then would work to reduce negative impacts of pain points and build on the strengths of opportunity points (Ortbal et al., 2016).
Given the lack of applications of journey mapping in Extension, the above example highlights how this technique can be used to understand stakeholder barriers and capacities, which is pertinent to Extension. Furthermore, Extension professionals may leverage the collaborative and participatory process through which journey mapping can be facilitated to better engage their clientele and gather data on their needs and ideas that can be missed using standard or more conventional assessments.
Credit: J. Shellhouse, UF/IFAS
Uses of Journey Mapping in Extension
Journey mapping has only been modestly applied in the educational space (Ortbal et al., 2016). Recently Shellhouse et al. (2021) used the technique to examine national FFA officers’ mentoring experiences in four life stages, prior to their election as officers and in the subsequent years. The authors credit journey mapping for illustrating the importance that professional respect and affect play in officers’ positive mentoring experiences. Silvert and Warner (2019) also used journey mapping to examine residents’ adoption (or non-adoption) of smart irrigation technologies to conserve water in their yards. Through constructing a journey map, the researchers found residents were motivated by social support and belonging (e.g., the Master Gardener Volunteer program) and they prefer to engage with technologies that are less time and labor intensive. There is scope to integrate journey mapping (and adapted versions) into Extension program design, implementation, and evaluation. By visualizing the steps that a person takes to access an Extension program and identifying perceived barriers preventing their optimal experience in the program, an Extension professional can make programs more appealing and services more beneficial to clients. Below are some general areas where Extension professionals may consider using journey mapping.
Program Design and Stakeholder Analysis
Similar to the greenhouse venture example, in Extension, journey mapping could be used in the design and setup of an Extension program by documenting target participant/client segments’ perceptions or emotions linked to the proposed or new program. First, the intended users of the program should be determined. Then the key stages in their anticipated journey should be identified to guide data collection. The journey's stages could be for the entire program or a portion, such as establishment. Within each stage of the journey, data can be collected to predict participants’ perceptions, intentions, emotions, or whatever types of data are deemed useful. These data are valuable to define touchpoints within each stage based on recurring trends or the most notable opportunities or needs.
For example, if a new Extension program serving a cross-sector of urban and semi-urban households aims to promote water conservation behaviors in the home landscape, under a hypothetical Action/Implementation stage, it may be relevant to record persons' attitudes on water conservation, their current irrigation behaviors, and whether the household hires outside landscaping services. Collection of this information would help determine users and non-users of conservation practices. The researcher should also examine whether feelings and emotional responses tend to be positive, negative, or neutral at each stage. For instance, worry about the costs of implementing the practices could evoke negative emotions while a sense of empowerment by actually doing something about water scarcity could be a positive feeling.
Identifying and Analyzing Touchpoints
Following the identification of the clients and stakeholders, an appropriate next step could be to use feedback at each stage to determine the touchpoints where targeted users may interact with the Extension service. A key touchpoint to consider when setting up a program could be the promotion of the program and the facilitation of access to relevant information to interested persons. For example, a touchpoint for the home landscape water conservation program could be participation by interested household representatives in informational sessions about launching the initiative. Another touchpoint could represent the process of accessing online materials about the program before deciding whether to participate. While the researcher may identify anticipated touchpoints, in a journey map reflective of client experiences, touchpoints should be informed by direct feedback.
In another Extension context, if a program aimed to encourage farmers to apply an alternative treatment to their crops, involvement in a field-day demonstration about application of the treatment could be a touchpoint identified through the data-collection process. Additional touchpoints in this example could describe how farmers access crop diagnosis and treatment information sources and consider them in making informed decisions to take action.
Analysis of the interactions at the identified touchpoints should be done by developing a set of criteria that infers where weak areas or barriers may impair clients' experiences (Patterson, 2009). To analyze touchpoints for stakeholders in the for-profit greenhouse venture in the previous section, researchers labelled touchpoints either pain points or opportunity points to account for perceived benefits or barriers (physical or emotional) for the participants (Ortbal et al., 2016).
An example analysis of touchpoints could be exploring how residents seek knowledge and information to guide the purchase of new water-efficient irrigation systems. If household participants claim that they visit chain hardware stores and perceive that sales representatives are often not knowledgeable or unavailable, and participants leave frustrated and confused about this topic, then data would describe this experience as a pain point. If, however, participants explain that local Extension agent approach them, and they learn about the benefits of numerous irrigation options and are excited and feel well-informed, then this experience would be an opportunity point.
Hypothetical analysis of decisions and feedback at touchpoints in water-conservation management of the home landscape.
While applying journey mapping to set up and design a program is largely based on anticipated experiences, by involving actual target users of the program, it can be a powerful technique to reduce disconnect between the program and its users. Aside from contributing to design, when the new program's staff participate in journey-mapping data collection with target clients, they build relationships at an early stage to foster communication with participants on their needs and capacities.
Distance Learning and Knowledge Sharing
Extension professionals may consider journey mapping to better promote user-friendly and appropriate methods that encourage Extension clientele’s access to information- and knowledge-sharing opportunities. Modern Extension increasingly employs Information Communication Technologies (ICTs) such as, but not limited to, webpages, smartphone applications, or remote sensory innovations. Uptake and optimization of these tools require learning and training on their use, and their proper functioning with updated and relevant data. The application of journey mapping to track user experiences when accessing (or attempting to access) distance-learning tools resembles the use of journey mapping in the retail sector, frequently analyzing consumer online-shopping experiences. Touchpoints could describe data on participants' ease of access and their experience with a program. For example, Extension professionals could use journey mapping to track how a farmer uses a smartphone application to schedule her irrigation, or they could determine why a non-user farmer is reluctant to use such an application. The overall goal would be to assess where and why a user is satisfied and competent or becomes confused, reluctant, or frustrated during access and use processes.
Program Evaluation
Journey mapping can allow an evaluation to zoom into the micro-levels of program implementation to assess impacts and participants' perceptions by "stepping into their shoes." For example, in the evaluation of the WIC nutrition program, the evaluators found that enrollment dropped due to transportation constraints when attempting to attend appointments (Panzera et al., 2017). While such a detail may be outside the scope of standard evaluation data, through journey mapping's participant-narrative approach, these potentially significant issues with the program are revealed.
In Extension, journey mapping could be a participatory evaluation tool, using data-collection techniques such as focus groups, reflection sessions, and client shadowing. In 4-H programming, this technique might be used to understand how youth spend their time after school at specific points in a wellness program to identify possible increases in activity level. In an agricultural program, journey mapping could be used to determine the steps urban farmers take when accessing resources as a result of a new initiative. Participants would likely appreciate the efforts by the program to understand firsthand their reactions and experiences. Multimodal techniques that can encourage participation are described later in this article.
Analysis of touchpoints should illustrate what was supposed to happen or be delivered through the program and what actually happened and was delivered according to the participants, which is key for a robust evaluation. Constraints that prevented the target objectives from being achieved and strength areas where the program met or exceeded targets should be highlighted. Typically, the visual map(s) that results would be an aggregate compilation summarizing user feedback and data.
While there could be many opportunities to integrate journey mapping into evaluations of Extension programs, for simplicity, the previous example of the residential-landscape water conservation program will be used again. Following completion of the program, the standard evaluation may use indicators to estimate quantities of water conserved by the homes during the span of participation in the program. If there is high variance in the amounts of water consumed or conserved or a notable difference for two distinct groups (e.g., urban and less urban), a journey map could be used to dig deeper and track differences in client experiences at key stages, within the two segments, to infer why the program impacted some clients more than others, and programmatic adjustments could be made to improve client experiences and better promote behavior change.
Possible Data Collection and Analysis Approaches
There are various approaches to data collection and analysis in the literature on journey mapping. In fact, concepts of journey mapping are often adapted for a variety of purposes and contexts, as implied in the above section, and methods are modified and devised accordingly. The majority of data collected for journey mapping is qualitative, and therefore, while a diverse group of subjects from key program areas is important, the sample size may be relatively small (as compared to a population study, for example). Below are suggested approaches for journey-mapping data collection and analysis that may be appropriate in Extension and research contexts.
Determining the Stages to Include in the Journey Map
A key first step to data collection is to become familiar with the Extension program's design, key objectives, and processes intended to reach and facilitate change for clients. This may include review of program manuals, proposals, and interviews with administrators and Extension professionals involved with the program. Upon review of background information, Extension professionals or researchers should outline the key stages to examine during data collection. In the WIC journey map referenced above, the three key stages focus on the clinic, retail outlet, and kitchen.
Generally, broad stages should be proposed before data collection, and then more specific touchpoints will arise from the participant data. For example, during a focus group, if multiple participants highlight an interaction point that affected their experience, the researcher would likely add this as a touchpoint to the journey map.
Shadowing and Direct Observation
In the retail sector, the “mystery shopper” technique is applied in journey mapping to discover barriers that negatively impact consumer experiences. In Extension, a similar approach could be useful to test whether resources and processes are accessible to and effectively serving clients. A simple example could be to ask individuals unfamiliar with a smartphone application for monitoring their home landscape irrigation to watch a recommended tutorial and try to properly use the application. Notes should record points when they experienced difficulty and/or points when they were comfortable and found the tutorial and application helpful.
Focus Group and Reflection
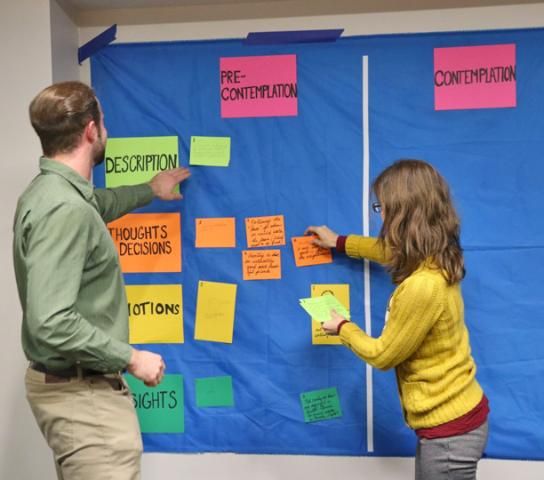
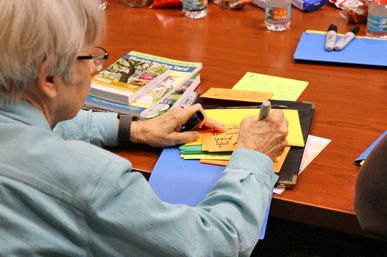
Likely the most practical form of journey mapping data collection in Extension, focus groups and reflection activities allow participants to be actively involved in the journey-mapping process. If the aim is to examine distinct groups (i.e., small-scale farmers vs. medium-scale farmers), focus-group meetings might be facilitated separately, or subgroups could be formed during activities. Whether in-person or using a virtual format such as Zoom, it is important, first, that participants in a focus group are briefed on the purpose of the data collection and the concept of journey mapping. Data-collection activities should be interactive, fun, dynamic, and designed appropriately for the individuals present. The facilitator(s) can use visuals, such as colored notecards or post-it notes to categorize responses and discussion themes. Facilitators may also use a “virtual whiteboard” (e.g., from Mural or Google Jamboard) for online journey mapping. Consider alternatives to written or verbal data. For example, faces could be drawn to describe emotions at stages in the journey. During the focus group, a journey draft should be mapped and visualized, allowing participants to assess whether the visual accurately reflects their experiences and input. For an effective focus group, an environment of respect and openness should be promoted, and all feedback should be documented, including direct quotes, before any internal analysis takes place. It is also recommended facilitators take photographs of visuals and/or group notes to accurately transfer data to a stored electronic format such as an Excel sheet or PowerPoint file.
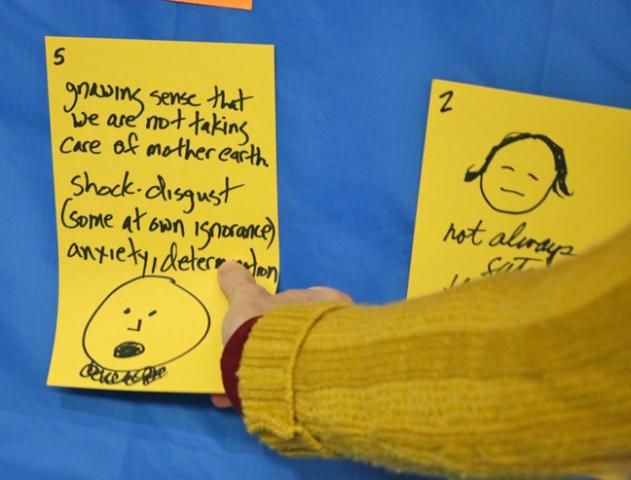
Credit: J. Shellhouse, UF/IFAS
Analysis and Interpretation
An analysis framework, established in the planning stage, is important to guide collecting data to construct a journey map. Various techniques have been applied to data analysis for journey mapping. A potential approach to designing the framework is to have a horizontal axis with stages or progression of time and a vertical axis with data categories (Howard, 2014). The following example template was used to visually record participant feedback when designing the greenhouse social venture in Sierra Leone.
In this example, broad stages were identified before data collection, and more specific touchpoints were later added based on participants' data. To gauge emotional responses, pain points were identified, and participants were asked to describe whether certain actions at stages evoked emotions. Those emotions were added to the template as positive, neutral, or negative (Ortbal et al., 2016).
Credit: Reprinted from "Stakeholder Journey Mapping: An Educational Tool for Social Entrepreneurs," by K. Ortbal, N. Frazzette and K. Mehta, 2016, Procedia Engineering, 159, p. 256
Conclusion
The complexities and challenges Extension professionals face in promoting improved behaviors and disseminating information amongst diverse audiences require the use of a variety of evaluation and program planning techniques. Journey mapping is an innovative and emerging technique Extension professionals can use to better understand and evaluate how target clientele may change their behaviors. The technique is adaptable and can be facilitated in a variety of settings, with limited resources. You can learn more by practicing the technique, using the simple worksheet found in Appendix A with instructions to create a journey map.
Acknowledgment
This work was supported by the USDA National Institute of Food and Agriculture, Hatch project 1018367.
References
Brahme, M. E., Gabriel, L., & Stenis, P. V. (2016). Don't stop believing: Mapping distance learners' research journeys. Journal of Library & Information Services in Distance Learning, 10(3-4), 118–136. https://doi.org/10.1080/1533290X.2016.1206779
Conroy, D. M., & Allen, W. (2010). Who do you think you are? An examination of how systems thinking can help social marketing support new identities and more sustainable living patterns. Australasian Marketing Journal, 18(3), 195–197. https://doi.org/10.1016/j.ausmj.2010.06.006
Crosier, A., & Handford, A. (2012). Customer journey mapping as an advocacy tool for disabled people: A case study. Social Marketing Quarterly, 18(1), 67–76. https://doi.org/10.1177/1524500411435483
Esposito, M., & Zeledon, J. (2013). 5 ways you can use journey maps to help change behavior. Washington, D.C.: National WIC Association. https://www.nwica.org/blog/5-ways-you-can-use-journey-maps-to-help-change-behavior#.XOPvL_ZFyUk
Howard, T. (2014). Journey mapping: A brief overview. Communication Design Quarterly Review, 2(3), 10–13. https://doi.org/10.1145/2644448.2644451
LeFebvre, C., Taylor, O., & Thomas, V. (2016, June). Aligning journeys, jobs, and value for more relevant and effective social marketing programs. Presentation at the University of South Florida Social Marketing Conference, Clearwater, FL.
Ortbal, K., Frazzette, N., & Mehta, K. (2016). Stakeholder journey mapping: An educational tool for social entrepreneurs. Procedia Engineering, 159(Humanitarian Technology: Science, Systems and Global Impact 2016, HumTech2016), 249-258. https://doi.org/10.1016/j.proeng.2016.08.170
Panzera, A. D., Bryant, C. A., Hawkins, F., Goff, R., Napier, A., Schneider, T., ... O'Rourke, K. (2017). Mapping a WIC mother's journey: A preliminary analysis. Social Marketing Quarterly, 23(2), 137154. https://doi.org/10.1177/1524500417692526
Patterson, L., (2009). Managing Touch point value: 10 steps to improve customer engagement. Accessed September 2022. https://visionedgemarketing.com/wp-content/uploads/2008/05/managing%20touch%20point%20value%2010%20steps%20to%20improve%20customer%20engagement.pdf
Prochaska, J. O., Redding, C., & Evers, K. (1997). The Transtheoretical Model and stages of change. In K. Glanz, F. M. Lewis, and B. K. Rimer (Eds.), Health Behavior and Health Education: Theory, Research and Practice (2nd Edition). Jossey-Bass Publications, Inc.
Roarty, L., Wildy, H., Saggers, S., Conigrave, K., Wilson, M., Di Nicola, K., & ... Faulkner, J. (2012). 'My journey map': Developing a qualitative approach to mapping young people's progress in residential rehabilitation. Contemporary Drug Problems: An Interdisciplinary Quarterly, 39(4), 715-733. https://doi.org/10.1177/009145091203900406
Rogers, E. M. (2003). Diffusion of Innovations (5th edition). Free Press.
Shellhouse, J. A., Suarez, C. E., Benge, M., & Bunch, J. C. (2021). Mentoring mentality: understanding the mentorship experiences of national FFA Officers. Journal of Agricultural Education, 62(1), 29-46. https://doi.org/10.5032/jae.2021.01029
Silvert, C., & Warner, L. A. (2019, February). Mapping the behavior change journey to smart irrigation in the home landscape. [Abstract]. HortScience, 54(9), S376.
Stern, P. C., & Wolske, K. S. (2017). Limiting climate change: What's most worth doing? Environmental Research Letters, 12(9). https://doi.org/10.1088/1748-9326/aa8467
Warner, L., Galindo-Gonzalez, S., & Gutter, M. S. (2014). Building impactful extension programs by understanding how people change. University of Florida Cooperative Extension Electronic Data Information Source (AEC527). https://edis.ifas.ufl.edu/publication/wc189
Zobeidi, T., Yaghoubi, J., & Yazdanpanah, M. (2022). Farmers’ incremental adaptation to water scarcity: An application of the model of private proactive adaptation to climate change (MPPACC). Agricultural Water Management, 264, 107528. https://doi.org/10.1016/j.agwat.2022.107528
Appendix A
Journey-Mapping Instructions and Worksheet
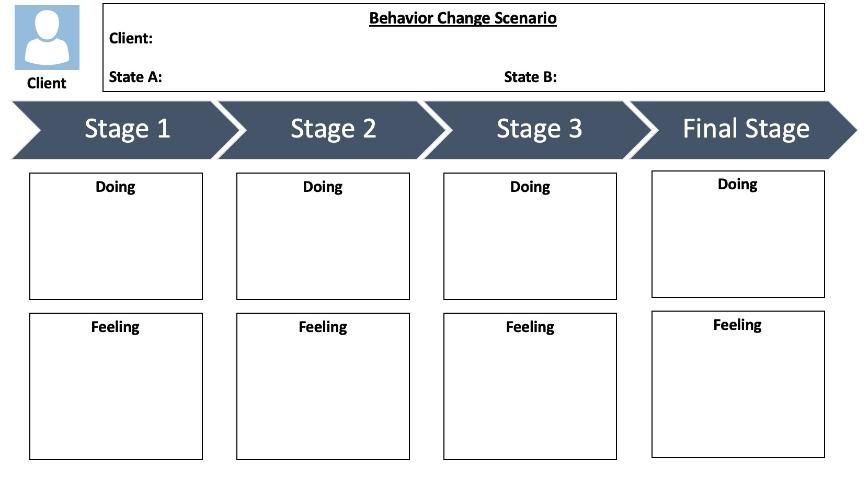
- On top of the journey map, summarize the behavior-change scenario by answering the following questions: Who is the client? What is State A (before behavior change)? What is State B (after or during behavior change)?
For example:
Client: A resident in an urban neighborhood
State A: Uses a traditional sprinkler system and is unaware of water wastage
State B: Installs and uses a smart irrigation system to conserve water in the home landscape
2. At each stage, add information in the boxes from the client about what s/he is (or was) doing and the emotions s/he is (or was) feeling at the time. The journey should be a progression from Stage 1 (State A), to the Final Stage (State B) of implementation or maintenance of the change.
For example: At Stage 1 Doing, the resident is learning about the importance of water conservation in the landscape but using a traditional sprinkler system. S/he feels confused and helpless about how to start making changes.
3. Adapt journey mapping for your work! This is only a simple example that can be applied in a variety of contexts. A journey may have more or less than four stages, and you may collect information other than emotions and actions depending on the purpose of your journey map. Remember, stages can be described through creative alternatives to words, like drawing faces to represent emotions.