Measuring Pump Capacity for Irrigation System Design
Introduction
Proper design of an irrigation system requires that the pumping system be precisely matched to the irrigation distribution system. Then the pressure and flow rate required can be efficiently provided by the pumping system.
When an irrigation system is designed or modified to use an existing pumping system, it is necessary to measure the capacity of the existing pump. The irrigation system can be properly designed only if the flow rate and pressure of the pump are accurately measured.
It is not adequate to visually estimate pump capacity or to use the manufacturer's specifications to determine current pump capacity. Visual estimates are normally not accurate, and manufacturer's specifications do not include the effects of site-specific factors such as well characteristics or suction and discharge pipe sizes. Manufacturer's specifications also do not include the effects of age and wear on pumping system performance.
Measuring Pump Capacity
The capacity of a pump has two components, the pump discharge rate and the discharge pressure. The discharge rate is normally measured in gallons per minute (gpm) in English units or liters per second (lps) in metric units. Pressure is normally measured in pounds per square inch (psi) in English units or kiloPascals (kPa) in metric units. It is necessary to measure both discharge rate and pressure under normal operating conditions in order to determine how the pumping system will operate as a part of an irrigation system.
Discharge Rate
- The discharge rate can be measured using one of the following three methods.
- A flow rate meter is the most direct method because it measures the flow rate directly in gpm or lps. The cost of flow rate meters varies widely. Costs range from about $50 for small pitot meters which measure only flow rate, to several hundred dollars for impeller meters which measure flow rate and totalize the flow through the meter.
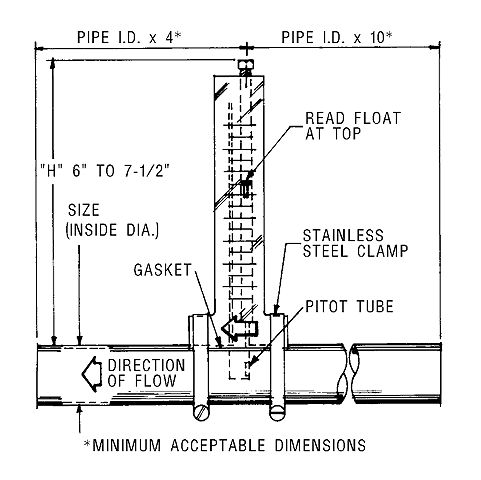
- Pitot meters are inserted through a hole drilled into an irrigation pipe. They divert a small stream of water through the meter and float a ball or disk flow indicator. The flow rate is read from a graduated scale at the height of the flow indicator. One type of commercially-available pitot flow rate meter is shown in Figure 1. An impeller flow rate meter measures both the flow rate and the total flow through the meter. The flow rate is read directly from a needle similar to a car speedometer, and the total flow is registered on a meter similar to the odometer (mileage gauge) on a car. An impeller meter is used as a component of the pump capacity measuring apparatus shown in Figure 2 .
- A totalizing flow meter measures the total volume of water that has passed through the meter in gallons (gal) or liters (l). Totalizing water flow meters are relatively inexpensive because they are commonly used for many applications ranging from metering homeowner's water use to metering agricultural irrigation systems. Their costs range from about $50 for 1/2-inch meters which have capacities up to 10 gpm to $2,000-3,000 for large meters with capacities of several thousands of gpm.
- To determine pump discharge rates with a totalizing flow meter, a stop watch or other watch with a second hand is needed. The volume of water metered must be divided by the time during which the volume was measured to determine the flow rate. For example, the meter register reads 200.0 gal at the beginning and 395.0 gal at the end of a 10 minute measurement period. Then the flow rate is (395-200) gal / 10 min = 19.5 gpm or 1.23 lps.
- Flow rates can be measured using a container of known volume and a stop watch. For example, flow is directed into a 50-gal graduated tank for 10 minutes. The volume of water collected is 47 gal. Then the flow rate is 47 gal / 10 min = 4.7 gpm or 0.30 lps.
Discharge Pressure
The discharge pressure can be measured easily and inexpensively using a standard pressure gauge. Standard pressure gauges are available in 15, 30, 60 and 100 psi (100, 200, 400 or 700 kPa) ranges for about $10. Select a pressure gauge that is accurate within the range of pressures that the pump can produce. For example, if your pump can produce a maximum pressure of 50 psi (345 kPa) select a 60-psi (400-kPa) gauge as the next-largest commercially-available size.
Measuring Head-Discharge Curves
For centrifugal and turbine irrigation pumps, the discharge rate depends on the pressure that the pump operates against. If the pressure is high, the discharge rate will be low, and conversely, if the pressure is low, the discharge rate will be high. The relationship between pressure and discharge rate is known as the head-discharge curve for the pump. The head-discharge curve may be different for each pump because of the pump characteristics and many site-specific factors.
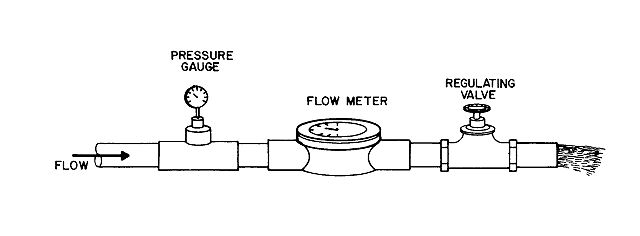
An apparatus which can be used to measure a pump head-discharge curve is shown in Figure 2. The apparatus consists of a pressure gauge, flow meter, and regulating valve installed on a section of straight pipe. The pipe must be long enough so that the flow meter works properly. Many flow meters require certain minimum lengths of straight pipe upstream and downstream of the meter for accuracy. See the flow meter manufacturer's specifications. Common straight pipe lengths required are 10 pipe diameters upstream and 6 pipe diameters downstream of the meter, although these lengths may be reduced if the flow meter is equipped with straightening vanes. Straightening vanes are installed inside the meter tube and help improve meter performance by reducing extreme turbulence as water is directed through the meter.
A pipe fitting or connecting hose is needed so that the head-discharge measurement apparatus can be connected to the pump discharge. All components must be sized and pressure-rated to permit the measurement of the complete range of pressures and discharge rates that the pump produces.
- Measure the head-discharge curve in the following steps:
- Connect the head-discharge apparatus to the pump discharge with sufficient lengths of straight pipe to obtain an accurate flow rate measurement.
- Operate the pump to remove air from the pump and pipelines and to reach normal operating conditions.
- Slowly close the regulating valve and measure the shut-off head. (Warning: Be certain that all components are pressure-rated to withstand the maximum pressure that the pump can deliver). The shut-off head is the maximum pressure that the pump delivers when there is no flow. Record this pressure.
- Do not leave the pump operating under no-flow conditions for long periods of time, as this may overheat and damage some pumps.
- Open the regulating valve a small amount and measure the pressure and flow rate at this valve setting.
- Repeat Step 4 at other valve openings until the valve is completely open. Valve adjustments should be made to produce at least 6 to 8 pressure-discharge data points over the flow range from completely closed to wide open.
- It is convenient to use the pressure gauge to uniformly distribute the measured data points over the range that the pump can produce. For example, assume that the pump shut-off head was 45 psi. Then, for convenience, adjust the regulating valve to set 5 psi changes in pressure as the valve is opened. First, open the valve until the pressure drops to 40 psi and measure the discharge rate at that pressure. Then, open the valve until the pressure drops to 35 psi, etc., until the valve is completely open and the final pressure is 0 or nearly 0 psi. The final pressure may not reach 0 depending on the specific design of your head-discharge measurement apparatus.
Example Head-Discharge Data
An example set of head-discharge data is shown in Table 1 . These data were developed following the previous example in which the shutoff head was assumed to be 45 psi (310 kPa), and flow rates were measured at 5 psi (34 kPa) increments until the regulating valve was completely open. This measurement strategy produced a total of 10 data points.
Figure 3 is a graph of the data shown in Table 1. Notice that the relationship between pressure and discharge rate is a curve rather than a straight line. This is the reason that at least 6 to 8 data points are necessary to accurately describe this relationship.
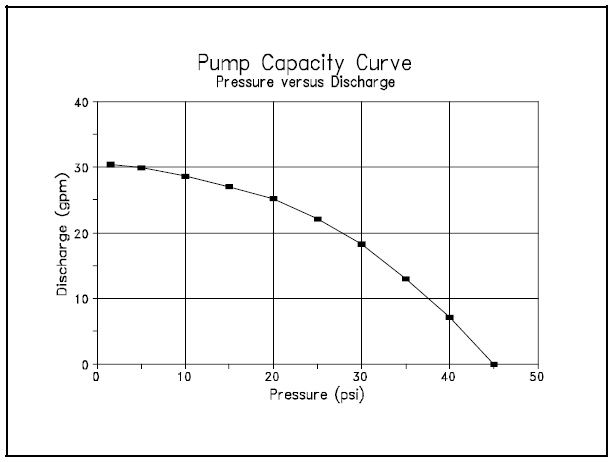
From the data shown in Table 1 and Figure 3 , the designer can read the information needed to properly design an irrigation system using this pump. For example, if a sprinkler irrigation system requires 35 psi (214 kPa) at the pump, then 13.0 gpm (0.82 lps) is the maximum flow rate that is available from this pump. If the system requires more than 13.0 gpm, then it will need to be designed and operated in zones so that no zone requires more than 13.0 gpm.
As another example, if a drip irrigation system requires 20 psi (138 kPa) from the pump, then this pump can deliver 25.2 gpm (1.59 lps) at this pressure.
Factors Affecting Head-Discharge Curves
Many factors affect the pump head-discharge curves measured, including the design of the pump and the size of the pump and power unit. Other factors include worn impellers or other components, speed at which the pump is operated, size of well, aquifer characteristics, depth to water table or surface water level, and size of suction and discharge pipes. The size, design, and maintenance of intake screens and check valves also affect pump capacity.
The measurement procedures described in this publication allow the effects of all of these factors to be included, and the results are valid only when the same conditions exist during the operation of the irrigation system. If operating conditions change greatly from the test conditions, then the pump may produce much different outputs when connected to an irrigation system. In the following paragraphs, several examples are given to illustrate changes in pumping conditions that could cause changes in pump capacity.
If water is being pumped from a pond, and the pond water level drops greatly during the irrigation season, the pump output will be reduced as the water level drops. Likewise, if the water level in a well drops, then the pump output will also drop. Thus, pump capacity tests should be scheduled when water levels are low so that the minimum pump output can be measured, or tests should be made at both high and low water levels so that the effects of water levels can be measured.
If the pump is driven by an internal combustion engine, its output will be greatly affected by the engine speed (RPM). Therefore, pump capacity tests must be run at the same RPMs that will be used during irrigation.
If the intake strainer on the suction pipeline becomes partially clogged by debris in a pond, the pump capacity will be reduced. Thus, pump capacity tests should only be conducted after strainers have been cleaned and other maintenance has been performed. Likewise, routine maintenance is required so that the pump capacity is not reduced for this reason during irrigation.
Summary
When an existing pumping system will be used as a component of an irrigation system, it is necessary to measure the capacity of the pump so that the irrigation system can be designed to operate efficiently using the available flow rate and pressure. This requires measuring pump discharge rates and pressures at several points over the available range. Flow meters or volumetric methods can be used to measure discharge rates, while pressures are easily measured with pressure gauges. Procedures for measuring pump capacity were presented, and factors affecting pump capacities under field conditions were discussed.
