Florida's Water Resources
Introduction: Why Water Resources Are Important
"Water is the lifeblood of our bodies, our economy, our nation and our well-being" (Stephen Lee Johnson, Head of EPA under G.W. Bush Administration).
This quote sums up the importance of water resources. We use water for drinking, gardening, and other household uses, in agriculture (e.g., for irrigation), and in energy production and industrial processes (e.g., for cooling in thermoelectric power generation). Clean and plentiful water resources are also important for our recreational activities (e.g., boating, swimming, or fishing). Water also sustains wildlife (such as manatees) and is an integral part of Florida's environment (Figure 1). As of November 2021, record breaking manatee deaths (over 1,000 deaths within 11 months) highlights the importance of clean waterways for wildlife’s survival (Chesnes 2021, FFWCC 2021).

Credit: UF/IFAS
The use of water is increasing along with Florida's population. Floridians rely on underground freshwater reserves, called aquifers, to supply our diverse water needs (USGS 2016a). In some Florida regions, this underground freshwater reserve can no longer sustain the growing water demands of the population, while also feeding Florida's rivers, springs, and lakes. With periodic droughts, shortages of freshwater may occur. Drought and water shortages in the state have caused urban planners and policy makers to pay closer attention to water use, water supply development, and water resource management. Florida public opinion surveys show that the majority of Floridians rate water as an issue of top importance for the state (UF/IFAS Center for Public Issues Education 2016). A better understanding of Florida's water resources is a first step toward optimizing current freshwater supply use and ensuring adequate water resources in the future.
Hydrologic Cycle: Where Water Originates and Where It Goes
Toni Morrison, an American novelist, once said that "all water has a perfect memory and is forever trying to get back to where it was." Indeed, water is constantly moving. The hydrologic (or water) cycle is the continual circulation / distribution of water on the surface of the land, in the ground, and in the atmosphere (USGS 2016b). Where water originates and how much water is available are fundamental to how water "cycles" through the environment. There are five basic processes in the hydrologic cycle: (1) condensation, (2) precipitation, (3) infiltration, (4) runoff, and (5) evapotranspiration (Figure 2). These processes can occur simultaneously and, except for precipitation, continuously. We will discuss these five processes in the context of Florida.

Credit: SWFWMD
Condensation
This process is familiar to any Floridian who leaves his or her car outside at night. In the morning, the car windows are covered with small droplets of water or dew. In general, condensation is the process by which water vapor changes from gas to liquid. This occurs as moist air cools. The cooling water vapor forms tiny droplets that cling to dust, salt, and smoke particles in the air and then form dew or fog. Cloud formation is another example of the condensation process which occurs at higher altitudes where the air is cooler.
Precipitation
Precipitation is the product of condensation of atmospheric water vapor. Rain is an example of precipitation, another stage in the hydrologic cycle. Precipitation occurs as water droplets formed at higher altitudes increase in size and gain weight, causing the droplets to fall due to gravity. Depending upon conditions, precipitation most typically occurs as rain, hail, snow, or sleet.
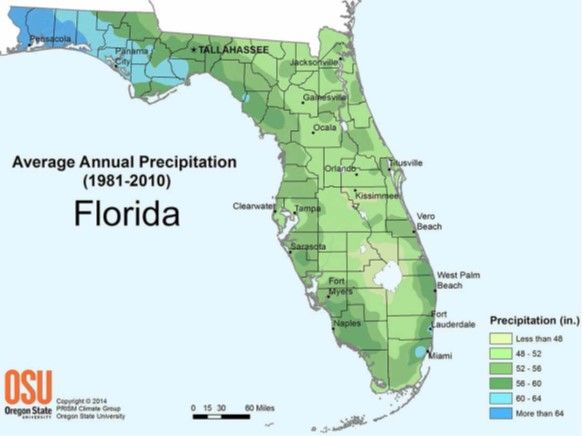
Florida has a subtropical to tropical climate and receives an average of 55 inches of rainfall per year (statewide averages for 1981–2010) (OSU/PRISM 2014; Florida Climate Center 2017). This is almost twice the national average of 31 inches per year, and five times higher than the level of rainfall in the driest US state, Nevada (11 inches per year; averages for 1981–2010) (NOAA/NCEI 2014, 2017).
Rainfall varies in amounts and in intensity from one Florida region to another, with the highest mean annual rainfall occurring in northwest Florida (the Panhandle) and in coastal areas of southeast Florida (Figure 3). In these regions, the average precipitation is about 60 inches per year. Other regions receive less rain. For example, the Florida Keys have an average of 40 inches of rainfall annually (average for 1981–2010) (OSU/PRISM 2014; Florida Climate Center 2017a).
Credit: OSU/PRISM
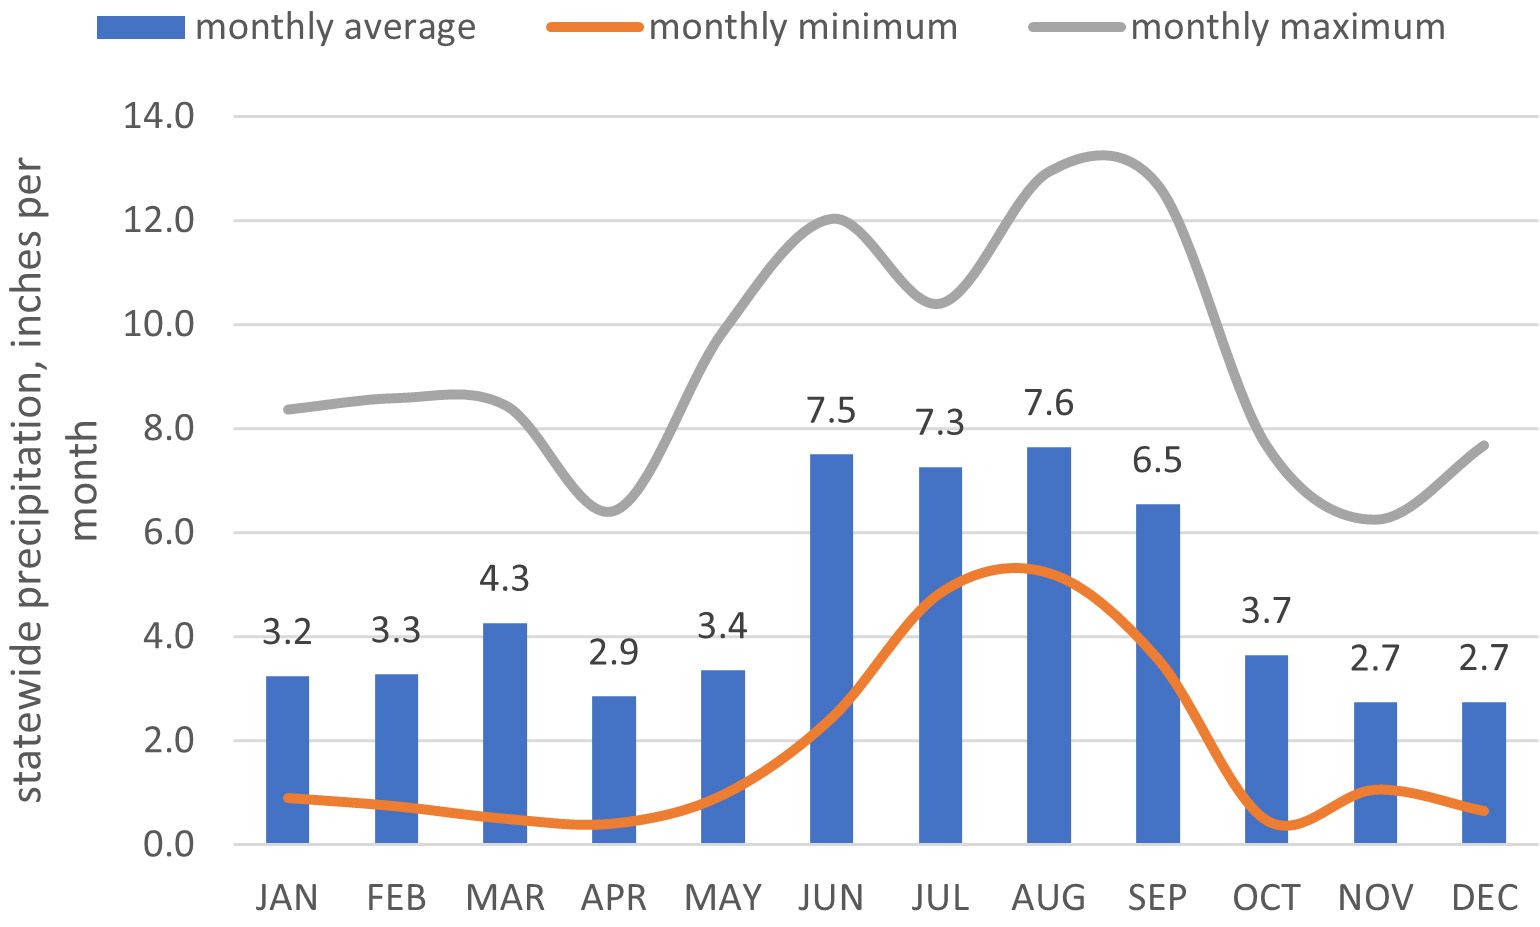
Seasonal variations in rainfall are also evident. Traditionally, summer is the wettest season in Florida, with more than half of the annual rainfall occurring during the June to September "wet season" (Figure 4). However, this pattern of seasonal precipitation varies (see minimum and maximum monthly precipitation values in Figure 4). During the wet season, tropical storms are normal in Florida, with some delivering over 10 inches of rainfall during a 24-hour period (causing flooding). Hurricane Easy (in 1950) has the highest estimated rainfall of almost 39 inches in 24 hours in Yankeetown (west-central Florida). Hurricane Jeanne (in 1980) has the highest official measured state record rainfall of approximately 23 inches within a 24-hour period (Florida Climate Center 2017b). Conversely, spring 2017 will be remembered for its widespread drought conditions, where in May, an astonishing 66% of the state registered drought of various severity levels due to low rainfall in the preceding months (Rice 2017).
Credit: Florida Climate Center
In Florida, significant volumes of water are used for residential landscape and agricultural crop irrigation. In the dry spring months, residential homeowners rely on supplemental irrigation for landscaping their yards. In turn, many agricultural crops in Florida are planted in the fall season when the air temperatures cool down, with harvesting in the winter and spring seasons, using irrigation during dry winter and spring months for supplemental irrigation and frost protection. Increasing water-use efficiency is a high priority for Floridians. For suggestions related to residential irrigation practices, see Florida Friendly LandscapingTM information at the University of Florida's website (http://fyn.ifas.ufl.edu/homeowners/nine_principles.htm). For best management practices (BMP) related to agricultural irrigation, consider exploring the BMP manuals available at the Florida Department of Agriculture and Consumer Services website (https://www.fdacs.gov/Agriculture-Industry/Water/Agricultural-Best-Management-Practices).
Capturing and storing rainfall in reservoirs to reduce the need for pumping water from aquifers during drier months is also a strategy being explored by Florida municipalities.
Infiltration, Percolation, and Recharges
When rainfall reaches the Earth's surface it can enter the ground (infiltration), collect into surface streams and lakes (runoff), or return to the atmosphere as water vapor (evapotranspiration). The phases of runoff and infiltration are highly interrelated, and are influenced by the form of precipitation, the type and amount of vegetative ground cover, topography, and soil permeability.
Infiltration occurs when water first enters the soil surface zone. Groundwater collects as the water that is not used by plants percolates (or seeps) downward until it encounters a zone (stratum) where the pores in the soil or rocks are saturated. Underground layers of porous material that are saturated with water are called aquifers. The water level can rise and fall in shallow or surface aquifers, depending upon local rainfall conditions. When a shallow groundwater aquifer is underlain by a stratum of low permeability called a confining unit (e.g., clay) (Figure 5), water is forced to move laterally through the aquifer and emerge into a surface spring, stream, or lake. Conversely, when groundwater levels are low, water may flow in the opposite direction—from surface streams and lakes into the shallow aquifer. Sometimes freshwater exists deep underground in confined aquifers, where the water-bearing aquifer is confined below a stratum of low permeability (e.g., cavities under the clay layer) (Figure 5). A confined aquifer can sometimes hold water under sufficient pressure, allowing water to rise above the confining layer when a tightly cased well penetrates the confining unit (think about how a water fountain works). These are known as artesian aquifers. When tapped, they sometimes produce free-flowing artesian wells. Naturally occurring springs also result from this same phenomenon (Figure 5).

Credit: USGS
Water can also enter aquifers through recharge zones where the water-bearing stratum emerges at the surface or where the confining layer is broken up by faults or natural sinkholes that allow downward infiltration of water (Figure 5). Note that recharge zones may be some distance away from the springs or wells that are fed by the aquifer.
Florida's Aquifers
Florida has several prolific aquifers (Figure 6) that yield large quantities of water to wells, streams, lakes, and springs (some of the largest in the world). The principal source of groundwater for most of the state is the Floridan Aquifer—the source of the municipal water supply in north and central Florida. It also yields water to thousands of domestic, industrial, and irrigation wells throughout the state.

Credit: FDEP
A shallow, non-artesian surficial aquifer is present across much of the state, but it is not an important source of groundwater in most areas because a better supply is available from deeper aquifers. However, in rural areas where residential water requirements are relatively smaller by comparison to other areas, this aquifer is tapped by small-diameter wells. The water in this shallow aquifer is derived primarily from local rainfall.
A non-artesian, sand-and-gravel aquifer is the major source of groundwater in the extreme western part of the Florida Panhandle. Water in the sand-and-gravel aquifer is derived chiefly from local rainfall and is of good chemical quality. Wells tapping this aquifer furnish most of the groundwater used in Escambia and Santa Rosa Counties, and part of Okaloosa County.
The non-artesian Biscayne aquifer underlies an area of about 3,000 square miles in Miami-Dade, Broward, and Palm Beach Counties on Florida's lower east coast. Water in the Biscayne aquifer is derived chiefly from local rainfall and, during dry periods, from canals ultimately linked to Lake Okeechobee. The Biscayne aquifer is an important water supply for the lower east coast Florida cities.
Thick layers of porous limestone of the Floridan aquifer underlie all of the state, and extends beyond the state boundaries, to Georgia, South Carolina, Alabama, and Mississippi. In south Florida, water from the Floridan aquifer is too highly mineralized (i.e., salty) to be usable. Water in the Floridan aquifer is replenished by rainfall in north and central Florida (as well as in south Georgia and south Alabama), where the aquifer emerges at the surface or is covered by permeable materials, or where the confining material is broken up by sinkholes. In these areas, it is especially important to exercise appropriate practices when gardening, managing septic systems, or growing agricultural crops. These practices can directly impact the quality of water in the aquifer, and hence, the quality of water withdrawn for drinking and other purposes, and the quality of water in the springs fed by the aquifer system.
For more information about Florida aquifers, see FDEP (2015). You can learn more about Florida's aquifer system by watching videos collected at the U.S. Geological Service website (https://fl.water.usgs.gov/floridan/visual_gallery.html).
Florida's Springs
Except those areas where its limestone formations break the surface of the ground, the Floridan aquifer underlies several hundred feet of sediment, including thick beds of relatively impermeable material that restrict upward movement of the water (Marella and Berndt 2005). This restriction causes the aquifer to have artesian pressure and make the water move through the openings in impermeable layers creating springs (Figure 7). In Florida, there are over 1,000 springs, including more than 30 first-magnitude springs with an average flow of over 100 cubic feet per second (64.6 million gallons per day) (Knight 2017). Spring water emerges from cavities in the porous limestone of the Floridan aquifer, and often contributes to the flow or level of water in streams and lakes. The springs depend upon the same resources from which we withdraw water for public water supplies, private water wells, and agricultural production. Increases in water withdrawals for any purpose also reduces spring flows. The Chinese proverb 'when you drink water, remember the spring' applies to Florida literally.

Credit: Sally Lanigan, UF/IFAS
Saltwater Intrusion
Florida's geography as a peninsula between two bodies of saltwater creates the potential for saltwater intrusion into the aquifers (i.e., into the fresh groundwater supply). Saltwater is denser than freshwater and exerts a constant pressure to permeate the porous aquifers. As long as freshwater levels in the aquifers are above sea level, the freshwater pressure keeps saltwater from moving inland and upward into the aquifers. For example, the level of water flowing through south Florida's coastal canals is generally several feet above sea level, which is enough to prevent ocean water from moving inland and upward into the aquifer. However, if during dry periods, the freshwater levels in canals without locks and dams fall to or below sea level, saltwater would move upward in the canals.
In some places, excessively pumping a well can increase saltwater intrusion. If water is pumped at a rate faster than the aquifer is replenished, the pressure of freshwater over saltwater in the land mass is decreased. This decrease may cause the level of the saltwater-freshwater interface to rise in the aquifer, degrading water quality. This problem must be controlled by careful attention to well location and pumping rates. The problem of saltwater intrusion is aggravated by drought periods when there is not enough rainfall to replenish the freshwater aquifers.
Runoff
Runoff is water that does not enter the ground but collects in rivers, streams, canals, or lakes. This water evaporates, percolates into the ground, or flows out to the ocean. In turn, groundwater can run close to the surface and then discharge to feed springs, streams, rivers, or lakes. Note that surface runoff, as well as groundwater infiltration and discharge rates, depend upon land use, soils, and weather conditions. With population growth and related changes in land use, we significantly alter the relationship between the rainfall volume that runs off the land and the volume that recharges the aquifers. Increases in the area covered with impermeable surfaces, such as roads, driveways, and houses, can decrease the rate of aquifer recharge while increasing the volume of runoff. Increased runoff volumes can potentially impact the quality of water in rivers, lakes, and canals because runoff can carry a variety of pollutants. Indeed, as Alan Levere, Connecticut Department for Environmental Protection, stated, "A river is the report card for its watershed."
In Florida, surface runoff and groundwater discharge feed more than 1,700 streams and rivers (FDEP 2016). Of Florida's five largest streams, four are in the drainage basins of north Florida: Apalachicola, Suwannee, Choctawhatchee, and Escambia Rivers (Figure 8). The fifth largest stream is the St. Johns River, which flows north from its headwaters near Vero Beach to its mouth at the Atlantic Ocean in Jacksonville.

Credit: USGS
The largest of Florida's streams by volume of water (i.e., discharge flow) is the Apalachicola River, which flows south from its headwaters north of Atlanta, Georgia, past the confluence of the Flint and Chattahoochee Rivers at the Georgia-Florida line. The Apalachicola River drains 17,200 square miles in Alabama and Georgia, and 2,400 square miles in Florida. From 1978 to 2012, mean discharge of the Apalachicola River at Sumatra, Florida (midpoint of river length in Florida) was 24,000 cubic feet per second (or 15 billion gallons per day), with a variation between approximately 10,000 and 37,000 cubic feet per second (or from 6 billion to 24 billion gallons per day) (USGS 2014a). Despite the fact that the river carries significant volumes of water, the need for water is ever growing due to population growth in all three states. Since the 1990s, the three states have argued over the amount of water each of the states should receive from the river system (priorities: Georgia, Atlanta public water use; Alabama, agricultural irrigation; and Florida, freshwater oyster production in Apalachicola Bay). In other words, wise management and allocation of water is very important.
The Suwannee River (Florida's second-largest river by volume of discharge) drains about 11,000 square miles from its headwaters in Okefenokee Swamp in south Georgia to its mouth at the Gulf of Mexico. At the measuring station in Wilcox, Florida (33 miles north of the Gulf of Mexico), the Suwannee River discharges about 10,000 cubic feet per second (6 billion gallons per day, average for 1930–2013). The variation is between 3,000 and 25,000 cubic feet per second (or from 2 billion to 16 billion gallons per day) (USGS 2014b). The Santa Fe River flows into the Suwannee River, as do several springs, such as Troy, Ichetucknee, Fanning, and Manatee.
The Choctawhatchee River (Florida's third-largest river by volume of discharge) drains 3,100 square miles in southeast Alabama and 1,500 square miles in northwest Florida (the Panhandle). Choctawhatchee Bay opens to the Gulf of Mexico in the vicinities of Fort Walton Beach and Niceville. At the measurement station near Bruce, Florida, 21 miles above the Choctawhatchee River's mouth, average discharge is about 7,000 cubic feet per second (more than 4 billion gallons per day, average for 1931–2013). The variation is between 3,000 and 12,000 cubic feet per second (or from 2 billion to 8 billion gallons per day) (USGS 2014c).
The Escambia River and its tributaries drain 3,760 square miles in Alabama and 425 square miles in northwest Florida before flowing into Pensacola Bay at a rate of almost 7,000 cubic feet per second (more than 4 billion gallons per day, measured near Molino, Florida, in 1988–2013) (USGS 2014d).
Of Florida's five largest rivers, only the St. Johns River is entirely within the borders of the state. Managing the flow or quality of water in the other four largest rivers in Florida requires coordinating efforts with other states. The St. Johns River drains about 9,400 square miles from marshes west of Vero Beach to its mouth at the Atlantic Ocean in Jacksonville. It is one of only a few U.S. rivers that flows north. At its mouth near Jacksonville, flow is about 7,000 cubic feet per second (more than 4 billion million gallons per day, an average for 1970–2011) (USGS 2014e). The St. Johns River connects seven major lakes, from Lake Washington to Lake George. Its tributary, the Ocklawaha River, connects nine lakes, from Lake Apopka to Lake Lochloosa.
Other significant streams include the Kissimmee River (with headwaters near Orlando, flowing south and emptying into Lake Okeechobee in the center of the state); the Peace River (flows into Charlotte Harbor), and the Withlacoochee River (flowing to the northwest from the Green Swamp in central Florida and emptying into the Gulf of Mexico near Yankeetown). In addition, the St. Lucie Canal connects Lake Okeechobee to the Atlantic Ocean on the east coast near Stuart, and the Caloosahatchee Canal connects Lake Okeechobee to the Gulf of Mexico on the west coast near Fort Myers. Together, these two canals form a navigable cross-state waterway. Other canals from Lake Okeechobee to the Atlantic Ocean are the Hillsboro, North New River, Miami, and West Palm Beach Canals (Fernald and Purdum 1998).
In addition to the rivers, Florida has more than 7,700 lakes, with the largest lake, Lake Okeechobee, being in the top 10 largest lakes in surface areas in the United States (467,200 acres) (Fernald and Purdum 1998; FDEP 2016). Florida also has many types of wetlands, including the Everglades (south Florida) and Green Swamp (central Florida), which provide habitats for a variety of plants and wildlife, and serve as groundwater recharge areas.
Overall, the streams, rivers, springs, lakes, and wetlands produced by the runoff phase of Florida's hydrologic cycle are familiar to Floridians as water supply sources, recreational attractions, transportation routes, and havens for the state's abundant fish and wildlife populations.
Evapotranspiration
An additional stage of the hydrologic cycle is evapotranspiration. Evapotranspiration is a combined process of evaporation from surfaces and transpiration through plant leaves (Irmak and Haman 2021). Generally, evaporation is the process by which water is changed into its gaseous form (water vapor). Part of the rainfall evaporates from the land surface back to the atmosphere. The potential for evaporation from an area depends upon atmospheric conditions such as temperature and wind speed. Evaporation is also affected by factors such as soil permeability, the type and amount of vegetative ground cover, and slope of the land. For example, evaporation is relatively low in parts of northwest Florida. This area is well drained and, compared with other parts of Florida, has steep slopes. Much of the area is covered by permeable soils that readily pass rainfall into a shallow aquifer. An impermeable ground layer underlying the shallow aquifer in this area ensures that most of the rainfall appears in streams. Conversely, for portions of extreme south Florida, where topography is flat and drainage is poor, water is readily available for evaporation.
In turn, transpiration is the process whereby moisture in plants is returned to the atmosphere through plant leaves. Many plants rely on rainfall that infiltrates the soil from the surface for moisture.
Water deficiency exists when potential evapotranspiration (i.e., evaporation plus moisture demand by plants) exceeds actual evapotranspiration (i.e., soil moisture that is actually available for evaporation and for plant use). Monthly climatic water budgets indicate that in Key West, water deficiency persists throughout the year; in the Panhandle, water deficiencies rarely occur; and in the rest of the state, water deficiencies are common in winter and spring.
Conclusions
The hydrologic water cycle is a useful way to describe and categorize Florida's water resources. The cost and feasibility of making water supplies available for municipal, agricultural, and industrial uses is determined to a great extent by the water cycle patterns of rainfall, runoff, and infiltration over time and space.
It is important to remember that while Florida receives significant rainfall every year, most of this water is returned to the environment through evapotranspiration and outflow of the rivers. Only a very small percent infiltrates into the ground to replenish the underground freshwater reservoirs/aquifers that we all depend upon for drinking water. Everyone should be aware that increasing water withdrawals from aquifers for human needs reduces the amount of water available to feed the springs, rivers, and wetlands not only now, but for years to come.
References
Chesnes, M. 2021. Florida Surpasses Grim Milestone of 1,000 Manatee Deaths in 2021, Starvation a Large Factor. Treasure Coast Newspapers, November 17, 2021. https://www.usatoday.com/story/news/nation/2021/11/17/florida-manatee-deaths-2021-starving-seagrass-loss/8654284002/.
Fernald E.A., and E.D. Purdum (editors). 1998. Water Atlas of Florida. Tallahassee, FL: FSU/ISPA.
Florida Climate Center. 2017a. Precipitation. Tallahassee, FL: Florida Climate Center. http://climatecenter.fsu.edu/products-services/data/statewide-averages/precipitation
Florida Climate Center. 2017b. Hurricanes. Tallahassee, FL: Florida Climate Center. http://climatecenter.fsu.edu/topics/hurricanes
Florida Department of Environmental Protection (FDEP). 2015. Aquifers. Tallahassee, FL: FDEP. https://prodlamp.dep.state.fl.us/swapp/Welcome/links/aquifers_v
Florida Department of Environmental Protection (FDEP). 2016. Final Integrated Water Quality Assessment for Florida: 2016 Section 303(d), 305(b), and 314 Report and Listing Update. Tallahassee, FL: FDEP.
Florida Fish and Wildlife Conservation Commission (FFWCC). 2021. Manatee Mortality Statistics. Tallahassee, FL: FFWC. https://myfwc.com/research/manatee/rescue-mortality-response/statistics/mortality/
Irmak S., and D.Z. Haman. 2021. Evapotranspiration: Potential or Reference? EDIS #AE256. Gainesville, FL: UF/IFAS Extension. https://edis.ifas.ufl.edu/ae256
Knight, R. 2017. Florida: Land of 1,000 Springs. High Springs, FL: Florida Springs Institute. https://floridasprings.org/
Marella, R.L., and M.P. Berndt. 2005. Water Withdrawals and Trends from the Floridan Aquifer System in the Southeastern United States, 1950–2000. Reston, VA: US Geological Survey (USGS).
National Oceanic and Atmospheric Association, National Centers for Environmental Information (NOAA/NCEI). 2017. National Centers for Environmental Information, Climate at a Glance: U.S. Time Series. Asheville, NC: NOAA/NCEI. http://www.ncdc.noaa.gov/cag/
National Oceanic and Atmospheric Association, National Centers for Environmental Information (NOAA/NCEI). 2014. Extremes in U.S. Climate. Asheville, NC: NOAA/NCEI. https://www.ncdc.noaa.gov/climate-monitoring/
OSU/PRISM. 2014. Florida Average Annual Precipitation, 1981–2010. Corvalis, OR: PRISM Climate Group, Oregon State University.
Rice, D. 2017. Move over, California: Florida has the USA's worst drought. USA Today, May 5. https://www.usatoday.com/story/weather/2017/05/05/move-over-california-florida-has-usas-worst-drought/101331462/
United States Geological Service (USGS). 2016a. Water-Use in Florida. Reston, VA: USGS. https://fl.water.usgs.gov/infodata/wateruse.html
United States Geological Service (USGS). 2016b. The Water Cycle – USGS Water Science School: Springs – The Water Cycle. Reston, VA: USGS. https://water.usgs.gov/edu/watercyclesprings.html
United States Geological Service (USGS). 2014a. Surface-Water Annual Statistics for Florida. USGS 02359170 Apalachicola River near Sumatra, Florida. Reston, VA: USGS. http://waterdata.usgs.gov/fl/nwis/annual/?referred_module=sw&site_no=02359170&por_02359170_1=2396790,00060,1,1978,2014&year_type=C&format=html_table&date_format=YYYY-MM-DD&rdb_compression=file&submitted_form=parameter_selection_list
United States Geological Service (USGS). 2014b. Surface-Water Annual Statistics for Florida. USGS 02323500 Suwannee River near Wilcox, Florida. Reston, VA: USGS. http://waterdata.usgs.gov/nwis/annual?site_no=02323500&agency_cd=USGS&por_02323500_7=2396494,00060,7,1931,2013&year_type=W&referred_module=sw&format=rdb
United States Geological Service (USGS). 2014c. Surface-Water Annual Statistics for Florida. USGS 02366500 Choctawhatchee River near Bruce, Florida. Reston, VA: USGS. http://waterdata.usgs.gov/fl/nwis/annual?site_no=02366500&agency_cd=USGS&por_02366500_2=2396875,00060,2,1931,2014&year_type=W&referred_module=sw&format=rdb
United States Geological Service (USGS). 2014d. Surface-Water Annual Statistics for Florida. 02376033 Escambia River near Molino, Florida. Reston, VA: USGS. http://waterdata.usgs.gov/fl/nwis/annual?site_no=02376033&agency_cd=USGS&por_02376033_1=2396992,00060,1,1984,2014&year_type=W&referred_module=sw&format=rdb
United States Geological Service (USGS). 2014e. Surface-Water Annual Statistics for Florida. USGS 02246500 St. Johns River at Jacksonville, Florida. Reston, VA: USGS. http://waterdata.usgs.gov/fl/nwis/dv?cb_00060=on&format=rdb&site_no=02246500&referred_module=sw&period=&begin_date=1971-10-01&end_date=2014-11-02
United States Geological Service (USGS). 2007. EDNA Derived Watersheds for Major Named Rivers. KML Watershed Index. Reston, VA: USGS. http://edna.usgs.gov/watersheds/kml_index.htm
University of Florida Institute of Food and Agricultural Science, Center for Public Issues Education (UF/IFAS PIE Center). 2016. Water Quantity & Quality. Gainesville, FL: UF/IFAS PIE Center. http://www.piecenter.com/issues/water/water/