Small-to-Medium-Scale Sensory Evaluation of Horticultural Crops: Sensory Testing Methods
Introduction
Of the 154 hop cultivars used by US craft brewers in 2018, up from 88 in 2009, ‘Cascade’ is one of the most popular of all time. Developed in the 1950s by Jack Horner of Oregon State University and released in 1972, it now accounts for approximately 10% of US hop production (Brewers Association 2019; Hopslist 2018). Once a cultivar or product has established a reputation, it becomes important to protect the integrity of that reputation. However, the final quality of horticultural crops like cannabis and hops is highly subjective to growing conditions, so ensuring production and distribution of a consistent product requires careful testing.
This publication is fourth in a series designed to assist small-to-medium-sized producers in the sensory evaluation of their horticultural crops, summarizing the discrimination and preference sensory testing methods available, with the guidelines outlined in this publication taken from the 2nd edition of Sensory Evaluation of Food: Principles and Practices (Lawless and Heymann 2010).
Discrimination Testing
During production of consumer goods like those containing hops or cannabis, it can become necessary to make supply chain substitutions due to changes in ingredient quality, logistical interruptions, changes to product formulation, or other factors. This practice is common in orange juice production, where juice from various sources is often mixed by the manufacturer to compensate for the inconsistency of orange harvests and achieve a uniform product ("Orange Juice" 2020). At the same time, brand integrity requires that producers create a product that consistently tastes, smells, and feels the same while meeting the producers’ and consumers’ expectations of quality. Because producers want a uniform consumer experience, discrimination testing determines if two products are perceptively different from each other and help producers determine if it is safe to make alterations at a lowered risk. The triangle and duo-trio tests are used to determine if panelists can discern between samples, but without any indication of which attributes differ or in which direction.
Triangle Test
In the triangle test, panelists are given three coded samples, two of the same product (A or B) and one that is different. With six possible serving orders (ABB, BAB, BBA, BAA, ABA, AAB), they should be balanced so each order is served to an equal number of panelists. Panelists can then be asked to identify either the odd sample or the two that are similar; for consistency with the literature, this publication will have panelists identify the odd sample (Figure 1). This is especially important when reusing panelists; changing the testing format can cause panelists to become confused, corrupting results. The number of panelists that correctly identify the odd sample should then be counted and recorded for statistical analysis. At least 5 and 7 panelists are needed at the a = 0.05 and a = 0.01 confidence levels, respectively, in order to get accurate results, but operators should strive for 50+ for better results.
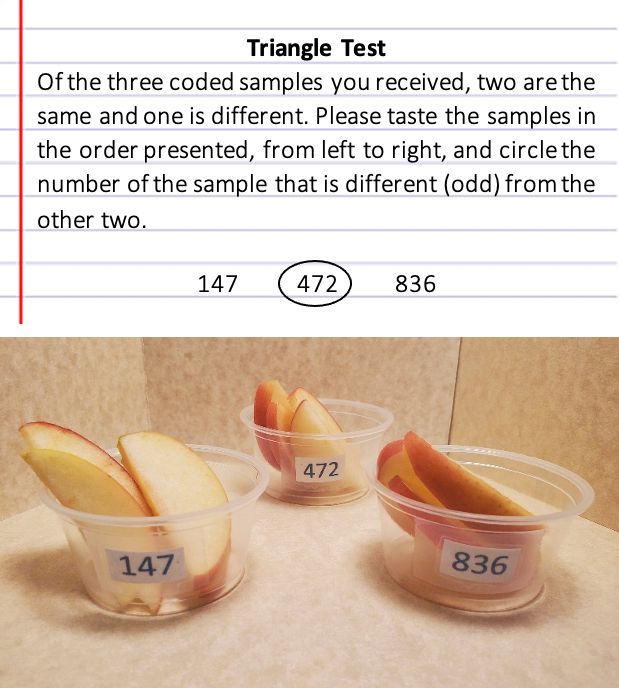
Credit: Sean M. Campbell, UF/IFAS
Duo-Trio Test
Panelists also receive three samples for the duo-trio test, but this time one is a marked reference, one is a coded sample matching the reference, and the third is different. Upon evaluating the three samples, panelists are asked to pick the coded sample that is most similar to the reference (Figure 2). There are two forms of the duo-trio test: constant reference, where all panelists receive the same product as the reference, and balanced reference, where half of panelists receive product A as the reference and the other half receive product B.
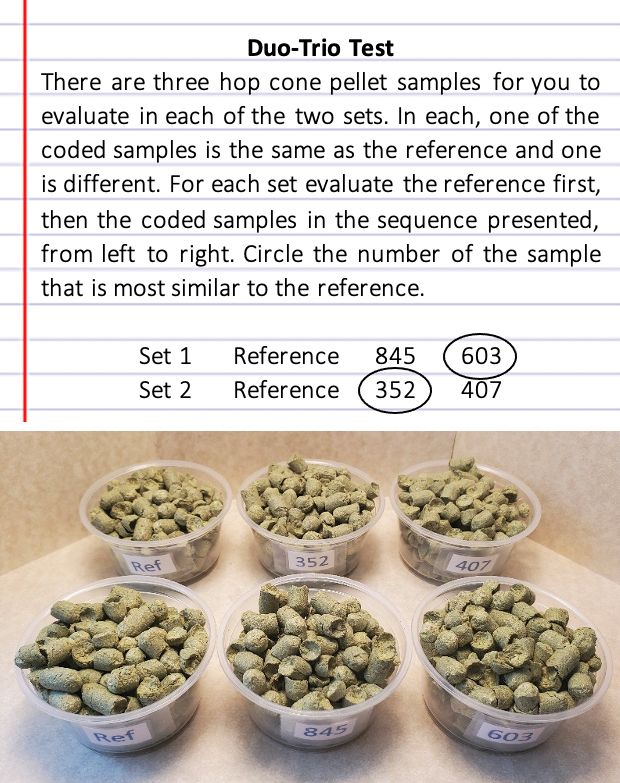
Credit: Sean M. Campbell, UF/IFAS
While the forms are identical from the panelists’ perspective, the constant-reference duo-trio tends to be more sensitive, especially when panelists have had prior experience with the product being tested. If testing a new product B against an existing product A that panelists are familiar with, using a constant-reference duo-trio with product A as the reference would yield the best results. Two serving orders exist for constant reference (RA AB, RA BA) and should be balanced across all panelists. With the balanced-reference duo-trio test, half of the panelists receive product A as the reference and the other half receive product B (RA AB, RA BA, RB AB, RB BA). Balanced reference is preferable when both products are unfamiliar to panelists or when there is not enough of the familiar product for a constant reference.
Directional Paired Comparison
After establishing that panelists are able to detect a difference between two samples using the triangle or duo-trio tests, directional paired comparison, also called the two-alternative forced choice (2-AFC), involves asking panelists how samples differ based on a single sensory attribute. This is more powerful, or accurate, than if the operator does not know which attribute(s) differ.
A series of sensory attributes can be used for comparison, including appearance, odor/aroma, texture/consistency, and flavor. The first publication in this series, ENH1315, Small-to-Medium-Scale Sensory Evaluation of Horticultural Crops—Sensory Attributes (https://edis.ifas.ufl.edu/ep579), lists these attributes in more detail. It is important that the samples only differ in one attribute, because changing one parameter can often affect others. For instance, a longer drying time for hemp flower might result in a more intact terpene profile and a better odor/aroma and flavor but could negatively affect physical characteristics like appearance and texture/consistency. If more than one sensory attribute differs, a more appropriate discrimination test should be used.
Samples should be arranged in two paired comparison sets, with each set containing one of product A and one of product B. This means that there are two possible serving sequences, AB and BA, and they should be randomized so that an equal number of panelists receive either product A or product B first. Panelists should be familiar with the attribute being tested, with screening discussed in more detail in ENH1338, Small-to-Medium-Scale Sensory Evaluation of Horticultural Crops—Standard Sensory Practices (https://edis.ifas.ufl.edu/ep602). Panelists should evaluate all samples in set 1 fully in the order they were provided, working their way from left to right. Using the questionnaire (Figure 3), the panelist should then circle the number of the sample that has more of the attribute in question. Once set 1 is completed and a sample has been chosen, continue to set 2 and follow the same procedures.
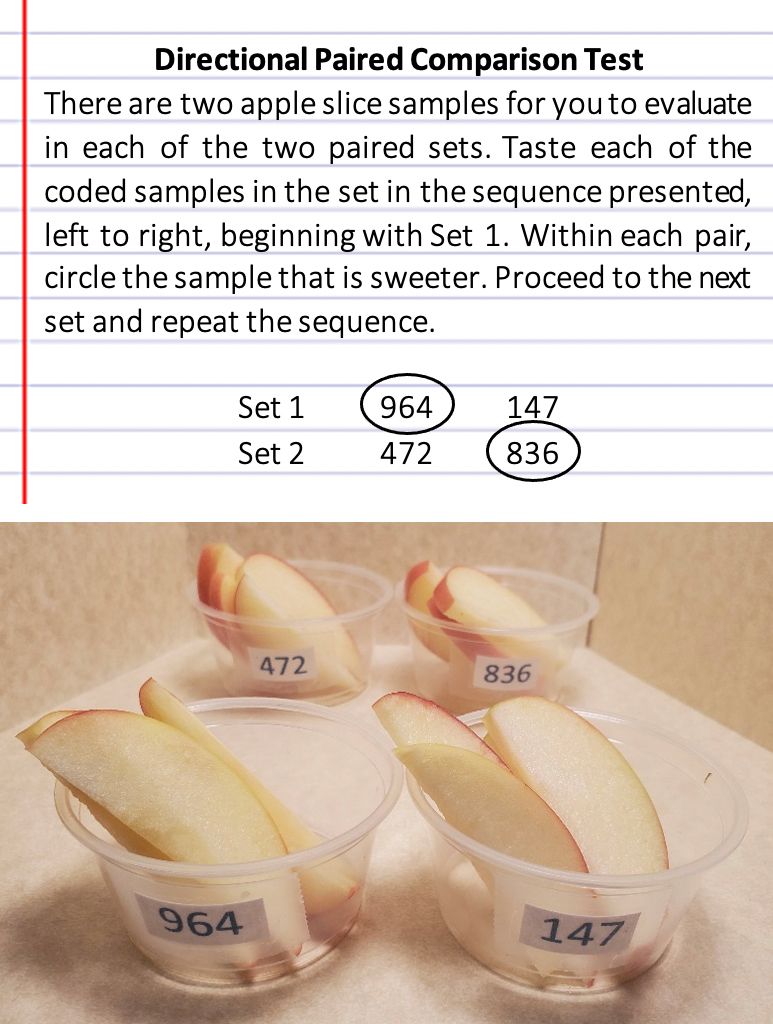
Credit: Sean M. Campbell, UF/IFAS
Statistical Analysis
Statistical analysis of the three discrimination tests relies on the principal of binomial distribution. When there are two potential outcomes to a problem, labeled “success” or “failure,” binomial distribution is used to determine whether the result of the panel was due to random chance or to an actual difference in samples. Before the availability of computers, this analysis was done by hand using the binomial formula, but since then tables have been published calculating the number of correct responses needed for a given confidence level and number of panelists. Appendices A, B, and C are from Lawless and Heymann (2010) and were originally adapted from the tables provided by Roessler et al. (1978).
Three pieces of information are necessary to use Appendices A and B; the probability confidence level (a), the total number of panelist responses (N), and the number of correct panelist responses needed for significance (X). At a = 0.05, this means there is a 95% confidence interval (1 - a) that the observed difference was due to an actual difference in the samples and not just random chance. At a = 0.01, the confidence interval is raised to 99%.
Interpreting the table, the total number of panelist responses (N) is found in the first column, followed by the number of correct panelist responses needed for significance (X) for the given confidence level (a). For example, a duo-trio test with 10 panelists responses (N = 10) would need 9 correct responses (X = 9) to be significant at a = 0.05 (Figure 4). A directional paired comparison with 40 panelists responses (N = 40) would need 28 correct responses (X = 28) to be significant at a = 0.01.
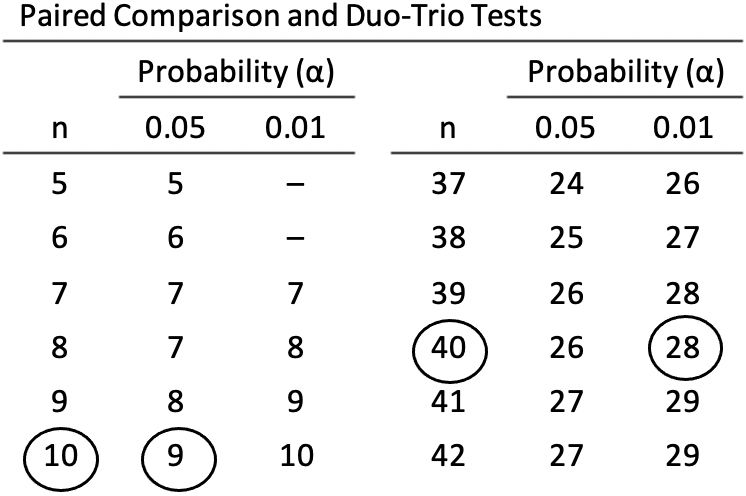
Credit: Lawless and Heymann (2010)
Preference Testing
Whereas discrimination testing asks panelists to give an objective assessment based on an attribute or similarity to a reference, preference testing asks panelists to subjectively select the sample they like best. When two samples are used, it is referred to as paired preference testing which is one of the oldest, simplest, and most popular forms of sensory testing. Paired tests are also effective because they mimic the average consumer buying experience, weighing alternatives before deciding on a product to buy. While effective at comparing two products, one problem with preference testing is it only indicates how the products compare to each other and not to the panelists’ other experiences.
Simple Paired Preference
Panelists for the simple paired preference test receive two coded samples and are asked to evaluate them in the order presented, from left to right, before circling the number of the sample that they preferred. With two possible serving orders (AB, BA), these should be evenly distributed among panelists so that an equal number of panelists receive product A or product B as their first sample.
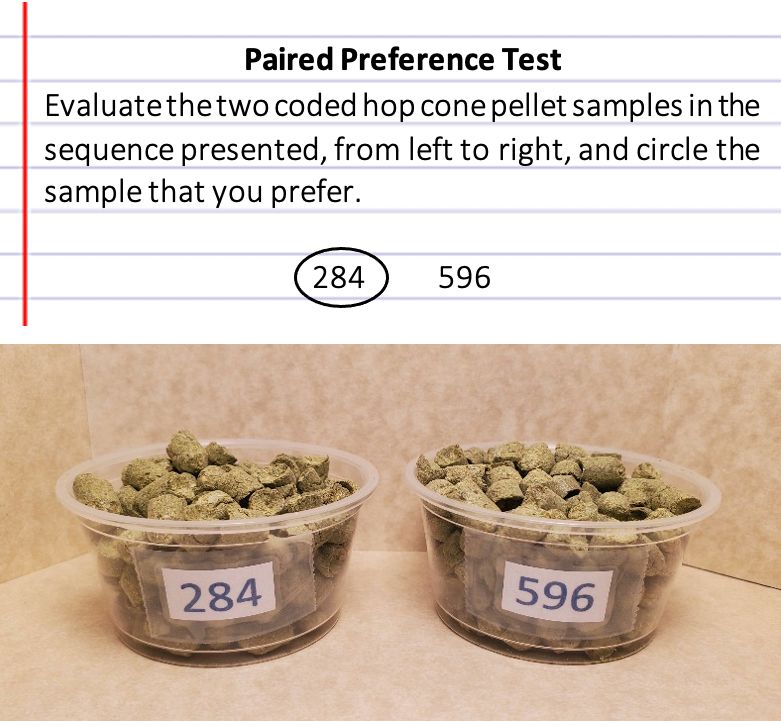
Credit: Sean M. Campbell, UF/IFAS
Statistical Analysis
Analysis of the simple paired preference test is similar to discrimination tests (Figure 4). Using a table adapted from Roessler et al. (1978), the number of correct panelist responses needed for significance (X) can be found for the corresponding total number of panelist responses (N) obtained (Appendix C). Unlike discrimination testing which can be performed at the both the a = 0.05 and a = 0.01 confidence levels, Appendix C only works for a = 0.05, and a minimum of 20 panelist responses should be used for sufficient accuracy.
Consider this example: A simple paired preference test was run with 100 panelists (N = 100), and 63 of them preferred product B. Appendix C shows that 61 responses are needed for significance (X = 61), and therefore it can be concluded that the consumers significantly prefer product B over A. Conversely, if the test was run with 50 panelists (N = 50) and only 29 preferred product A, this is less than the 33 needed for significance (X = 33), and therefore it cannot be concluded that product A is significantly preferred over product B.
Conclusion
Using the testing methods described in this publication, producers of consumer goods containing horticultural crops can determine if it is safe to make alterations to their products at a lowered risk, ensuring their customers a uniform experience with a good-quality product that consistently tastes, smells, and feels the same. Discrimination testing is used to determine if two products are perceptively different from each other. The triangle and duo-trio tests are used to determine if panelists can discern between multiple samples, but without any indication of the difference or in which direction, while the slightly more powerful directional paired comparison involves asking panelists how samples differ based on perception of a single sensory attribute.
Alternatively, preference testing asks panelists to subjectively select the sample they like best. Paired preference tests using two samples are especially effective because they mimic the average consumer buying experience, and they are one of the oldest, simplest, and most popular forms of sensory testing utilized. While effective, preference tests only indicate how products compare to each other and not to the panelists’ other experiences. Combined with the principles and methodologies covered in the previous three publications within the Small-to-Medium-Scale Sensory Evaluation of Horticultural Crops series, the testing methods outlined should be used to assist small-to-medium-sized producers in conducting sensory evaluation to gain better understanding of their products and the people that consume them.
Literature Cited
Brewers Association. 2019. “Brewers Association 2019 Hop Industry Update.” https://www.usahops.org/cabinet/data/Hop%20survey%20Presentation.pdf
Healey, J. 2018. “Cascade (US).” Hopslist. http://www.hopslist.com/hops/dual-purpose-hops/cascade-us/
Lawless, H. T., and H. Heymann. 2010. Sensory Evaluation of Food: Principles and Practices. New York: Springer. https://doi.org/10.1007/978-1-4419-6488-5_3
“Orange Juice.” 2020. How Products Are Made. http://www.madehow.com/Volume-4/Orange-Juice.html
Roessler, E. B., R. M. Pangborn, J. L. Sidel, and H. Stone. 1978. “Expanded Statistical Tables for Estimating Significance in Paired-Preference, Paired-Difference, Duo-Trio and Triangle Tests.” Journal of Food Science 43 (3): 940–943. https://doi.org/10.1111/j.1365-2621.1978.tb02458.x