A Review of Strawberry Production and Price Trends from 2010 to 2022
Acknowledgments
This work is supported by the USDA National Institute of Food and Agriculture, Specialty Crops Research Initiative project award 2019-51181-30010 and the Multi-State Hatch FL-SWF-005724, “Economic Valuation and Management of Natural Resources on Public and Private Lands (W5133).”
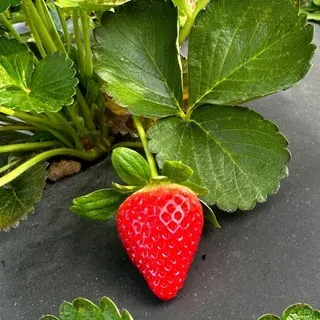
Credit: Wael Elwakil, UF/IFAS
Introduction
Strawberries are one of consumers’ favorite fruits, and most are consumed fresh (Damchack et al. 2017). In 2022, with an annual utilized production of 13.9 million tons, strawberries were the third most sold fruit in the United States, following grapes at 5.92 million tons and apples at 4.74 million tons (USDA-NASS 2023). Strawberries are grown in all states, but most of the crop is produced in California and Florida (USDA-ERS 2021; USDA-NASS, 2022). Most strawberries grown outside California and Florida are produced in New York, North Carolina, Oregon, and Washington (USDA-ERS 2021). In fact, the USDA National Agricultural Statistics Services (NASS) reports other states harvesting no strawberry acres from 2019–2022 (USDA-NASS 2023). In 2022, the USDA-NASS reported total production of 27.82 million hundredweight (cwt, 100 pounds) with California producing 89.1% and Florida producing 10.9%. Years 2020, 2021, and 2022 each saw one-year increases by almost 7%, 14%, and 20%, respectively (USDA-NASS 2022; USDA-NASS, 2023). In those years, Florida contributed about 10% of total production (USDA-NASS 2022; 2023).
California’s Mediterranean weather and moderate temperatures make it ideal for producing strawberries throughout the year, except for winter. Florida strawberries are planted in September and October and harvested in November through April or May (Huang et al. 2022; IFAS Extension 2021). Although Florida has a much shorter growing season than California (5 months versus 9 months), it is the main producer of US strawberries throughout the winter (Guan et al. 2020). Popular varieties grown in Florida in recent years include ‘Florida Brilliance’, Sweet Sensation®, Florida MedallionTM, Florida PearlTM, Florida FelicityTM, ‘Florida Beauty’, WinterstarTM, ‘Florida Radiance’, ‘Florida Elyana’, ‘Winter Dawn’, ‘Rubygem’, ‘Carmine’, ‘Strawberry Festival’, ‘Earlibrite’, ‘Rosa Linda’, ‘Sweet Charlie’, ‘Florida Belle’, ‘Dover’, and ‘Florida Ninety’ (UF/IFAS 2022).
This report provides information on conventional fresh strawberry acreage, volume, and pricing for California and Florida from 2010 through 2022. It is one of a series of EDIS publications that illustrate trends of Florida’s five most economically important specialty crops, excluding citrus: strawberries, bell peppers, tomatoes, watermelons, and sweet corn. This information is useful to producers, Extension agents, policymakers, academics, and others interested in trends concerning specialty crop commodities. Each of the publications in the series serves as a single location where valuable information about the market and production trends for that specialty crop can be found.
Data
Data on acres harvested, prices received, and the production value per acre for conventional strawberries were obtained from the US Department of Agriculture, National Agricultural Statistics Services (USDA-NASS). We average these data over the market year for prices and calendar year for production value and acres to illustrate trends in strawberry production and prices over time. To examine marketable strawberry volumes on a year-to-year basis, we assess the truck shipment (movement) data from the USDA’s Agriculture Marketing Service (USDA-AMS). Movement data describes the volume of strawberries transported domestically in 40,000-lb-capacity refrigerated trucks. These transportation data show movement across the interstate highway system from farms to distribution centers and to destinations for international shipments. Transportation data do not include strawberries transported via box trucks or by rail or other means because these modes account for a relatively small volume of domestic strawberry shipments. The volume shipped by 40,000-lb-capacity refrigerated trucks is therefore not equivalent to the volume of strawberries produced.
We assessed aggregated yearly data for strawberries from 2010 to 2022 in the top two producing states: California and Florida. The figures below compare trends in these states for the number of acres of conventional strawberries harvested, price per hundredweight (cwt, 100 pounds), value of production per acre, and volume of strawberries transported by 40,000-lb-capacity refrigerated trucks.
Harvested Acres
As the top strawberry producer, California averaged 38,366 acres per year over the 13-year period. Florida averaged 10,062 acres per year over the same period (Figure 2). In 2019, California reported its lowest number of acres harvested. This was due to a slow start to the season caused by rain in January and February, and some fields were abandoned because they were inaccessible to pickers (USDA-NASS 2020). California saw its largest year-to-year decline in acres (2,800 acres or 7%) from 2017 to 2018. Acres increased in recent years, with the 2021 value similar to those in 2010 and 2011. In 2022, California’s acreage peaked at 42,000 acres; this is 7,900 acres more than its low of 34,100 acres in 2019. Florida acres harvested were generally steady with a relatively large decline from 2015 to 2016 (1,400 acres or 13%). Additionally, in 2016 and 2017, Florida growers observed wet conditions in the early part of the season, which increased insect and disease issues (USDA-NASS 2017; 2018).
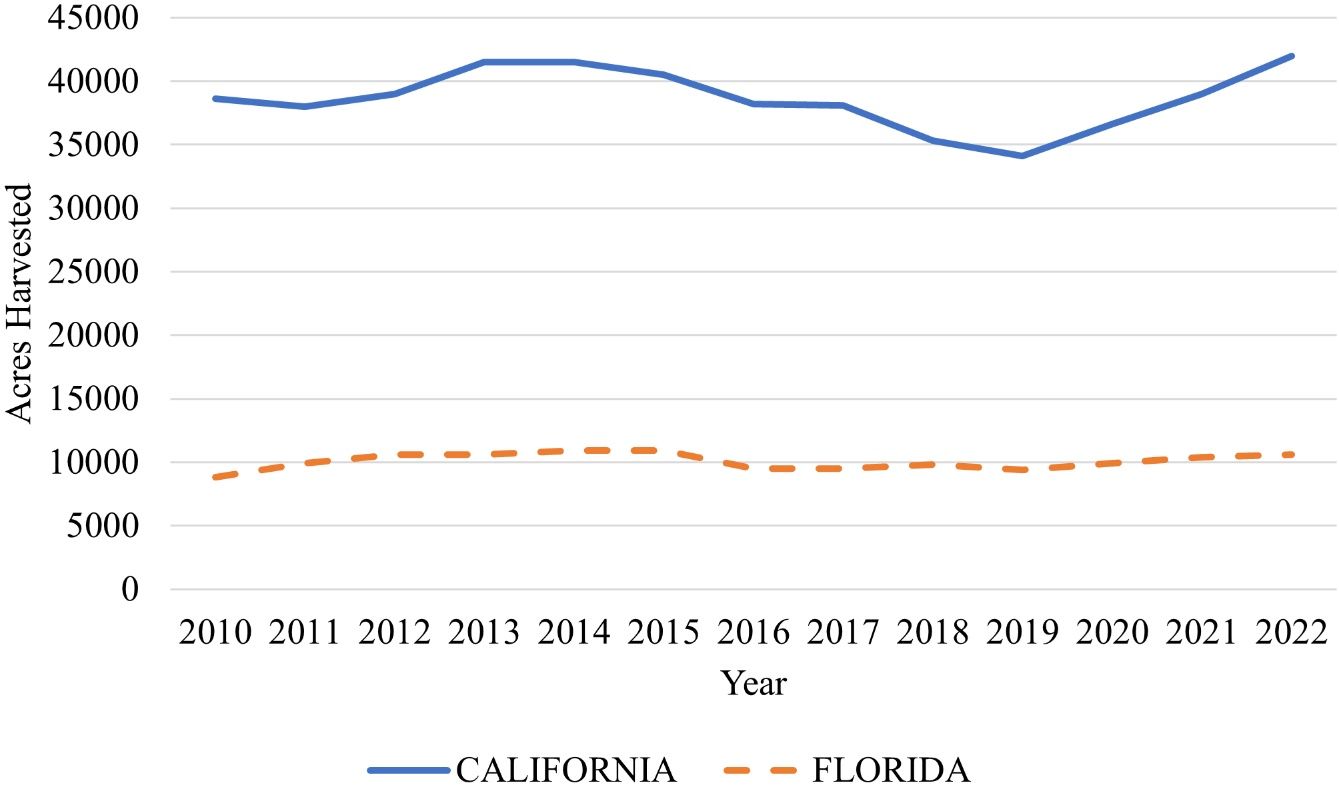
Credit: USDA-NASS
Price Trends
Figure 3 shows trends in prices received per cwt. Over the 13-year period, Florida and California averaged $145.85 per cwt and $91.68 per cwt, respectively. In 2012, Florida experienced its lowest price received, $110 per cwt, due to an increased supply of strawberries from Mexico (Wu et al. 2012). Florida’s highest price received was $187 per cwt in 2010, and California’s highest, $125 per cwt, was observed in 2021. The differences in production and market can explain some of the price variations received across states. That Florida is the largest producer of strawberries during the winter can account for the higher price the state enjoys compared to California (Bouffard 2016). Though they are not shown in the figure, we note that other top-producing states received a higher price per cwt compared to Florida. For example, in 2017 and 2018, North Carolina, a much smaller producer than California and Florida, averaged $168.5 per cwt (USDA-NASS 2020); this is $72.25 more than California and $41 more than Florida in the same years. However, North Carolina estimates for acres harvested, and prices are discontinued by the USDA-NASS after 2018; as a result, this report excludes trends from that state.
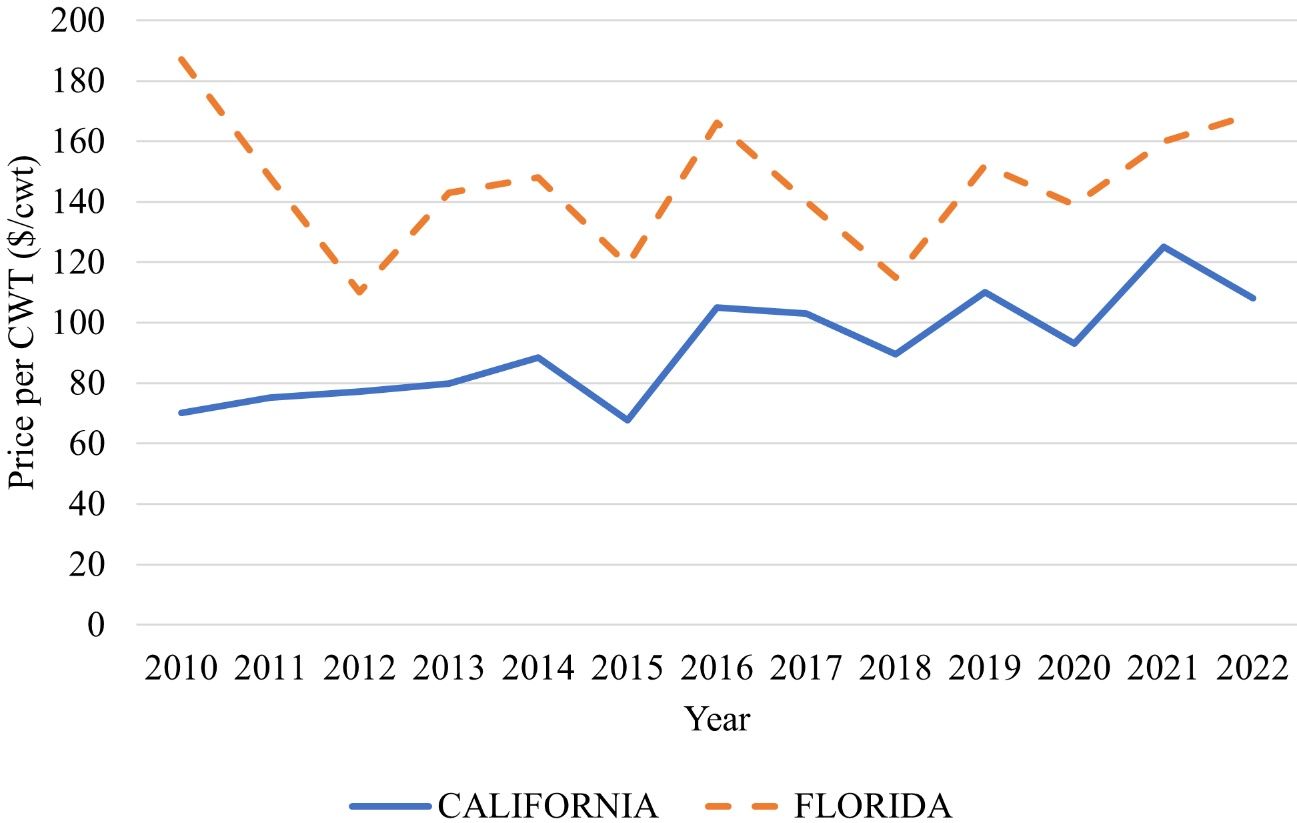
Credit: USDA-NASS
Value Per Acre
Figure 4 shows the value of production per acre. This is the yield per acre multiplied by the price of strawberries harvested from 2010 to 2022. With a farm-gate value of $300 million, the strawberries produced in Florida are a significant contributor to the state’s economy (Guan et al. 2020; USDA-NASS 2020). Though Florida experiences higher prices than California, overall, the per-acre value of production is higher in California. This is largely due to California having a longer growing season than Florida. On average, Florida makes $33,956 per acre per year, compared to California, which earns about 77% more, or $59,997 per acre per year. Florida’s highest value of production was $48,165 in 2022; this is $7,025 per acre per year more than the second-highest value observed in 2010. California observed relatively high values of production from 2016–2021, averaging at almost $67,000 per acre with the highest at $77,500 per acre in 2021.
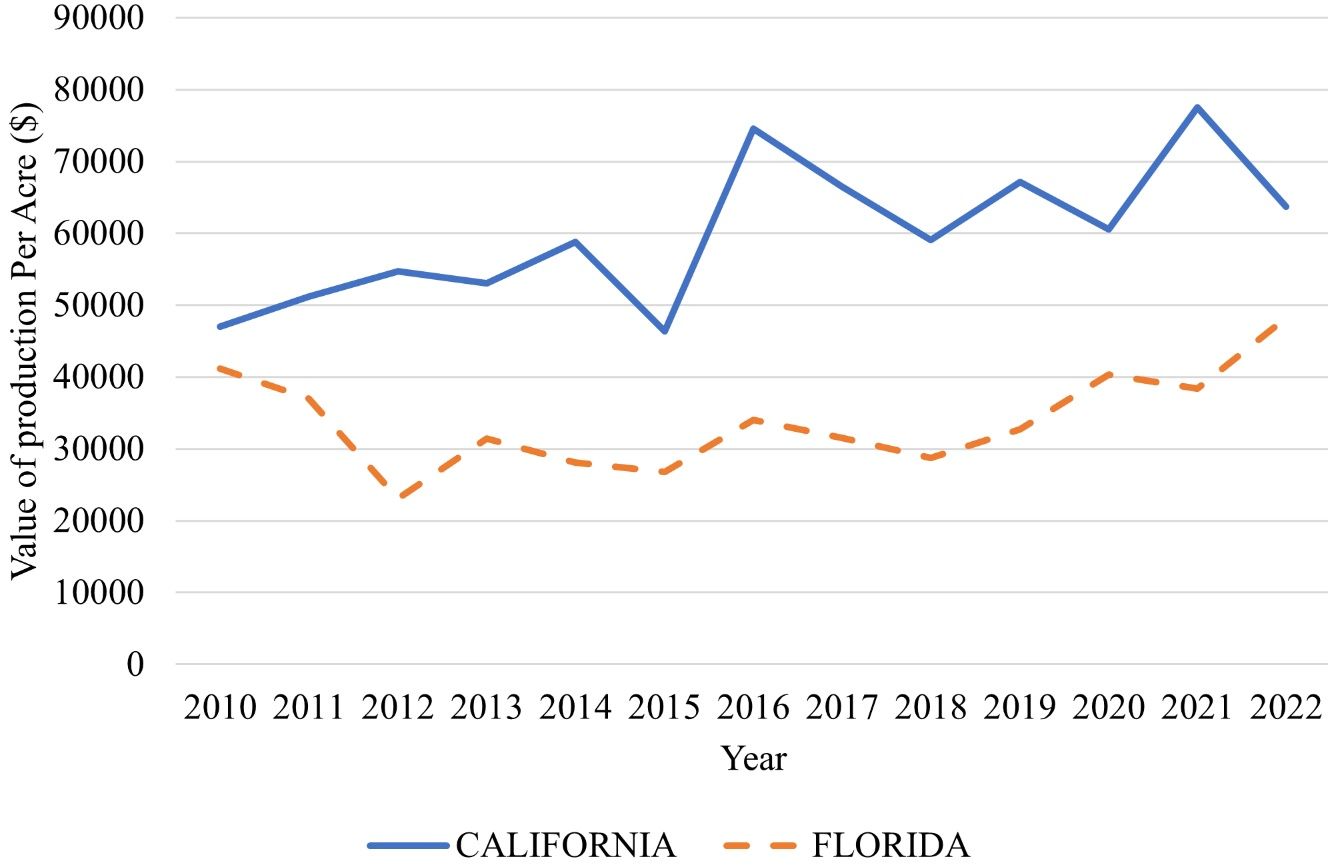
Credit: USDA-NASS
Volume Shipped
It is advised to transport strawberries in cool trailers at a temperature of 32 degrees Fahrenheit (Mitcham 1996). Overall, volumes of strawberries shipped from Florida were stable over the 13-year period with about 215.73 million lb. per year. The state saw increases in volume shipped in a few years with totals of 244.6 million lb. in 2013, 251.4 million lb. in 2017, and 252.8 million lb. in 2022 (Figure 5). In general, California saw an increasing trend in the volume of strawberries shipped over the past 13 years. In 2022, California experienced the highest volume shipped over the 13-year period at 1.74 billion lb.; this is 117.0 million lb. more than its second-highest volume shipped in 2018. This increase can be accredited to an increase in yields after farmers tried new varieties and reported favorable weather for most of the season (USDA-NASS 2019).
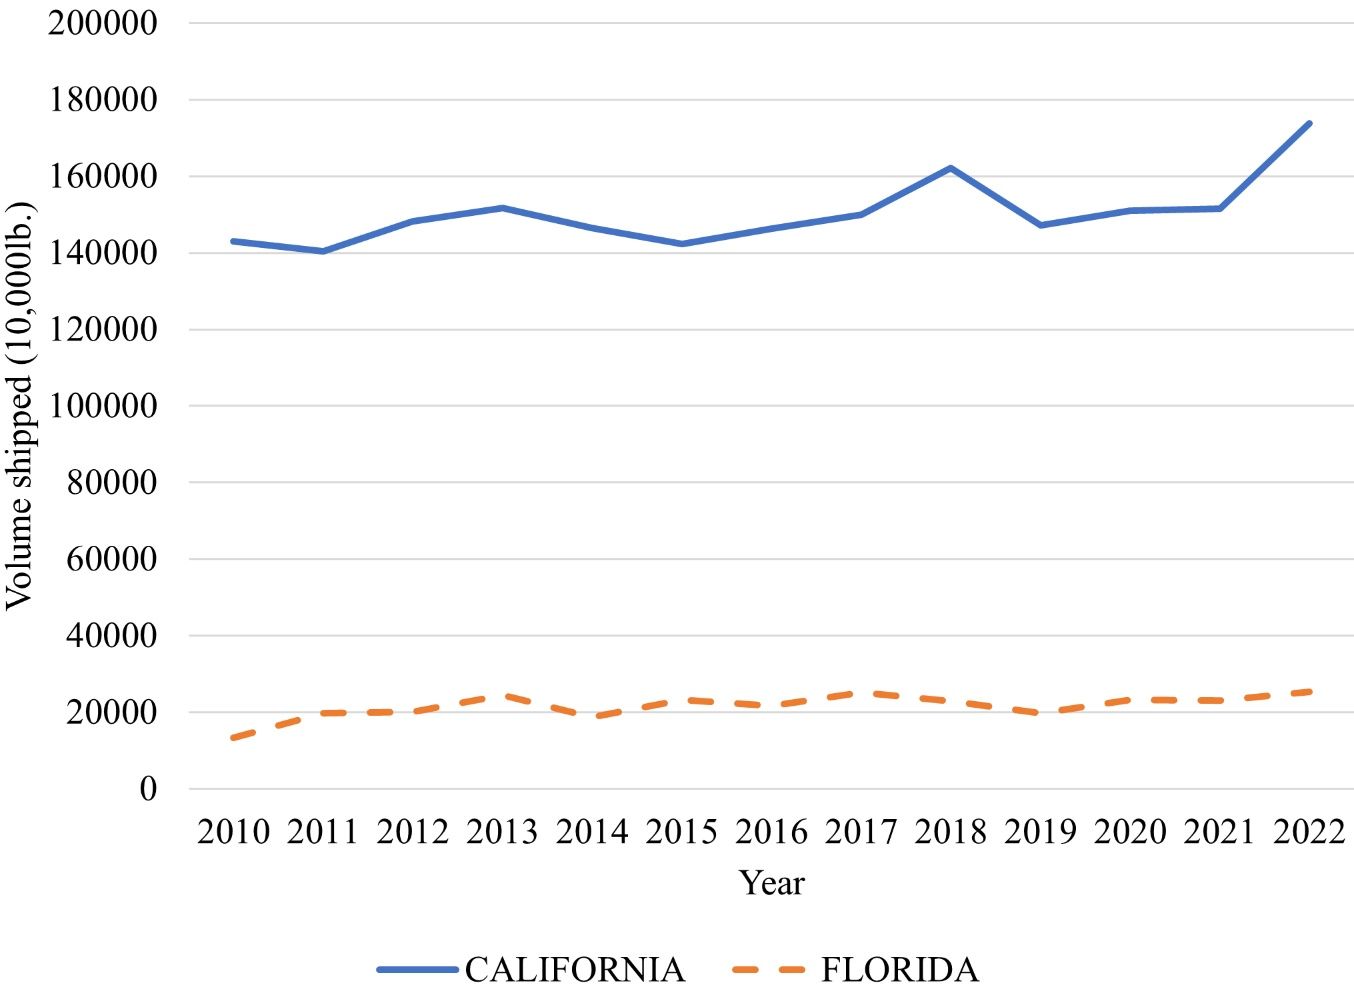
Credit: USDA-AMS
Summary
We provide trends in strawberry acres, production values, prices, and movement for Florida and California for the past 13 years. These data show that, in Florida, acres harvested remained steady, while California observed large shifts ranging from 34,100 acres in 2019 to 41,500 acres in 2012 and 2014. Florida’s growing season is five months long, almost half the length of the California growing season. This large difference means that California produces far more product than Florida; for example, California shipped 1.6 billion lb. of strawberries in 2018 and 1.7 billion lb. in 2022; this is seven times the volume Florida shipped in the same years. Florida receives higher prices for strawberries than California (56% higher, on average), but the higher prices are not enough for Florida to surpass California in terms of value of production per acre. Value of production has increased in recent years, with Florida showing values in 2022 that are comparable to 2010. If new varieties in Florida continue to be successful and prices continue an upward trend, Florida strawberry growers could see continued increases in value of production per acre.
References
Bouffard, K. 2016. “Why Strawberry Prices Stayed High, then Plunged.” Herald-Tribune. https://www.heraldtribune.com/story/news/2016/02/23/why-strawberry-prices-stayed-high-then-plunged/29336250007/
Damchack K., J. K. Harper, L. F. Kime, and W. Lantz. 2017. “Strawberry Production.” Agricultural Alternatives, Penn State Extension.
Davis, T. M., B. Denoyes-Rothan, and E. Lerceteau-Köhler. 2007. “Strawberry.” In Fruits and Nuts. Genome Mapping and Molecular Breeding in Plants, vol 4., edited by C. Kole. Springer, Berlin, Heidelberg. https://doi.org/10.1007/978-3-540-34533-6_8
Guan, Z., F. Wu, and A. Whidden. 2020. Florida Strawberry Production Cost and Trends. FE1013. Gainesville: University of Florida Institute of Food and Agricultural Sciences. https://edis.ifas.ufl.edu/publication/FE1013
Huang, K. M., Guan, Z., and Hammami. 2022. “The US Fresh Fruit and Vegetable Industry: An Overview of Production and Trade.” Agriculture 12 (10): 1719. https://doi.org/10.3390/agriculture12101719
Mitcham, B. 1996. “Quality Assurance for Strawberries: A Case Study.” Perishables Handling Newsletter 85 (6): 6–8.
UF/IFAS (University of Florida, Institute of Food and Agriculture Sciences Extension). 2021. https://sfyl.ifas.ufl.edu/lawn-and-garden/growing-strawberries/
UF/IFAS (University of Florida, Institute of Food and Agriculture Sciences Extension.) 2022. UF/IFAS Strawberry Varieties. Available at https://gcrec.ifas.ufl.edu/fruit-crops/strawberries/ufifas-strawberry-varieties/
USDA-ERS (United States Department of Agriculture, Economic Research Service). 2021. U.S. Fresh Strawberry Expands with new varieties. USDA-ERS, Washington, DC. https://www.ers.usda.gov/data-products/chart-gallery/gallery/chart-detail/?chartId=101156#:~:text=With%20the%20development%20of%20newer,yielding%20varieties%20on%20decreased%20acreage%2C
USDA-NASS (United States Department of Agriculture, National Agricultural Statistics Service Information). 2021. 2020 Season Vegetable Highlights. USDA-NASS, Washington, DC. Available at https://www.nass.usda.gov/Statistics_by_State/Florida/Publications/Annual_Statistical_Bulletin/2021/E1thru8Veg-2021.pdf
USDA-NASS (United States Department of Agriculture, National Agricultural Statistics Service Information). 2017. Noncitrus Fruits and Nuts 2016 Summary. USDA-NASS, Washington, DC. Available at https://www.nass.usda.gov/Publications/Todays_Reports/reports/ncit0617.pdf
USDA-NASS (United States Department of Agriculture, National Agricultural Statistics Service Information). 2018. Noncitrus Fruits and Nuts 2017 Summary. USDA-NASS, Washington, DC. Available at https://www.nass.usda.gov/Publications/Todays_Reports/reports/ncit0618.pdf
USDA-NASS (United States Department of Agriculture, National Agricultural Statistics Service Information). 2019. Noncitrus Fruits and Nuts 2018 Summary. USDA-NASS, Washington, DC. Available at https://www.nass.usda.gov/Publications/Todays_Reports/reports/ncit0619.pdf
USDA-NASS (United States Department of Agriculture, National Agricultural Statistics Service Information). 2021. Noncitrus Fruits and Nuts 2020 Summary. USDA-NASS, Washington, DC. Available at https://downloads.usda.library.cornell.edu/usda-esmis/files/zs25x846c/sf269213r/6t054c23t/ncit0521.pdf
USDA-NASS (United States Department of Agriculture, National Agricultural Statistics Service Information). 2022. Noncitrus Fruits and Nuts 2021 Summary. USDA-NASS, Washington, DC. Available at https://www.nass.usda.gov/Publications/Todays_Reports/reports/ncit0522.pdf
USDA-NASS (United States Department of Agriculture, National Agricultural Statistics Service Information). 2023. Noncitrus Fruits and Nuts 2022 Summary. USDA-NASS, Washington, DC. Available at https://downloads.usda.library.cornell.edu/usda-esmis/files/zs25x846c/zk51wx21m/k356bk214/ncit0523.pdf
USDA-AMS (United States Department of Agriculture, Agricultural Marketing Service). 2020. Specialty crop 10,000 lb. movement. USDA-AMS, Washington, DC https://marketnews.usda.gov/mnp/fv-report-config-step1?type=movement
USDA-NASS (United States Department of Agriculture, National Agricultural Statistics Service Information). Quick Stats. USDA-NASS, Washington, DC. Available at https://quickstats.nass.usda.gov
Weber, C., S. Simnitt, G. Lucier, and V. W. Davis. 2023. Fruit and Tree Nuts Outlook: March 2023. United States Department of Agriculture Economic Research Service Situation and Outlook Report. Available at https://www.ers.usda.gov/webdocs/outlooks/106240/fts-376.pdf?v=7223.8
Wu, F., Z. Guan, and A. Whidden. 2012. “Strawberry Industry Overview and Outlook.” University of Florida Institute of Food and Agricultural Sciences.