Introduction
Body condition score (BCS) is an assessment of the fat cover that the cow is carrying. Surplus nutrition (energy) causes fat to be stored; an energy deficiency causes fat to be used by the body. The amount of fat has an influence on the hormones and physiology of the cow, including reproduction, lactation, and calf production. Reproduction and calf weaning weight have profound effects on the profitability of the cow-calf enterprise, so cow BCS is a subject that warrants attention. The body condition score (BCS) of a cow and the herd overall is the best indicator of past nutritional status or success of the overall nutritional program, as well as the best indicator of near-term nutritional needs.
Body Condition Score
If you are not familiar with body condition scoring your cow herd, your local UF/IFAS Extension agent can provide you with the necessary tools to become acquainted with the procedure. It is the least expensive but greatest return-management technique that a cattle producer can adopt. Unlike other management techniques, BCS is free, can save feed resources and dollars, and can increase returns to the cow herd enterprise.
Body condition scoring is a numerical score assigned to cattle based on the estimated amount of fat, or condition, of each animal. Body condition score in beef cattle is assessed in six locations on the animal to determine a final BCS for the animal. The six locations are identified in Figure 1 and include the back, tailhead, pins, hooks, ribs, and brisket.
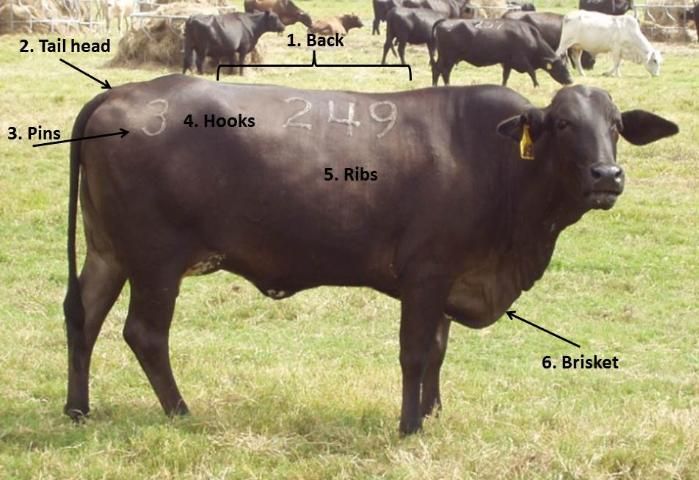
Initially, BCS can be assessed by ranking cattle as thin, moderate, or fat. After becoming consistent in placing cattle within these groups, we can begin assigning exact scores to cattle. The BCS system uses a scale of 1–9, with one being extremely thin and 9 being extremely obese. Thus the three categories can be assigned numbers from the BCS system in the following manner: thin includes scores between 1 and 3; moderate includes scores between 4 and 6; and fat includes scores between 7 and 9. Body condition score is an estimation of the amount of body fat and not necessarily body weight. However, one BCS is approximately 75 lbs of body weight in a mature cow; thus, to increase a single BCS necessitates 75 lbs of body weight gain. In order to gain BCS, a cow must increase its intake to consume more energy, which can be directed towards fat and lean tissue gain.
Even though the BCS system utilizes a 1 to 9 scale, most often cows fall in the range of BCS 3 to 6; the two extremes, BCS 1–2 and 7–9, rarely occur in commercial cattle enterprises. Physical descriptions related to the six BCS landmarks of cattle with BCS 3 through 6 are below.
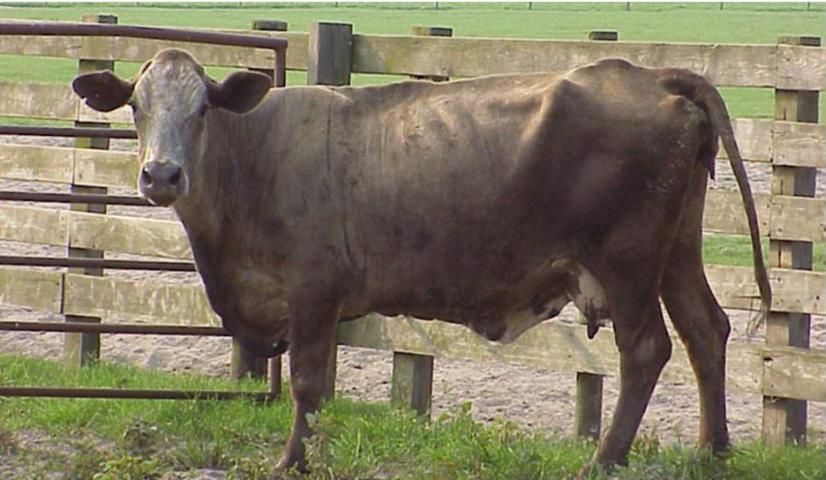
Body Condition Score 3
- Cattle are categorized as thin (Figure 2).
- Upper skeleton (backbones, hooks, pins) is prominent.
- Ribs are easily visible.
- Body fat is not obvious.
- Weight gain to reach a 5 is 150 lbs.
Credit: Matt Hersom, UF/IFAS
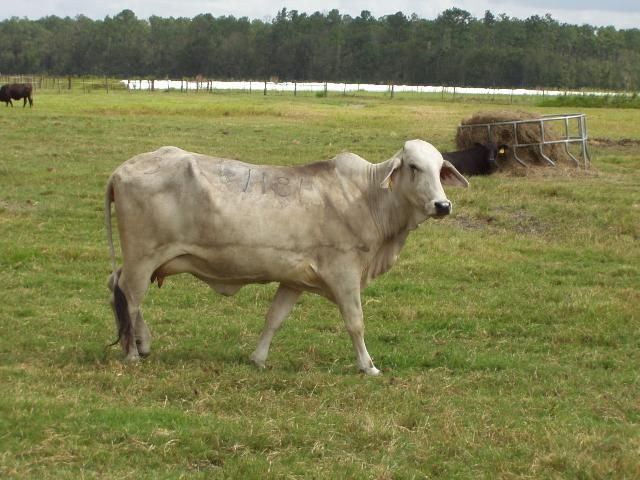
Body Condition Score 4
- Cattle are categorized as marginal (Figure 3).
- Upper skeleton (backbones, hooks, pins) is prominent but less visible.
- Muscle tissue is abundant.
- Fat is beginning to cover ribs, but ribs are still visible.
- Weight gain to BCS of 5 is 75 lbs.
Credit: Matt Hersom, UF/IFAS
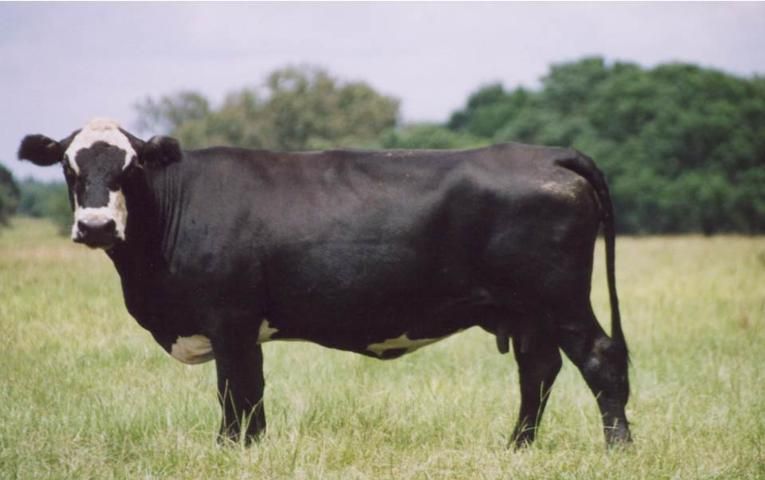
Body Condition Score 5
- Cattle are in moderate condition (Figure 4)
- Medium flesh for calving.
- Ideal flesh at weaning.
- Muscle tissue is nearing maximum.
- Hooks and pins visible but not obvious.
- Ribs covered slightly with fat, but the last rib is still visible.
- This is the target BCS to maintain cows.
Credit: John Arthington, UF/IFAS
Body Condition Score 6
- Cattle are in good condition (Figure 5).
- Ideal fleshing at calving.
- Muscle tissue volume is at a maximum.
- Hooks and pins become less prominent.
- Fat deposit behind shoulder is obvious.
- Ribs are covered completely with fat beginning to cover rump.
- Weight loss to BCS of 5 is 80lbs.
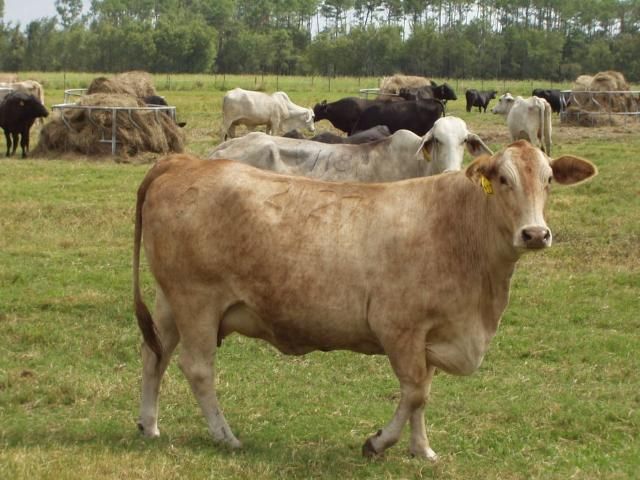
Credit: Matt Hersom, UF/IFAS
Production and Body Condition Score
There is a direct relationship between cow nutritional status, BCS, and cow herd reproductive performance. Numerous studies have examined the effect of cow BCS on any number of reproductive and productive traits. Summarizing data from four sources (Ciccioli et al. 2003; DeRouen et al. 1994; Spitzer et al. 1995; Vargas et al. 1999) that cover a range of BCS and locations provides a nice data set to understand the relationship of cow BCS and production.
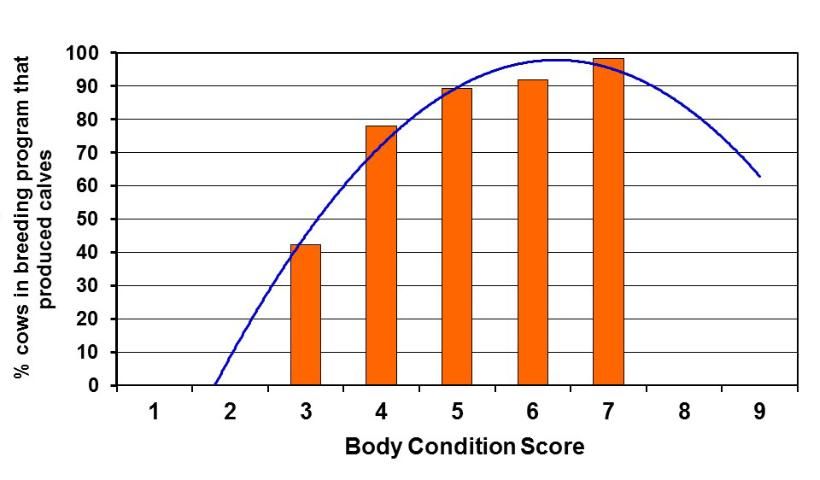
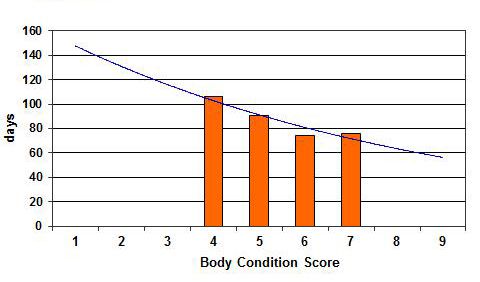
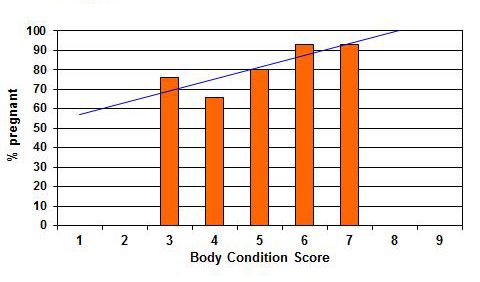
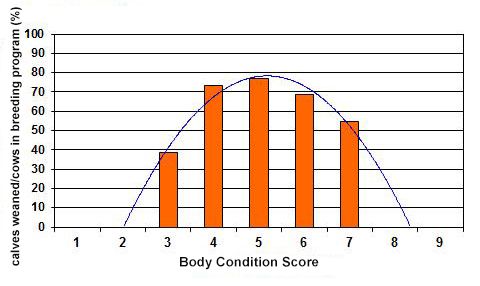
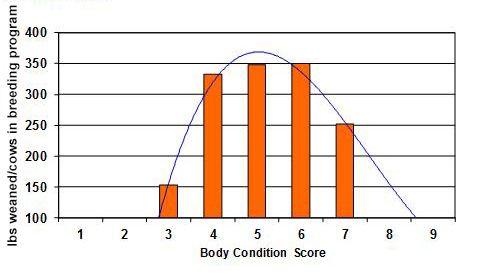
Figures 6 through 10 demonstrate the relationship of cow BCS to five important reproductive and productive outcomes. In each instance, improving cow BCS from thin/BCS 3 to moderate/BCS 5 improves every outcome measure. Trend lines are included on each graph to demonstrate the relationship of BCS and outcome.
A. Calving percentage
Calving percentage (Figure 6) depicts the number of calves born from all of the cows that were exposed to the breeding program; this include cows that became pregnant and those that did not become pregnant. Calving percentage is a measure of breeding and gestation efficiency; break-points between BCS 3 to 4 and 4 to 5 are evident.
B. Postpartum interval
Postpartum interval (Figure 7) shows the number of days that occur between calving and the establishment of the subsequent pregnancy. To meet production goals a cow must calve on an annual basis, but calving intervals greater than 85 days mean that the cow will not meet this goal.
C. Percent pregnant
The pregnancy percentage (Figure 8) demonstrates the number of cows that became pregnant during the breeding season. A linear increase in pregnancy percent is evident with increasing cow BCS.
D. Weaning percentage
Weaning percentage (Figure 9) depicts the number of calves weaned out of the total number of cows exposed to breeding the prior breeding season. Calving percentage is derived from pregnancy percentage, calving percentage, and any post-calving death loss.
E. Weaning weight
The calf body weight on the day it is weaned (weaning weight; Figure 10) outcome is expressed as pounds weaned per cow exposed to breeding in the previous breeding season. This measure takes into account both successful and unsuccessful calving in the cow herd. A distinct deficiency in thin cows with a BCS 4 or fat cows with a BCS 7 is clearly evident.
Cows are not always in the desired BCS; however, the product cycle continues. The change in BCS around calving is particularly important and has an important impact on production. Cows that experience body weight loss after calving are in a negative energy balance, which depresses production of luteinizing hormone and follicle stimulating hormone, which are important for reproductive performance. Conversely, cows that gain body weight after calving are in a positive energy balance regardless of their current BCS. The positive energy balance support synthesis and secretion of the reproductive hormones that support estrus cycling and establishment of pregnancy.
Table 1 demonstrates the pregnancy rate outcome when cows are at different BCSs at calving. Cows that are in thin BCS have less desirable pregnancy rates, and if the cow loses body weight after calving, the pregnancy rate decreases; however, if the cow increases body weight after calving, pregnancy rate can be improved. Likewise, cows in moderate BCS can improve their pregnancy rate by increasing body weight after calving. Cows that calve in good BCS will have acceptable pregnancy rate regardless of body weight change, and gaining body weight after calving results in only marginal increases in pregnancy rate.
Economic Impact
Ultimately, cow BCS and production outcomes are of economic relevance. Table 2 presents an interpretation of the economic impact that different cow BCSs (3 to 5) have on productive outcomes. The outcome measures are of pregnancy percent, weaning percent, and weaning weight per cow exposed from Figures 6 through 10; 205-d weaning weight is derived from the same data sources (Ciccioli et al. 2003; DeRouen et al. 1994; Spitzer et al. 1995; Vargas et al. 1999). Because low-BCS cows have decreased pregnancy rates, wean fewer calves, wean lighter calves, and return less overall dollars to the herd, the impact of BCS on cow herd profitability is considerable. Estimations of revenue are sensitive to calf sale price, but it is undeniable that adequate cow BCS and thus adequate cow nutrition is imperative to profitability. There is a nearly $400 dollar difference in weaning weight dollars per cow or gross profit between BCS 3 and BCS 4 cows. The difference in dollars returned per cow between BCS 4 and 5 cows is nearly $50, which is still a considerable amount of potential revenue.
Conclusion
Cow herds experience a period or periods of nutritional restriction during the annual production cycle that can affect BCS. Body condition score of the cow not only affects the cow's ability to maintain herself, but also affects the cow's ability to become pregnant and maintain pregnancy, and can negatively affect calf performance. The opportunity to negatively or positively affect a calf crop and the economic return from the calf crop ultimately starts with cow nutrition BCS.
References
Ciccioli, N. H., R. P. Wettemann, L. J. Spicer, C. A. Lents, F. J. White, and D. H. Keisler. 2003. "Influence of Body Condition at Calving and Postpartum Nutrition on Endocrine Function and Reproductive Performance of Primiparous Beef Cows." J. Anim. Sci. 81: 3107–3120.
DeRouen, S. M., D. E. Franke, D. G. Morrison, W. E. Wyatt, D. F. Coombs, T. W. White, P. E. Humes, and B. B Greene. 1994. "Prepartum Body Condition and Weight Influences on Reproductive Performance of First-Calf Beef Cows". J. Anim. Sci. 72: 1119–1125.
Spitzer, J. C., D. G. Morrison, R. P. Wettemann, and L. C. Faulkner. 1995. "Reproductive Responses and Calf Birth and Weaning Weights as Affected by Body Condition at Parturition and Postpartum Weight Gain In Primiparous Beef Cows." J. Anim. Sci. 73: 1251–1257.
Vargas, C. A., T. A. Olson, C. C. Chase, A. C. Hammond, and M. A. Elzo. 1999. "Influence of Frame Size and Body Condition Score on Performance of Brahman Cattle." J. Anim. Sci. 77: 3140–3149.
Effect of cow body condition score at calving and weight change after calving on pregnancy rate.