Introduction
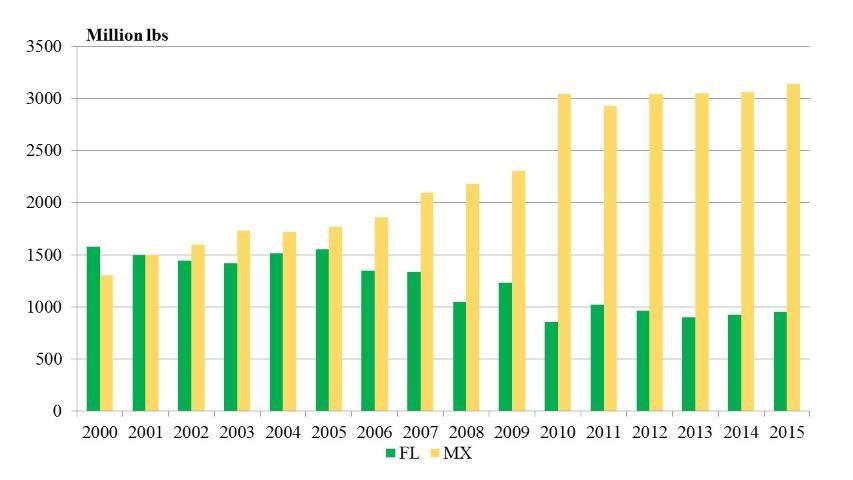
The production capacity of the US tomato industry has decreased significantly in the past decade. According to the National Agricultural Statistics Service (NASS) of the United States Department of Agriculture (USDA-NASS), fresh tomato production in 2005 was approximately 3.8 billion pounds from 136,000 acres, but decreased by 30% to 2.6 billion pounds and 97,500 acres in 2015. The downward trend of California and Florida, two major producers accounting for about 70% of total tomato production in the United States, was significant, particularly for the Florida tomato industry (Figure 1). The decline was mainly due to increasing competition from Mexico, which has been a major concern for the US tomato industry. For example, in 2005, imports from Mexico were comparable to total Florida production, but in 2015, the import volume was more than three times higher than Florida production (Figure 1).

Historically, tariffs on imports of Mexican tomatoes were in place to protect US tomato producers. The North American Free Trade Agreement (NAFTA) signed in 1992 gradually eliminated tariffs on Mexican tomatoes. Due to increased competition from Mexico, the United States Department of Commerce and the Mexican tomato industry negotiated and signed several "Suspension Agreements" that set reference (floor) prices for imported Mexican fresh tomatoes to protect the US domestic industry. This article provides a review of the history of the suspension agreements and an analysis of their effects on the US tomato industry.
Tomato Suspension Agreements
On April 18, 1996, the US tomato industry filed a petition to the United States Department of Commerce (USDC) to initiate an antidumping investigation (USDC 1996). Upon negotiations, the USDC and the Mexican tomato industry reached an agreement that suspended the antidumping investigation but set a floor price for tomatoes imported from Mexico (USDC 1996). The initial suspension agreement was signed on December 6, 1996. Under that agreement, the floor price was set at 20.68 cents per pound. The agreement's intent was to ensure there was no undercutting or suppressing of fresh market tomato prices in the United States. The agreement was later amended in October 1998, setting different floor prices for winter and summer tomatoes. The price was set at 21.08 cents per pound for winter tomatoes (October 23–June 30) and 17.2 cents per pound for summer tomatoes (July 1–October 22). On May 22, 2002, the USDC terminated the 1996 suspension agreement and reopened the antidumping case. The USDC and Mexico eventually renewed the agreement on December 4, 2002 (2003 suspension agreement). Under the 2003 suspension agreement, the floor price for winter tomatoes was increased to 21.69 cents per pound while it remained unchanged for summer tomatoes (USDC 2002). The USDC and Mexico renewed the agreement on January 22, 2008 (2008 suspension agreement). Under the renewed agreement, the floor prices remained the same as in the 2003 agreement (USDC 2008).

Up until 2013, the floor prices changed very little over a period of 15 years after the 1998 amendment. During this 15-year period, production costs increased significantly, which, along with the increasing imports from Mexico, created tremendous pressure on the domestic industry. The industry eventually filed a case to re-open the antidumping investigation in 2012. After rounds of negotiations, the two parties reached a substantially changed agreement on March 4, 2013 (2013 suspension agreement). Unlike the previous agreements, the new agreement distinguishes different types of tomatoes and sets floor prices according to the characteristics of production (Table 2). For tomatoes grown in the open-field and adapted environments, the prices were set at 31.00 cents per pound for winter tomatoes and 24.58 cents per pound for summer tomatoes (USDC 2013), which increased by 43% compared to the previous agreement. For tomatoes grown in environments where temperatures could be controlled (such as greenhouses), the prices were set at 41.00 and 32.51 cents per pound for winter and summer tomatoes, respectively (USDC 2013). Furthermore, the prices for specialty tomatoes (loose) were set at 45.00 and 35.68 cents per pound for winter and summer tomatoes, respectively, whereas those for packed specialty tomatoes were set at 59.00 and 46.79 cents per pound, respectively (USDC 2013).
Market Prices under Agreements
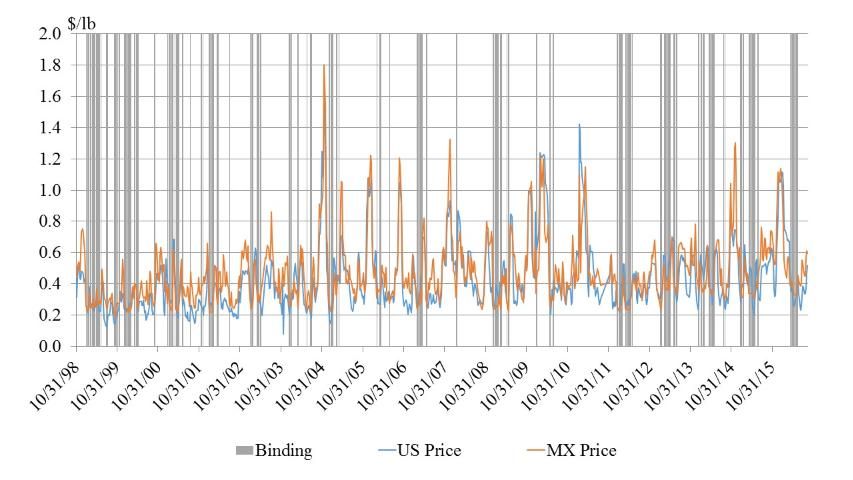
Table 3 shows that the average weekly US tomato price was $0.43 per pound during 1998–2013 before the 2013 agreement took effect and rose to $0.49 per pound over 2013–2016 under the 2013 agreement. In contrast, the average price of tomatoes imported from Mexico increased from $0.47 to $0.53 per pound. Meanwhile, the volatility of US tomato prices (expressed in standard deviations) decreased significantly over 2013–2016. The volatility reduction due to the suspension agreement was further quantified in a more rigorous analysis by Wu et al. (2017); the conclusion was that the suspension agreement indeed contributed to a volatility reduction. Figure 2 depicts the weekly movement of Mexican and US tomato prices, and the shaded areas mark the weeks in which Mexican tomato prices were restrained at floor prices during the period of October 31, 1998, through September 10, 2016.

Before the 2013 agreement, 22% of the weekly samples were restrained by the floor prices, whereas under the 2013 agreement, the percentage increased to 31%. Before the 2013 agreement, imported prices were restrained mostly in January, February, and March, when Florida tomatoes dominate the market. Under the new agreement, the binding reference prices also occurred in April and May. These periods are also in the production window of Florida tomatoes, so the new agreement has played a larger role in easing the stress for the Florida tomato industry.
Wu et al. (2017) also conducted an in-depth analysis of the impact of tomato suspension agreements on price dynamics. In this work, they built a price model with data on open-field and adapted-environment tomatoes and then used the model to simulate the market price movements under two scenarios, namely, with and without the 2013 suspension agreement (the previous agreement was assumed to have continued in the second scenario). The price movements under the two scenarios were compared. They found the 2013 agreement boosted market prices and increased prices of Mexican tomatoes by 5.5% (10.1% in summer and 3.1% in winter) and increased US tomato prices by 1.3% (0.8% in summer and 1.6% in winter). For Florida growers, the increased prices translate to an extra revenue of about $220 per acre.
Conclusions
Mexican competition has been a major challenge to the Florida fruit and vegetable industry (Suh et al. 2017). The tomato suspension agreements are negotiated regularly between the United States and Mexico to prevent undercutting or suppressing of fresh market tomato prices. This article provides a review of the history of the suspension agreements and an analysis of the impact of the 2013 agreement on market price dynamics. The 2013 suspension agreement substantially increased the floor prices (43% for open-field tomatoes). Under the new agreement, Mexican tomato prices are restrained more frequently by the floor prices. Research in the literature found evidence that the 2013 agreement resulted in higher market prices and lower volatilities. For Florida growers, the increased prices in the winter season generated an extra revenue of about $220 per acre for a representative grower. The gain from the increased prices (1.6%) is relatively small, which suggests that the suspension agreement alone (or its current design) may not be enough to make the industry sustainable and that the industry may need more changes in other areas.
References
Suh, D.H., Z. Guan, and H. Khachatryan. 2017. "The Impact of Mexican Competition on the U.S. Strawberry Industry." International Food and Agribusiness Management Review. 20: 591-604. https://doi.org/10.22434/IFAMR2016.0075.
USDC. 1996. "Suspension of Antidumping Investigation: Fresh Tomatoes from Mexico." Federal Register 61(213):56618–56621. United States Department of Commerce, Washington, DC.
USDC. 2002. "Suspension of Antidumping Investigation: Fresh Tomatoes from Mexico." Federal Register 67(241):77044–77053. United States Department of Commerce, Washington, DC.
USDC. 2008. "Suspension of Antidumping Investigation: Fresh Tomatoes from Mexico." Federal Register 73(18):4831–4840. United States Department of Commerce, Washington, DC.
USDC. 2013. "Fresh Tomatoes from Mexico: Suspension of Antidumping Investigation." Federal Register 78(46):14967–14979. United States Department of Commerce, Washington, DC.
Wu, F., Z. Guan, and D.H. Suh. 2017. "The Effects of Tomato Suspension Agreements on Market Price Dynamics and Farm Revenue." https://doi.org/10.1093/aepp/ppx029.