Overview
Water scarcity concerns have led to increased use of revolutionary new "smart" technologies in residential landscape irrigation including evapotranspiration and soil-moisture-sensor systems; but the adoption of these smart irrigation technologies into residential landscapes has been slow. The objective of the study described in this publication was to determine who is interested in purchasing smart irrigation systems and to segment (or cluster) interested consumers in order to facilitate targeted marketing strategies. Researchers used an online survey to collect data from homeowners in Florida, Texas, and California. Overall, soil-moisture-sensor systems were the type of smart irrigation system most preferred by respondents. The cluster analysis found four distinct consumer clusters: proactive consumers (22%), price-sensitive environmentalists (31%), content retirees (31%), and high-end professionals (16%). Proactive consumers and price-sensitive environmentalists were the most likely to purchase smart irrigation systems. Content retirees were the least likely.
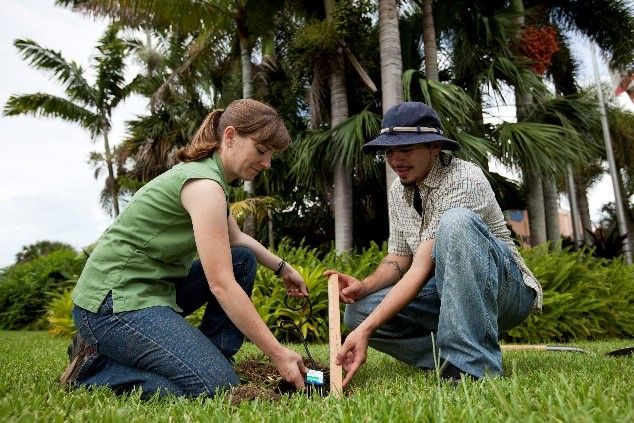
Credit: Tyler Jones UF/IFAS
This publication is an overview of how different consumer segments perceive smart irrigation technologies and the best promotions to encourage consumers to adopt smart irrigation in their home landscapes. It is designed for landscapers, irrigation specialists, and marketing professionals who work with and are interested in promoting smart irrigation technologies to end consumers. Both Extension faculty and private corporations can use the results to tailor smart irrigation marketing strategies to target relevant customer segments. Consequently, promotions will be more effective at encouraging homeowners to adopt water-saving irrigation technologies.
Introduction
Water scarcity concerns have become more widespread as areas throughout the United States and the world experience drought leading to many industries (including the landscape industry) evolving to reduce water waste and address related concerns. For example, the Florida Water StarSM program targets improving water efficiency in appliances, plumbing fixtures, irrigation systems, and landscapes (Southwest Florida Water Management District 2018). Another program, Southern California SoCal Water$mart Program, offers homeowners rebates to purchase and install water-saving products and services including appliances, turf removal, rain barrels, sprinkler systems, and/or irrigation sensors and controllers (The Metropolitan Water District of Southern California 2016).
Concerns about reduced water availability have motivated many industries to work to develop techniques and technologies to conserve water and lessen water waste. In the residential landscape irrigation industry, companies have developed smart irrigation systems that utilize local, site-specific information such as soil moisture, ambient temperature, or rainfall to regulate household irrigation systems. Two common types of smart irrigation systems include the evapotranspiration (ET) system and the soil moisture sensor (SMS) system. Evapotranspiration systems rely on weather stations to irrigate as needed while SMS systems use sensors near the plants' root zones to identify when the plants need water. The use of smart irrigation technologies has the potential to decrease household water use and bills (Morera et al. 2015). However, this type of irrigation system is more expensive than the conventional timer systems, which may decrease consumer adoption of the technology. It is important to identify who is and is not interested in smart irrigation systems in order to create targeted marketing strategies to reach people who will benefit the most from that information.
Methods
An online survey collected responses from homeowners in California, Florida, and Texas in May 2014. These states were of interest because combined they account for 25% of all US water use (Dieter et al. 2018). A total of 3000 people participated in the study, and respondents were equally split between each state. Each participant owned a home with a lawn and had an automated irrigation system. The online survey consisted of several sections that included questions about smart irrigation system purchase likelihood, irrigation-related knowledge, and motives to adapt smart irrigation systems.
Table 1 summarizes the demographic statistics of the 3000 homeowners. On average, participants were between 35 and 44 years old and 63% of the sample was female. Most households (76%) consisted of two adults, and many (61%) did not have children younger than 18 living with them. A majority of participants (62%) had obtained a 2-year college degree or higher. Regarding ethnicity, most of the participants (77.8%) were Caucasian/white, followed by Hispanic, Asian, African American, other, Native American, and Pacific Islander. The average 2013 household income was in the range of $60,000–$79,999.
Results
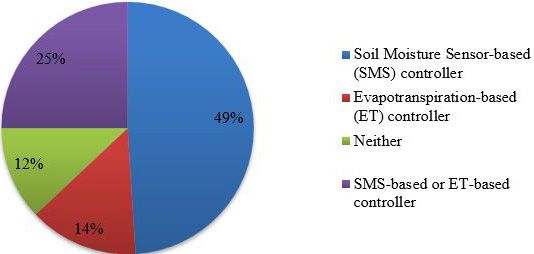
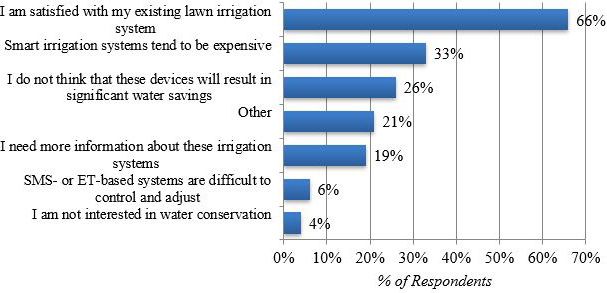
The largest percentage of respondents (49%) were interested in SMS controllers (Figure 2). Approximately 25% of respondents were interested in smart irrigation technology but did not have a preference between the types (SMS or ET). Next, 14% preferred ET systems while 12% were not interested in either system. If "neither" was selected (n=359), participants were asked why they were not interested in smart irrigation technologies. The majority of respondents (66%) indicated they were satisfied with their existing irrigation systems (Figure 3). Other barriers included cost, doubts about water savings, regional water restrictions, xeriscaping, and needing more information.
Researchers used ordered logit models to assess who was interested in purchasing SMS and ET irrigation systems. Several demographic factors were consistent across the smart irrigation systems. Regardless of system type, younger, male consumers with higher incomes were more likely to purchase SMS and ET systems. Interestingly, respondents with children in their households were interested in all the systems when compared to respondents without children at home. The number of adults in the household and education level were insignificant for all options.
Factor and Cluster Analysis
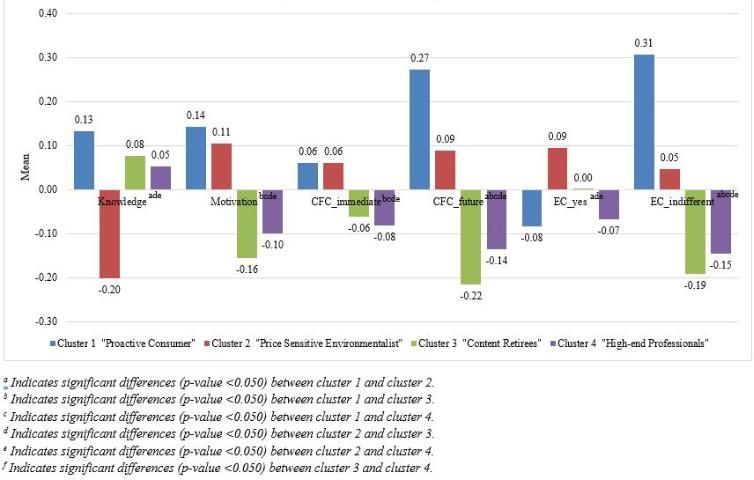
Factors are defined in economic literature as a combination of various statements that can be used to describe preferences or behavior. A total of six factors were estimated. Overall, the first factor (knowledge) describes participants' knowledge about irrigation-related topics. The second factor (motivation) defines participants' motivations behind adopting water-saving technologies. The third and fourth factors (CFC_immediate and CFC_future) describe whether the participant considered how their actions affect the future. People who scored high on the CFC_immediate factor are less concerned about the long-term impact of their actions and more aware of the immediate outcomes of their actions. Conversely, a high score in the CFC_future factor indicates a person who is taking actions to reduce future negative impacts on the environment or quality of life. Lastly, factors five and six (EC_yes and EC_indifferent) define the participant's level of environmental consciousness. EC_yes factor captured the perceptions of consumers who actively participate in environmentally conscious behavior (e.g., natural resource conservation, reduced pollution, donations, etc.) Participants who scored high in the EC_indifferent factor had low participation or negative perceptions of environmentally conscious behaviors.
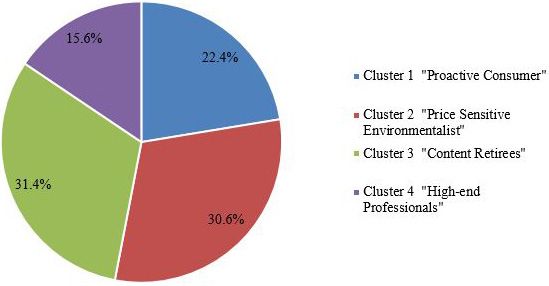
A Ward's linkage cluster analysis was used to cluster participants into homogenous segments based on their responses. Four distinct clusters were identified and titled as proactive consumers (22%), price-sensitive environmentalists (31%), content retirees (31%), and high-end professionals (16%; Figure 4).
Proactive consumers were knowledgeable about irrigation-related topics and wanted more information about water usage (Figure 5). This cluster was the most considerate with regards to future consequences of their actions but was not very environmentally conscious. Price-sensitive environmentalists were the least knowledgeable about irrigation-related topics. However, their behavior can be influenced by education information, they consider future consequences, and they are environmentally conscious. Content retirees were fairly knowledgeable about irritation-related topics, but they were less worried about the future consequences of their actions or the environment. Unlike the other clusters, the high-end professionals were not strongly impacted by future consequences or environmental factors.
Proactive consumers were one of the younger clusters (averaging between 35–44 years old), and 62% were women (Table 2). They had the largest household size with 2.4 adults and 1.6 children. Most (75%) had obtained a two-year college degree or higher. Regarding ethnicity, 66% were Caucasian/white, followed by Hispanic, Asian, African American, other, Pacific Islander, and Native American. Their average income was between $80,000–$99,999. Thirty-seven percent were Texas residents, followed by 33% California residents, and 30% Florida residents. Most of them had been living at their current location for 6–16 years (38%) followed by 2–5 years (31%), and their residences were around 2000 square feet.
Price-sensitive environmentalists were the other young cluster (averaging 35–44 years old) and consisted of 68% women (Table 2). As compared with the proactive consumers, they had smaller household sizes (2.3 adults and 0.9 children). The ethnic background of this cluster was comparable to the proactive consumer cluster but with a slightly lower percentage of Asian homeowners (7.1% compared to 11.9%). This cluster's members had the lowest education (49% had a 2-year degree or higher) and income levels (between $40,000–$59,999). Forty percent were Florida residents, followed by 32% California residents and 28% Texas residents. Many of them were recent home purchasers (58% started living at the residence within the past 5 years), and 48% of their residences were between 1001and 2000 square feet.
Content retirees were the oldest cluster, averaging 55–64 years old (Table 2). They also represented the highest percent of retirees (43%) and smallest household sizes (1.9 adults, 0.1 children). Sixty-two percent were women. Compared to the previous two clusters, the content retirees were predominantly Caucasian/white (90%) and the other ethnicities were less prevalent. Most (56%) had received a two-year college degree or higher. Their average income was between $40,000–$79,999 (49%). This cluster had the smallest residence size, with 61% living in homes less than 2000 square feet, but had lived at their residences for the longest period of time (i.e., 12 years). Thirty-five percent were Florida residents, followed by 34% California residents and 31% Texas residents.
High-end professionals had the highest income (averaging $160,000–$179,999) and averaged 55–64 years old (Table 2). This cluster had achieved the highest level of education with 73% having a two-year college degree or higher. Households averaged 2.3 adults and 0.5 children. Fifty-three percent were female and the majority were Caucasian/white (87%) with other ethnicities being less prevalent. These individuals had the largest residences, with the average home being 2,000–3,001 square feet, and had lived there a long time (i.e., 12 years). This cluster primarily resided in Texas (44%), followed by California (36%) and Florida (20%).
Smart Irrigation System Purchase Likelihood
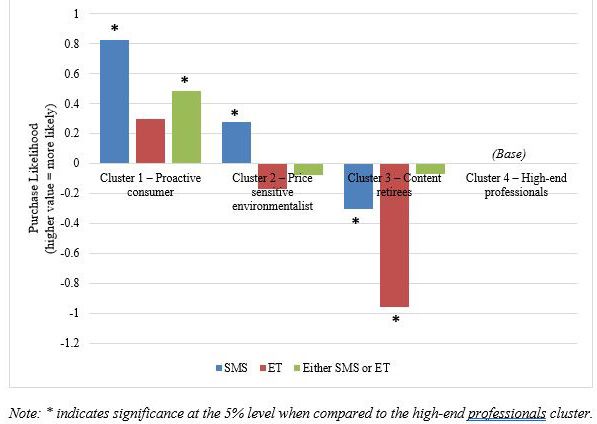
Purchase likelihood estimates varied between clusters (Figure 6). Significance is relative to the high-end professionals cluster, meaning a positive value indicates the cluster is more likely to purchase the smart irrigation system than the high-end professionals while a negative value denotes a decrease in purchase likelihood. Regarding SMS irrigation systems, proactive consumers and price-sensitive environmentalists were more likely to purchase the system than the high-end professionals. Conversely, content retirees were less likely to purchase a SMS irrigation system than high-end professionals. For the ET irrigation system, content retirees were less likely to purchase the technology than the high-end professionals. The other two clusters were not significantly different from the high-end professionals. Regarding the "either SMS or ET" controller, proactive consumers were more likely to purchase the product than the high-end professionals. Neither of the other two clusters were significantly different from the high-end professionals.
Summary and Key Findings
This publication outlines four unique consumer clusters that have different perceptions, demographics, and preferences for smart irrigation controllers. Region seemed to influence the clustering, with Florida residents primarily being categorized as price-sensitive environmentalists (41%), followed by content retirees (36%), proactive consumers (30%), and then high-end professionals (20%). California residents were equally distributed among the clusters at approximately 32–36%. Texas residents were primarily within the high-end professionals cluster (44%), followed by the proactive consumer cluster (37%), content retirees (31%), and price-sensitive environmentalists (28%). Overall, the results can be used to develop promotions and target market strategies specifically focusing on interested homeowner clusters.
Overall, having children in the household played a key role in determining whether respondents were receptive to purchasing/installing smart irrigation technologies. This likely stems from parents and guardians wanting to preserve natural resources for future generations. Alternatively, since smart irrigation systems ultimately save the homeowner money, these respondents may consider the systems as financially solvent investments where they ultimately conserve money that can be used on other family-related items, experiences, and needs.
SMS systems were the best-received smart irrigation controller. This implies there may be more opportunity to promote these controllers in areas that would benefit through smart irrigation technologies. The reason behind consumers' preference for SMS systems was not addressed in this study but may derive from these systems being more approachable, easier to understand, more believable, or it may be that these systems initiate irrigation based on real-time data, which likely appeals to consumers.
Lastly, some clusters are more receptive than others and these homeowners should be the primary audience of target marketing strategies. Specifically, the proactive consumer and price-sensitive environmentalist clusters are the most receptive clusters to these technologies (especially SMS systems), followed by the high-end professionals while content retirees should not be targeted. Given that content retirees were not very receptive to smart irrigation technologies, target marketing would be more effective when aimed at the other clusters. For instance:
- Young males with higher incomes and children are more receptive to smart irrigation technologies. Using promotions where these individuals shop is one means of attracting their attention and educating them about alternative irrigation controller options.
- Proactive consumers would likely be attracted by promotions emphasizing how smart irrigation systems provide short- and long-term benefits. They would also be receptive to information about irrigation system components that save water, such as sprinkler head types. They would be receptive to information about how smart irrigation allows them to properly program zones, save water, and collect data about their water use. Overall, educational advertising that provides this cluster with information about the benefits of smart irrigation systems would likely be effective.
- Price-sensitive environmentalists would respond better to promotions addressing the environmental impacts of using smart irrigation controllers. They also respond well to information about how this technology impacts the future. Unlike the other clusters, this group is more price sensitive. Therefore, price promotions may be another means to encourage these consumers to adopt smart irrigation technologies.
- High-end professionals were the most interested in gaining knowledge about the actual irrigation system. Promotions emphasizing the sprinkler type, zones, efficiency, application rates, plants, water needs of plants, and soil type would appeal to this group the most.
References
Dieter, C. A., M. A. Maupin, R. R. Caldwell, M. A. Harris, T. I. Ivahnenko, J. K. Lovelace, N. L. Barber, and K. S. Linsey. 2018. Estimated use of water in the United States in 2015: U.S. Geological Survey Circular 1441. 65 p. https://doi.org/10.3133/cir1441
Dukes, M. D. 2012. "Water conservation potential of landscape irrigation smart controllers." Transactions of the American Society of Agricultural and Biological Engineers 55(2):563–569.
Morera, M. C., P. F. Monaghan, M. D. Dukes, O. Wells, and S. L. Davis. 2015. "Evaluating Florida homeowner response to smart irrigation controllers." HortTechnology 25(4):511–521.
Southwest Florida Water Management District. 2018. Florida Water StarSM. Available at: https://www.swfwmd.state.fl.us/residents/water-conservation/florida-water-starsm. Accessed May 20, 2019.
The Metropolitan Water District of Southern California. 2016. SoCal Water$mart | Residential Rebates, Sacramento, CA. Available at: http://socalwatersmart.com/?page_id=3007. Accessed July 14, 2016.
U.S. Drought Monitor. 2016. Tabular data archive—Percent area in U.S. drought monitor categories. Lincoln, NE. Available at: http://droughtmonitor.unl.edu/MapsAndData/DataTables.aspx. Accessed July 14, 2016.