Introduction
This report summarizes industry statistics using data from primary and secondary sources and highlights production and sales trends in the US environmental horticulture industry in 2014. Data sources include the United States Department of Agriculture National Agricultural Statistics Service (USDA/NASS), US Census Bureau, the IBIS World Industry Reports, National Association of Home Builders, S&P/Case-Shiller Home Price Indices, US Bureau of Labor Statistics, University of Florida Bureau of Economic and Business Research, AIA Economics and Market Research Group, and Florida Realtors®. Primary data is collected through the National Nursery Survey, conducted by the Green Industry Research Consortium.
Credit: UF/IFAS
The report is organized as follows. The Overview section briefly discusses the US floriculture wholesale value statistics reported in the recent floriculture report by USDA and provides a snapshot of the economic impacts of the environmental horticulture industry in Florida. The Floriculture Crops Production section discusses changes in the number of growers, the area used for production, and the wholesale value of sales in more detail. Next, the Nursery and Floriculture Industry Consolidation section discusses changes in the number of enterprises and establishments from 2004 to 2012. The Housing Market Situation section discusses trends in the housing sector (single-family homes sold, new construction starts), with more detailed information on the housing market in Florida and implications for the environmental horticulture industry. The Consumer Confidence and Expectations section discusses consumers' expectations of the economic conditions and personal financial situation in Florida, which are also important for assessing demand for floriculture products.
Overview
The environmental horticulture industry reflected the sluggish economic recovery, strong import competition, and slow pace of technological change in the US industry throughout 2013. According to a recent floriculture crops report (USDA/NASS 2013), the leading states in terms of year-over-year percentage increase in wholesale value in 2012 were Pennsylvania (20.7%), Ohio (15.6%), North Carolina (13.5%) and Texas (11.1%). Among the top ten production states, the laggards were California and Florida, each down by 2.6 percent. However, in terms of wholesale value of sales (i.e., market share), California and Florida remain the top two states in the country, with $974.2 million (M) and $802.6 M, respectively (all dollar amounts in US dollars). When small producers (growers with less than $100,000 annual sales) are included, total estimated sales in California and Florida rise to $985 M and $812 M, respectively. Together these two states account for more than 44 percent of the total wholesale value of sales in the United States.
The environmental horticulture industry in Florida is among the most important sectors of the state's agricultural economy, with total output or revenue impacts (i.e., the dollar value of a good or service produced or sold; equivalent to sales revenues plus changes in business inventories) in 2010 estimated at $16.29 billion (B). This figure includes $11.87 B in direct output impacts of industry sales, $692 M in indirect output impacts from firms that supply inputs to the horticulture sectors, and $3.72 B in induced impacts associated with spending by industry employee and proprietor households (Hodges et al. 2011). More specifically, total output (or revenue) impacts were $8.12 B for nurseries, $6.24 B for landscape services, $1.68 B for horticultural retailers, and $243 M for allied horticultural suppliers. Of the four environmental horticulture sectors, nurseries and greenhouses generated the largest share of indirect and induced multiplier impacts (i.e., impact from firms that supply inputs to the horticulture sectors) due to their large exports to the domestic and international markets.
Floriculture Crops Production
Number of Growers
The number of horticultural producers continues its downward trajectory that started with the economic slowdown in 2008–2009 (Table 1). The total number of producers in the 15 states included in the USDA survey (USDA/NASS 2013) declined by 6 percent in 2012 to 5,419 growers (for comparison, the decline from 2010 to 2011 was 6.5 percent). The number of producers declined in all 15 states surveyed, with the exception of Maryland and Hawaii, where the number increased by 3.2 and 1.7 percent, respectively. The 2012 rate of decline of floriculture crops producers in some states, as compared with 2011, was as follows: California (3.2% vs. 9.2 %), Illinois (3.9% vs. 10.9 %), New York (6.2% vs. 6.5 %), Ohio (8.1% vs. 9.1 %) and Washington (5.8% vs. 12.8 %). However, the year-over-year (2011 to 2012) comparison showed that the number of growers in the majority of states in the USDA fifteen-state program declined considerably. For example, the total number of growers in Florida declined by 9.7 percent in 2012, while the decline in 2011 was only 6.3 percent.
The number of growers also declined in New Jersey (7.7 % in 2012; 4.4 % in 2011), Oregon (12.7 % in 2012; 6.5 % in 2011), South Carolina (23.1 % in 2012; 10.3 % in 2011) and Texas (8.4 % in 2012; 0.7 % in 2011). The total number of growers included in the USDA/NASS fifteen-state program declined by 745 in the years between 2010 and 2012 (i.e., 401 growers from 2010 to 2011, and 344 growers from 2011 to 2012) (Table 1).
Area Used for Production
Covered Area
The total area of floriculture crops produced under cover declined in most of the 15 states included in the USDA/NASS report (2013), averaging a 1.4 percent decline from 2011 to 2012 (Table 2). The average rate of decline in 2011–2012 is slightly lower (1.4%), compared with 2010–2011, which exhibited a 2.5 percent decline. Only three states saw an increase in production areas: Oregon (13.9%), New Jersey (4.1%), and Washington (0.5%) (Note: for New Jersey and Oregon, the positive trend in the area used for covered production continues from 2011, when the area increased in comparison with 2010 by 7.0% for New Jersey and 0.1% for Oregon). South Carolina and North Carolina reported the largest reductions, 24.6 and 15.4 percent, respectively. The decline in the South Carolina covered area of production is consistent with the decline from 2010 to 2011 (27.9%); however, the decline in North Carolina from 2010 to 2011 was only 1.3 percent. Overall, the decline in the covered area used for production declined 1.4 percent from 2011 to 2012, which is 0.9 percent less than the decline from 2010 to 2011 (2.5%).
Open Ground
From 2011 to 2012, the largest increased acreages of open-grown floricultural crops were observed in Washington (78%), Illinois (64.4%), and Oregon (18.9%). The number of acres used for open-ground operations increased in Texas (8.4%), Hawaii (6.8%), and North Carolina (3.8%). In contrast, from 2010 to 2011, only three states had reported increased acres for open-ground production: Pennsylvania (17.5%), Michigan (11.3%), and Texas (3%). The largest reductions in open-ground production in 2012 were reported by the growers in South Carolina (82.1%), Maryland (58.1%), Ohio (25.7%), and Pennsylvania (17.6%). The total decline in open acres from 2011 to 2012 for all 15 states studied was 2.1 percent, which is 4.5 percent lower than the decline from 2010 to 2011 (Table 2).
Other Type of Cover
Annual production statistics for horticultural crops from additional operations such as greenhouses (including those made of glass, film plastic, fiberglass, and other rigid materials) and shade cloth and other temporary covers are provided later (see Tables 6–10, Appendix I).
Wholesale Value
The wholesale value of all plant category sales in 2012 increased 1.5 percent to $3.993 (B). Similar to changes in the number of growers, there were noticeable variations among the 15 states and across plant categories (i.e., annuals, perennials, potted flowering plants, foliage, cut flowers, or propagative material). From 2011 to 2012, the floriculture crops' wholesale value in Florida and California (top two producing states) decreased 2.6 percent to $802.6 M and $974.2 M, respectively (Table 3). In contrast, significant year-over-year increases in the wholesale value of sales were observed in North Carolina (13.5%, to $254 M), Ohio (15.6%, to $222.3 M), Pennsylvania (20.7%, to 148.9 M) and Texas (11.1%, to $275.7 M).
The variation in sales figures can also be seen across plant categories. For example, from 2011 to 2012, annual bedding/garden plant sales increased by two percent, to $1.36 B (Table 11, Appendix II); perennials increased by 5.7 percent, to $594.5 M (Table 12, Appendix II); foliage increased by 4.6 percent, to $641.8 M (Table 14, Appendix II); and propagative material increased by three percent, to $366 M (Table 17, Appendix II). On the other hand, wholesale value of containerized floriculture decreased by 3.5 percent (to $617.8 M) in 2012 (Table 13, Appendix II). Similarly, cut flowers' wholesale value decreased by 4.7 percent, to $342.1 M (Table 15, Appendix II), and cut cultivated greens' sales decreased by 1.5 percent, to $71 M (Table 16, Appendix II).
Nursery and Floriculture Industry Consolidations
Production of nursery and floriculture crops in the United States continues to have a low level of market concentration and relatively moderate barriers to entry. There were more than 59,000 establishments in 2004, which declined by 17 percent by 2008 (to 49,215), and by 23 percent by 2012 (to 45,565). In contrast, the number of enterprises dropped by 11 percent from 42,000 to 37,375 by 2008, and by 15 percent by 2012 (to 35,636) (Figure 2). Although small businesses cover the largest part of the industry (in terms of the number of firms), consolidation changes the industry toward large-scale operations, following the same trend in other agricultural industries. Larger producers enjoy lower per-unit costs of production and distribution made possible by economies of scale and scope (e.g., innovative supply chains, direct marketing opportunities). With increasing global opportunities, reaching out to international export markets may also favor larger producers. Competition from imports of foliage and cut flowers will remain one of the primary challenges to domestic producers.
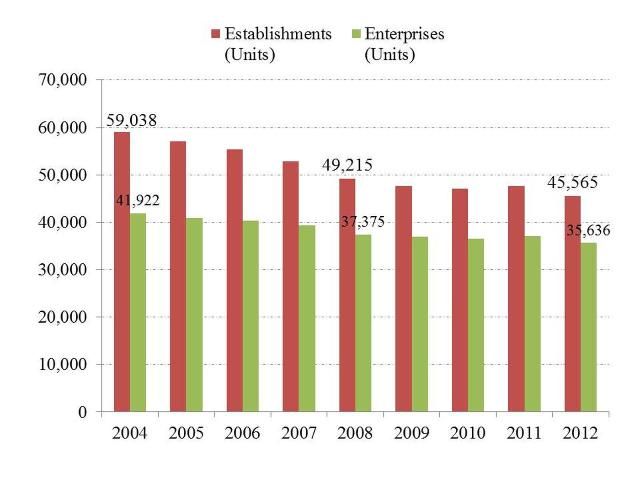
Credit: IBIS World Reports: 2013 Plant & Flower Growing in the United States. Note: An enterprise is a division that is managed separately and may consist of one or more establishments. An establishment is the smallest unit within an enterprise and has a si
Housing Market Situations
Single-Family New Houses Sold in the United States
The economic performance of the nursery and greenhouse industry is closely related to developments in the housing market, namely new construction starts and sales of existing houses. Sales of new houses generate the greatest demand for the products and services provided by the nursery and greenhouse industry. Housing market trends in states such as California or Florida (states with the highest number of foreclosures) are important considerations for the estimation of consumer demand for horticultural products and services at the national level (indoor and outdodor plants, landscaping and related supplies). Figure 3 presents quarterly median sales prices trends of new houses sold, by US regions. Median values for the housing market represent a useful parameter for horticultural sales because mean prices can be affected by large deviations (e.g., very high- or low-priced house sales) in the house sales data.
Prices for new houses in the South and the Midwest regions have historically trended lower than the US median prices (Figure 3). Although median prices for new houses sold in the West significantly declined after the peak of the market around 2005/06, the trend has generally been above the overall US median prices. The median sales price trend in the Northeast region has been fluctuating since 2005, and there is no deterministic trend. Median sales prices of new houses in the West, however, show a considerable upward trend since 2011. The sales prices in the South and Midwest regions are lower than the national average, but an upward trend is observed from 2011. The overall increase in the median sales prices may lead to increased construction and higher demand for environmental horticulture products in the next years.
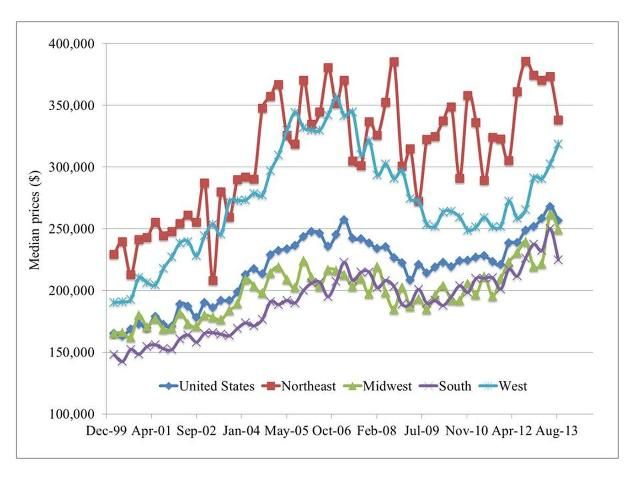
Credit: US Census Bureau. Note: Data are for new, single-family houses only.
Single-Family House Construction Starts in the United States
As with sales of new houses, new construction starts will contribute to the economic recovery of the nursery and floriculture industry. The main difference, however, is that demand associated with new construction starts is delayed by almost one year until houses are constructed and the demand for the horticultural products and services is generated. As shown in Figure 4, the construction starts trend in the Northeast, Midwest, and West was relatively flat between 2011 and 2013. Housing starts in the South, however, were relatively higher, ranging between 20 thousand to over 30 thousand units since January 2012. Since December 2012 (the second lowest point of the total US line), the number of single-family housing starts has significantly increased. The highest number of single-family homes construction starts was in June 2013 (60,900 units). The total number of single-family homes construction in 2013 was 576,200, a 7.6 percent increase from the 535,300 figure in 2012.
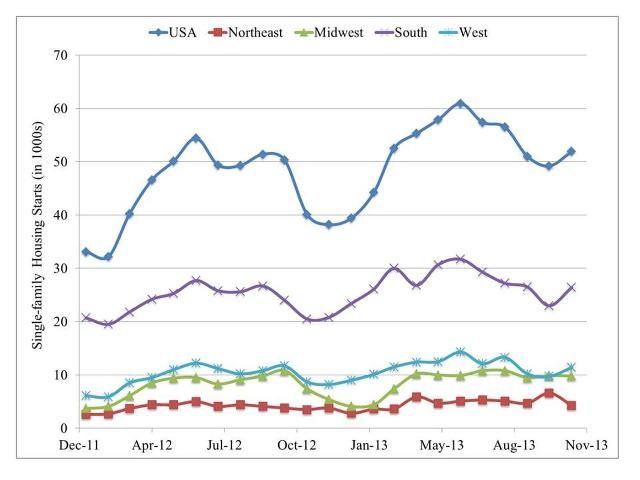
Credit: US Census Bureau. Note: The data are for new residential housing units authorized by building permits, started, and completed.
Architectural Billing Index
Compiled by the American Institute of Architects Economics and Market Research Group, the Architecture Billing Index (ABI) is another useful economic indicator that can be used to predict construction activity. More precisely, the ABI is a seasonally adjusted, leading economic indicator of potential non-residential construction spending for one year into the future. The American Institute of Architects surveys approximately 300 member firms to identify significant (±5%) monthly changes in client billings (Baker and Saltes 2005). An ABI value of 50.0 indicates no difference from the aggregate firms' previous month's billings. Movements of the index away from the 50 value indicate that architectural client billings are either increasing or decreasing. This in turn would be visible in nonresidential construction spending at a future date because architectural services is the first step in the process of building construction. For most of 2013, the ABI was in a position above 50, except for the month of April (48.6) (Figure 5). November and December of 2013 saw the index fall below 50 to values of 49.8 and 48.5 respectively, indicating a reduction in the demand for architectural services with a potential slowdown in nonresidential construction spending late into 2014.
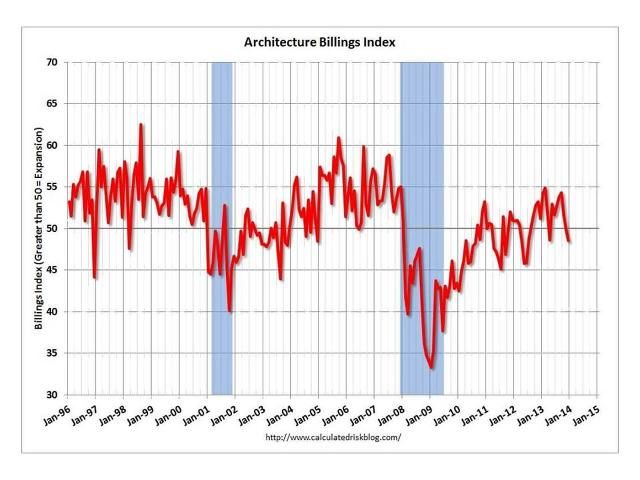
Credit: http://www.calculatedriskblog.com/2014/01/aia-architecture-billings-index.html
Single-Family New House Sales in Florida
According to a recent report compiled by Florida Realtors® (2013), the number of single-family houses sold in Florida increased by 17.3 percent in the third quarter (Q3) in 2013 compared with the same period in 2012 (Table 4), reaching 60,661 houses. The one-year median sales price for single-family houses increased by 18.6 percent (reaching to $175,000). In Q3 in 2013, pending sales of single-family houses in Florida increased by 18.4 percent, to 69,483 houses (compared with Q3 in 2012), while cash and sales increased by 13.9 percent, to 25,442 houses. Short-sale transactions (an indicator of consumer distress) were down 30.9 percent, to 7,935 houses, with an increase in the median price by $16,000 (to $130,000 in Q3 2013). Sales of foreclosure or real-estate-owned (REO) houses were up by 14.3%, to 10,332 houses. Traditional sales increased by 35.8%, to 42,394 units (Table 5).
Consumer Confidence
Following the survey model by the University of Michigan Survey of Consumers conducted since 1952 (http://www.sca.isr.umich.edu), the UF Bureau of Economic and Business Research has measured consumers' confidence and optimism for over the next five years (BEBR 2013). The consumer confidence index measures consumer attitudes and buying intentions each month and is benchmarked to the index in 1985. About 40 percent of the index is based on questions about current economic conditions, and 60 percent is concerned with expectations of future conditions. The questionnaire used by the BEBR consists of five questions, and responses from approximately 500 households in Florida are collected monthly. As shown in Figure 6, consumers' expectations for national economic conditions from 2012 throughout 2013 were relatively higher than in 2011. Expectations over the next five years were higher in 2012, but both short and long term converged in 2013. Overall, the expectations for national economic conditions were within a higher range and there is less variation throughout 2012 and 2013 compared with the previous five years.
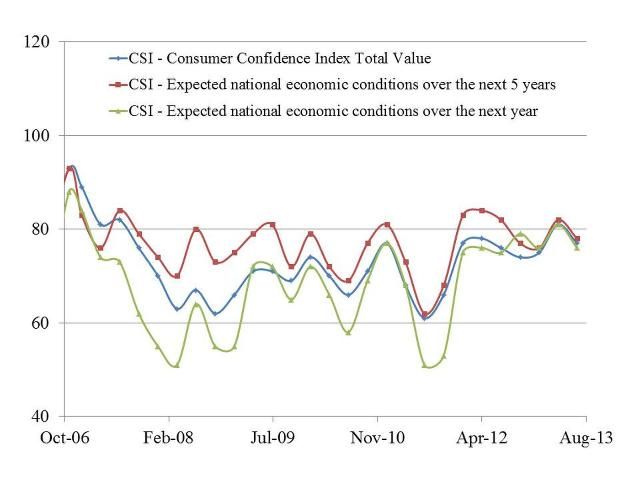
Credit: University of Florida Bureau of Economic and Business Research http://www.bebr.ufl.edu/data/series/catalog/group/Economic%20Indicators%20and% and http://www.bebr.ufl.edu/cci. Note: The vertical axis is an index of the level of consumer confidence an
Changes in the consumer confidence index have important implications for the environmental horticulture industry because the index reflects the degree of optimism that the consumers express about the state of the economy, and their degree of optimism is closely associated with their spending and savings behaviors. The more confident consumers feel about the stability of their personal incomes and the state of the economy overall, the more likely they are to purchase goods and services. To understand the significance of consumer spending to the national economy, consider spending as part of the leading economic indicators, such as the gross domestic product (GDP). In the United States, the proportion of household private consumption (i.e., the market value of all goods and services purchased by households) is estimated at 69 percent of the gross domestic product (The World Bank 2013). The demand for horticultural products and services, therefore, can be explained partially by changes in the level of consumers' expectations of the state of the economy.
Conclusions
In order to communicate the recent developments and future trends in the US environmental horticulture industry to the stakeholders, this report combined data related to the production and wholesale value of floriculture crops in the United States. The nursery and floriculture production and wholesale trends discussion was complemented by a review of the US housing market situation, specifically focusing on the housing market trends in Florida, as an important indicator of the industry's economic performance. According to the USDA/NASS fifteen-state statistics, the number of floriculture crop growers from 2010 to 2012 declined by 12.1 percent to 5,419. Although glass greenhouse production area increase by 3.7 percent in 2012, the total greenhouse production area (including film plastic, fiberglass, and other rigid covers) declined by 2.9 percent in 2012. Open-ground production acres followed the same trend by declining 6.6 and 2.1 percent in 2011 and 2012, respectively. Total wholesale value across all plant categories, however, increased by 1.5% in 2012, to $3.99 B, which can partly be explained by improved sales of new and existing houses, which generated additional demand for the floriculture crops. With the significant improvements in the US housing market situation, as shown by the national quarterly medial sales prices and the number of single-family housing construction starts, it is expected that the demand for floriculture and nursery crops and landscaping services will likely increase in the next several years.
References
Baker, K. and D. Saltes. 2005. Architectural billings as a leading indicator of construction: Analysis of the relation- ship between billings index and construction spending. Business Economics, 40(4): 67–73. https://content.aia.org/sites/default/files/2016-04/Arch-Billing-Leading-Indicator_2005.pdf
BEBR. 2013. Florida Indicators: Consumer Confidence 2013. Bureau of Economic and Business Research (BEBR), University of Florida, Gainesville, FL (November).
Hodges, A.W., T. Stevens, M. Rahmani, and H. Khachatryan. 2011. Economic Contributions of the Florida Environmental Horticulture Industry in 2010. Food and Resource Economics Department, University of Florida, Gainesville, FL (September). http://www.fred.ifas.ufl.edu/pdf/economic-impact-analysis/Economic_Contributions_Florida_Environmental_Horticulture_Industry_2010.pdf
USDA/NASS. 2012. Floriculture Crops 2011 Summary. United States Department of Agriculture, National Agricultural Statistics Service (USDA/NASS) (May). http://usda.mannlib.cornell.edu/MannUsda/viewDocumentInfo.do?documentID=1072
USDA/NASS. 2013. Floriculture Crops 2012 Summary. United States Department of Agriculture, National Agricultural Statistics Service (USDA/NASS) (April). http://usda.mannlib.cornell.edu/MannUsda/viewDocumentInfo.do?documentID=1072
The World Bank. 2013. World Development Indicators: Household Final Consumption Expenditure. http://data.worldbank.org/indicator/NE.CON.PETC.ZS
Appendices
Appendix I. Area Used in Production by Different Types of Greenhouse Operations
Areas used for production and percentage changes by covered and open-ground area in 2010, 2011, and 2012.
Appendix II. Wholesale Value by Plant Types
Wholesale value and percentage change of all floriculture crop sales in 2010, 2011, and 2012.
Area used and percentage change for total greenhouse cover production in 2010, 2011, and 2012.
Area used and percentage change for shade and temporary cover production in 2010, 2011, and 2012.
Area used and percentage change for fiberglass and other rigid greenhouse production in 2010, 2011, and 2012.
Area used and percentage change for film plastic greenhouse production in 2010, 2011, and 2012.
Wholesale value and percentage change of annual bedding/garden plant sales in 2010, 2011, and 2012.
Wholesale value and percentage change of herbaceous perennial plant sales in 2010, 2011, and 2012.
Wholesale value and percentage change of potted flowering plant sales in 2010, 2011, and 2012.
Wholesale value and percentage change of cut cultivated greens sales in 2010, 2011, and 2012.