Phosphorus (P) fertilization has important agronomic, economic, and environmental implications. While P may be required to sustain adequate crop production, excessive P applications may result in environmental problems. Sustainable agriculture depends on a variety of factors, including P fertilization. However, the increased public perception of the role of agricultural systems as a source of P pollution prompted the need to reevaluate P management strategies that minimize the impacts of agricultural management practices on water quality. In reality, much of the research addressing P losses does not account for the contribution of urban landscapes. Contributions to P load from urban land, including wastewater discharges and stormwater, are also significant and may exceed those from agricultural land on an areal basis (Glandon et al., 1981).
Agricultural best management practices have been widely used in many agricultural enterprises with the main objective being to reduce the risks of P transport and still maintain adequate crop production. These approaches include soil testing, proper fertilization rates, timing of fertilizer application, erosion control, and appropriate fertilizer source. Because P and nitrogen (N) are generally the most limiting nutrients in the soil, they often need to be applied via commercial fertilizer, manure, or biosolids to obtain optimum economic yields. This nutrient limitation is especially true in intensive agricultural operations, where the majority of the nutrients are removed from the soil with the crop harvest. Phosphorus fertilization rates vary considerably depending on the crop, management, and soil type. For instance, management of P in forage systems is quite variable depending on other aspects of forage management. In grazing conditions significant amounts of P are returned to the soil as animal excreta. Conversely, forage production systems where the plant biomass is removed from the field, such as those for turfgrass sod will require more P than forage grazing systems. Accurately assessing soil P availability, crop P requirements, and the quantity of P fertilizer needed are keys for obtaining optimum yields without sacrificing protection to the environment.
Sound P management programs are essential in agricultural systems in Florida. From an economic perspective, P and N fertilization is often the most expensive input in agricultural operations. Thus, besides the environmental benefit of avoiding unnecessary P applications, proper P fertilization may also reduce production costs.
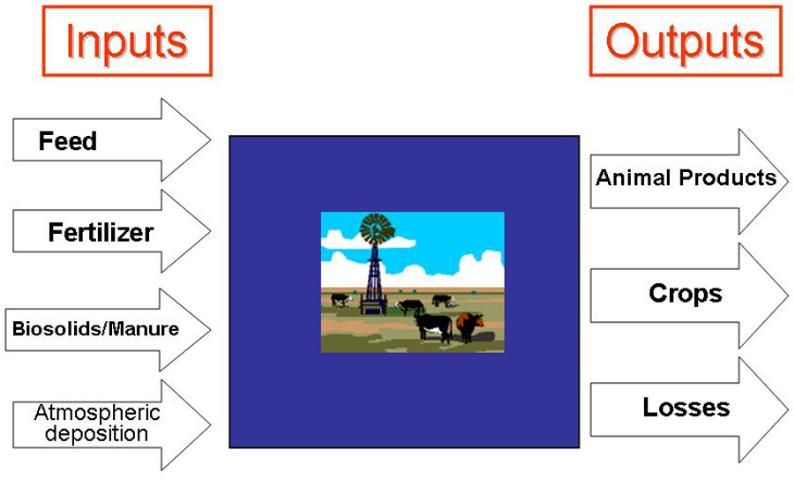
Effective fertilizer P management strategies should consider the balance between inputs and outputs in the system (Figure 1). Inputs may include P fertilization, biosolids and manure application, animal feed, and atmospheric deposition. Outputs include harvested crop, animal products, and P losses via subsurface leaching and runoff. When properly managed (inputs are balanced with the outputs), P fertilization is expected to have no negative effects on the environment. Phosphorus may become an issue when it accumulates in the soil as a result of repeated application of high fertilizer or manure rates (Silveira et al., 2006). On a large-scale, although areas of excessive soil P concentrations usually represent only a small portion of a watershed, these so-called "hot spots" are believed to be responsible for the majority of P losses. These P-enriched areas are often associated with hydrologically sensitive sites where P is highly susceptible to off-site transport. Understanding P input and output mass fluxes is essential to prevent P accumulation in the soil.

Limited information is available on the amounts of P removed in turfgrass sod production systems. From the nutrient management standpoint, sod systems are particularly interesting and quite unique when compared to other agricultural enterprises. The above- and below-ground plant biomass is removed along with a significant portion of soil when the sod is harvested. To sustain adequate yields, P will inevitably need to be applied to supply the crop nutrient requirements to sod grown on soils from which the previous sod crop has been harvested.
Biosolids are commonly applied to turfgrass production systems as a source of nutrients. Besides having the advantage of acting as a slow-release fertilizer, biosolids are also thought to maintain the sod integrity during harvesting and handling and consequently, to reduce soil losses. Factors such as plant maturity, harvesting strategy, and soil moisture may also affect the sod integrity.
The objective of this study was to evaluate P removal rates in different sod production systems in central and south Florida. Sod samples (~ 25" in length by 17" width on average) were collected in April, 2009 from 6 producers in 26 locations throughout central and south Florida. At each location, two sod samples were taken from each field. Soil type, sod species, and fertilization management differed significantly among the sampling locations (Table 1). In the laboratory, samples were divided into three compartments: above- and below-ground plant biomass, and soil pool. Plant and soil samples were dried separately and analyzed for total P at the UF/IFAS Range Cattle Research and Education Center in Ona. To account for possible soil contamination in the plant material, above- and below-ground samples were ashed and the results are expressed on organic matter basis.
Phosphorus Removal Rates
Due to the wide variation in sod yields, data presented in this article are expressed in lb/A per cutting, assuming that the entire area is harvested.
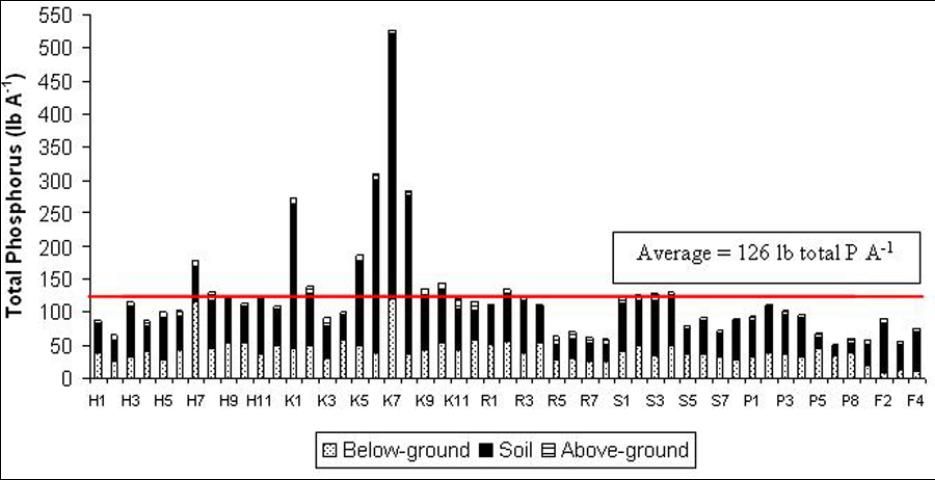
Phosphorus removal rates varied from 60 to 500 pounds of P per acre (Figure 2). These rates correspond to approximately 140 to 1,160 lb of P2O5 per acre per cut. It should be noted that this estimate assumes that the entire area is harvested or clear cut; however, in many operations just a fraction of the field is harvested for sod, so it is expected that the actual P removal rates on an acre basis will be smaller depending on the percentage of the field that is harvested. Producers may harvest up to 40,000 sq ft per acre per cutting; however, most common yields are generally between 28,000 to 38,000 sq ft per acre (McCarty, 1991). Assuming an average yield of 33,000 sq ft, P removal rates observed in our study varied from 105 to 870 lb of P2O5 per acre per cut. The current UF/IFAS P recommendations call for rates of 20 to 30 lb of P2O5 per acre for bahiagrass and 50 to 60 lb of P2O5 per acre for St. Augustine when the soil test is very low in P (Sartain, 2007). Although P removal rates may be greater than the recommended P application, higher P application rates are often not economical. In addition, there is evidence in Florida that suggests bahiagrass and St. Augustine can utilize P from deep soil layers, particularly in flatwood soils. Because soil test typically examines P availability in the top 6 inches, it is possible that deeper soil layers may also contribute to P supply to the plants. Despite these limitations, it is essential to test the soil annually to ensure adequate soil fertility and pH conditions for plant growth.

The lowest P removal rate observed in our study occurred in a field receiving no P fertilization. Greater P removal rates were obtained in fields receiving biosolids application, especially in bottomland soil types (samples K5 to K8). As expected, plant and soil samples from fertilized fields removed greater amounts of P compared to sites with minimum or no fertilization.
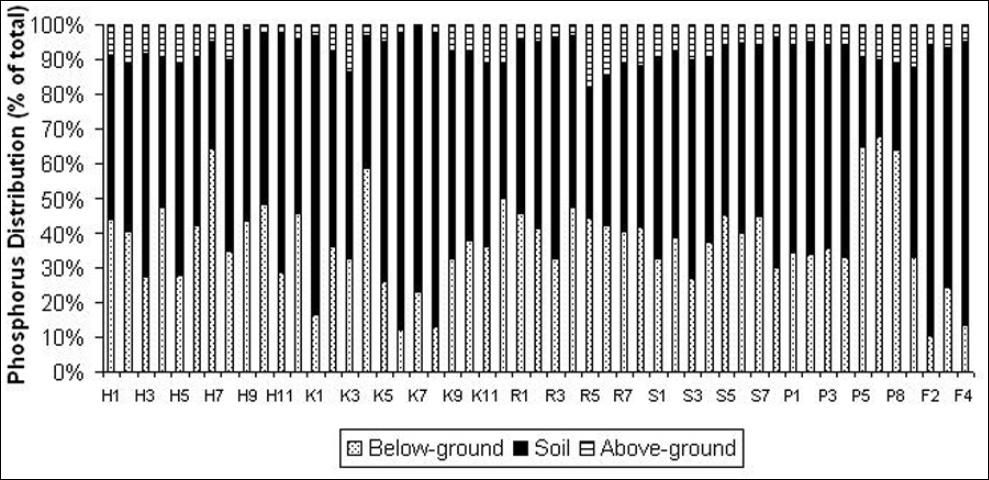
The greatest percentage of the total P removed with sod was found in the soil pool. Soil P accounted for 22 to 80% of the total P removed with the sod (Figure 3). This wide variation in the amount of P present in the soil fraction is due, in part, to differences in the harvest method and the subsequent mass of soil removed with the sod. Averaged across the 52 samples, P removed with the soil represented 54% of the total P removed. In contrast, P removed with the above-ground plant biomass accounted for 3 to 11% (average = 6%) of the total P removed. The below-ground plant biomass (primary roots, stolon, and rhizome) represented, on average, 40% of the total P removed.

This study indicated that larger amounts of soil are removed from bahiagrass fields compared to St. Augustine grass. On average, soil removal rates varied from approximately 130 to 500 metric tons per ha-1 (equivalent to ~ 116,000 to 446,000 lb soil per acre). Despite the limited information relative to the mass of soil lost with harvested sod, our results are consistent with those observed by Tesfamariam et al. (2009) in turfgrass fields in South Africa. These authors observed soil removal rates up to 300 metric tons per ha-1, with the lowest soil losses being in sites receiving biosolids. However, in our study, soil removal rates were not affected by biosolids application. Because the samples were only collected once during the growing season, further investigation is necessary to confirm the effects of species on soil removal rates. Minimizing soil removal during harvest is the key to ensure long-term productivity of the field (McCarty, 1991). Ideal moisture conditions as well as calibration of harvest equipment should be considered when harvesting the sod to reduce soil losses.
Conclusions
Sod harvest can remove significant amounts of P. Greater P removal rates occurred in areas receiving biosolids, particularly in bottomland soil types. Caution should be exercised when harvesting sod to minimize soil losses and, consequently, high P removal rates.
The results presented in this publication are only a snapshot of the potential P removal rates from sod production systems in Florida. Further studies should be conducted on different soil types and sod species to examine seasonal variability as well as the effects of fertility management and harvest procedures on P removal rates.
References
Glandon, R.P., F.C. Payne, D. McNabb, and T.R. Batterson. 1981. A comparison of rain-related phosphorus and nitrogen loading from urban, wetland, and agricultural sources. Water Research, 15:881-887.
McCarty, L.B. 1991. Sod production in Florida. Florida Cooperative Extension Service, IFAS, University of Florida. BUL 260. Available at: https://edis.ifas.ufl.edu/LH066.
Sartain, J.B. 2007. Fertility considerations for sod production. Florida Cooperative Extension Service, IFAS, University of Florida. Fact Sheet SL-52. Available at: https://edis.ifas.ufl.edu/SS164.
Silveira, M.L., M.K. Miyittah, G.A. O'Connor. 2006. Phosphorus release from a manure-impacted spodosol: effects of a water treatment residual. Journal of Environmental Quality, 35:529-541.
This project was completed with the financial support of the Florida Grazing Lands Conservaion Coalition (FGLC) and the University of Florida Institute for Food and Agricultural Sciences (UF/IFAS). The authors would like to acknowledge the sod producers who voluntarily participated in this project.