This publication is part of a series titled Soil Phosphorus Storage Capacity (SPSC) for Phosphorus Risk Assessment and Management. This series is intended for use by soil scientists, environmental consultants, state agency personnel, Extension faculty, and others who are interested in management practices and policies that minimize the risk of phosphorus loss from soils.
Introduction
The pollution of water bodies caused by phosphorus (P) loss from fertilizer or manure-impacted sandy soils has been a major and persistent environmental quality issue in many parts of Florida. In the past several years, researchers have sought convenient ways to predict potential P loss from a soil. One of these approaches involves using nutrient transport models such as the Agricultural Nutrient Model (ANIMO), the Agricultural Policy Extender model (APEX), and the Soil and Water Assessment Tool (SWAT). These models use the P bonding strength (Langmuir KL) and the Freundlich coefficient (KF) of soils to predict P release from an acid mineral soil. We describe an easy and cost-effective method to determine these parameters that can be used in models to site-specifically predict P transport.
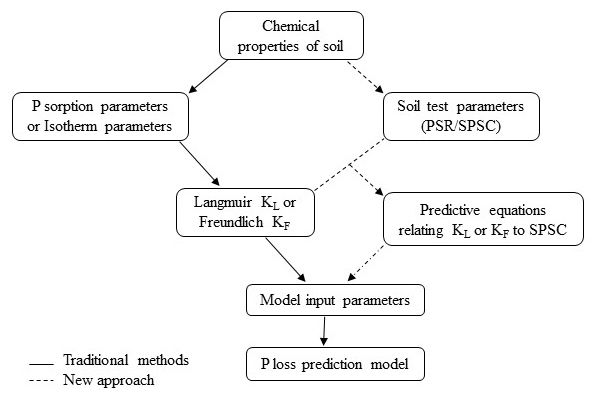
The KL and KF relate positively to concentrations of P-adsorbing components, such as oxides of iron (Fe) and aluminum (Al), for acid mineral soils. They are reduced by P loading to the soil. The dependency of P sorption on these metals is also reflected in the molar ratio of P to [Fe+Al] in an oxalate or a soil test solution, termed the Phosphorus Saturation Ratio (PSR). The PSR shows a discrete threshold, often called the "change point," at which the amount of P released from a soil increases abruptly (Nair et al. 2010). Based on the threshold PSR, another factor called the soil P storage capacity (SPSC) can be calculated to indicate the amount of P a soil can hold before becoming an environmental risk (Nair et al. 2010). All the data needed to calculate the PSR and SPSC can be obtained from routine soil extractions of P, Fe, and Al; whereas, estimation of KL and KF requires conducting time- and resource-consuming adsorption isotherms (Figure 1).

This publication describes a protocol to estimate the KL or KF of a soil using the more easily determinable PSR and SPSC parameters. The aim is to provide a relationship between isotherm parameters and values of PSR and SPSC for horizons of common soil orders in Florida and the southeastern United States (e.g., Ultisols/Alfisols/Entisols). Information in this publication will be useful for soil scientists, environmental consultants, state agency personnel, Extension faculty, lawn or farm owners, and others who need to carry risk assessment for P loss using models. The conventional and established P-loss risk assessment via mechanistic modeling can be better assessed by incorporating site-specific values of P sorption isotherm parameters (either Langmuir or Freundlich) obtained from field data rather than relying on fixed estimated values available in the literature.
How to calculate PSR and SPSC from an oxalate extractant?
The PSR of a soil from oxalate-extracted P, Fe, and Al concentrations using acid ammonium oxalate (Ox) extractant (Equation 1) (Nair 2014) can be calculated as:
[1] PSR = (Ox-P/31) / ((Ox-Fe/56) + (Ox-Al/27))
SPSC (Equation 2) can be calculated using the threshold PSR as:
[2] SPSC (mg kg-1) = (0.10 – Soil PSR)* [(Ox-Fe /56) + (Ox-Al /27)] * 31
How to obtain KL and KF from PSR and SPSC?
The Langmuir KL and the Freundlich KF were calculated from the modified Langmuir isotherm model (Equation 3) and non-linear Freundlich isotherm model (Equation 4), respectively (Nair and Reddy 2013) as:
[3] S = (Smax KLC)/(1 + KLC)
or C/S = 1/KLSmax + C/ Smax
Where, S = S'+S0, the total amount of P sorbed (mg kg-1),
S' = P sorbed by the soil solid phase (mg kg-1),
S0 = Originally sorbed P on the soil solid phase (mg kg-1),
C = Concentration of P after 24 h equilibration (mg L-1),
Smax = P sorption maximum (mg kg-1),
KL = A constant related to bonding energy (L mg-1),
[4] A = KF C N
Where, A = amount of adsorbate adsorbed per unit mass of solid (mg kg-1),
C = equilibrium solution concentration of the adsorbate (mg L-1),
KF = Freundlich coefficient,
N = empirical constant.
Soil samples with varying P-impact levels from four manure-impacted sites were collected by horizon (Ap, E, and Bt) to develop the predictive equations. A plot of KL vs. PSR (Figure 2A) showed that P bonding strength is high and variable below the threshold PSR and gradually decreases and approaches zero once the threshold value of PSR is reached. A similar trend was observed for KF vs. PSR (Figure 2B). The KL vs. SPSC relationship could provide a better risk estimation compared with the corresponding relationship with PSR because SPSC considers the P that may be added to a soil before reaching the threshold PSR of 0.10 (Nair and Harris 2014). The Langmuir KL increased with positive SPSC (Figure 3A), but such a trend was not evident for the KL vs. PSR relationship (Figure 2A) or when SPSC is negative such that KL is essentially zero. The KF vs. SPSC relationship gives two linear equations, one for positive SPSC and the other for negative SPSC (Figure 3B) independent of the horizon designations. The developed predictive equations are summarized in Table 1.
![Figure 2 Figure 2. Relationships between isotherm parameters [(A) KL & (B) KF] and P saturation ratio (PSR) for specified horizons from Ultisols/Entisols/Alfisols (n=108).](/image/SS656/12517780/1356714/1356714-2048.webp)
Credit: Dari et al. (2015)
![Figure 3 Figure 3. Relationship between isotherm parameters [(A) KL & (B) KF] and soil P storage capacity (SPSC) for specified horizons from Ultisols, Entisols, and Alfisols.](/image/SS656/12517780/3377676/3377676-2048.webp)
Credit: Dari et al. (2015)
Prediction equations for isotherm "K" values developed using a SPSC-K relationship for Ultisol soil profiles with SPSC calculated from oxalate P, Fe and Al (Adapted from Dari et al. 2015).
Can we obtain SPSC from soil test data?
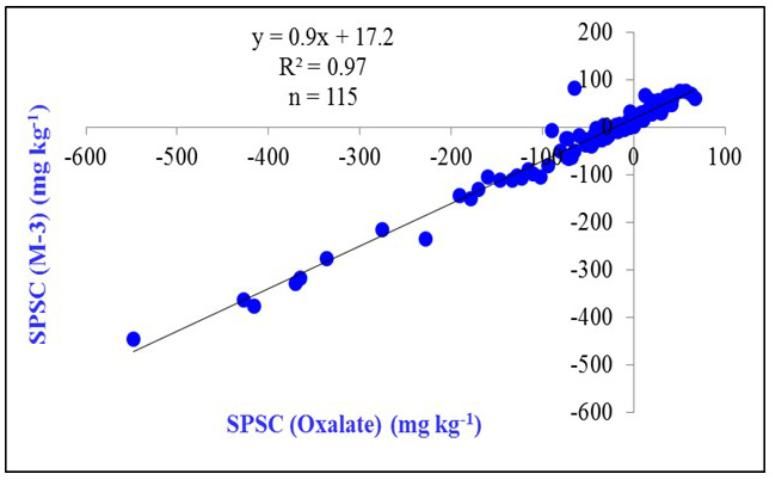
The relationship of SPSC calculated from oxalate P, Fe, and Al can also be obtained from soil test solutions such as Mehlich 3 (Figure 4). Deriving the SPSC from soil tests is a practical advantage since soil tests are readily and routinely determined.

Credit: Dari et al. (2015)
Application of Predictive Equations
Predictive equations (Table 1) provide a practical and accurate means of estimating KL and KF from the soil test P, Fe, and Al used in PSR and SPSC calculations. This faster, more cost-effective means of obtaining these adsorption parameters can enable more detailed, site-specific modeling of P dynamics and potential transport from surface and subsurface environments of soils impacted by manures and commercial fertilizers.
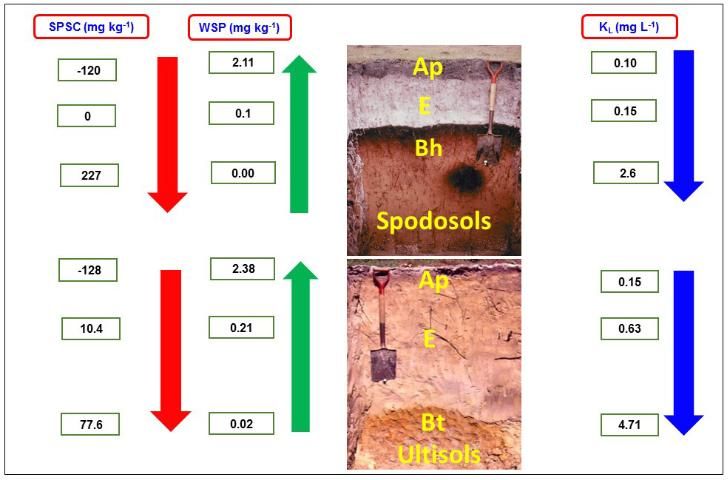
It is important to understand the relations between P bonding strength, SPSC, and amount of P extracted with water i.e., water soluble P (WSP). The WSP is a surrogate measure of relative P concentration in soil solution or runoff from an agricultural field. Figure 5 shows a typical relationship between SPSC, WSP, and the isotherm parameter KL, with respect to P movement down a soil profile. Examples selected for illustration are for two typical Florida soil profiles, a Spodosol and an Ultisol profile. Spodosols have sandy A horizons with little organic matter, non-coated sandy E horizons, and Bh horizons that have organic matter-metal (mainly Al) complexation. The Bh horizon has strong P binding compared to the A and E horizons due to a greater abundance of organo-metal components with high affinity for P. Similarly, the Bt horizon of Ultisols has a high P bonding strength compared to A and E horizons because of its higher concentration of metal oxides. The highest bonding strength is associated with lower WSP values and can be attributed to more positive SPSC values at a lower depth of both soils. The surface soil layer has lower P bonding strength, resulting in higher WSP and negative SPSC. Information about these parameters is an effective tool for protecting Florida water quality given the problem of eutrophication (pollution from fertilizer) and water quality deterioration. The Langmuir KL or KF obtained from soil test data can be input into P loss predictive models to capture the effects of varying P retention capacities between soils and with depth within soil profiles.

Credit: Data for SPSC, WSP, and KL were obtained from Dari et al. (2015). Soil photographs were part of a collection compiled during the Florida Cooperative Soil Survey Program. We are indebted to the soil scientists associated with that program whose efforts resulted in the availability of these images.
Acknowledgements
Archived soils used in this study were collected with partial support from the Florida Department of Environmental Protection and the USDA—IFAFS. Support from the USDA—Hatch Funds for various soil analyses is gratefully acknowledged. The authors would also like to thank Don Graetz, Myrlene Chrysostome, and lab personnel for their help with soil sampling, and Debolina Chakraborty and Dawn Lucas for help with the analytical procedures. The authors thank Ed Hanlon and Rishi Prasad for their comments and suggestions on an earlier version of this document.
References
Dari, B., V. D. Nair, J. Colee, W. G. Harris, and R. Mylavarapu. 2015. "Estimation of phosphorus isotherm parameters: a simple and cost-effective procedure." Frontiers in Environmental Science, 3:70. doi.org/10.3389/fenvs.2015.00070.
Nair, V.D., 2014. "Soil phosphorus saturation ratio for risk assessment in land use systems." Frontiers in Environmental Science. 2:6. doi:10.3389/fenvs.2014.00006.
Nair, V. D., and W. G. Harris. 2014. "Soil phosphorus storage capacity for environmental risk assessment." Advances in Agriculture. 1–10. doi:10.1155/2014/723064.
Nair, V. D., and Reddy, K. R. (2013). Phosphorus sorption and desorption in wetland soils. In: DeLaune, R., Reddy, K.R., Richardson, C.J., and Megonigal, P. (ed). Methods in biogeochemistry of wetlands. Soil Science Society of America Publication. 667–678.
Nair, V. D., W. G. Harris, and D. Chakraborty. 2010. An Indicator for Risk of Phosphorus Loss from Sandy Soils. SL333. Gainesville: University of Florida Institute of Food and Agricultural Sciences. https://edis.ifas.ufl.edu/ss539.
Nair, V. D., W. G. Harris, D. Chakraborty, and M Chrysostome. 2010. Understanding Soil Phosphorus Storage Capacity. SL336. Gainesville: University of Florida Institute of Food and Agricultural Sciences. https://edis.ifas.ufl.edu/ss541.