The chapter on irrigation management of citrus is largely taken from guidelines provided in SL253 on trees prior to Huanglongbing (HLB) prevalent conditions. A section has been added to cover recent findings on water use of trees affected by HLB and the impact this would have on the irrigation management considerations.
Water Supply
Water is a limiting factor in Florida citrus production during the majority of the year because of the low water holding capacity of our sandy soils resulting from low clay content and the non-uniform distribution of the rainfall. In Florida, the major portion of rainfall comes in June through September. However, rainfall is scarce during the dry period from February through May, which coincides with the critical stages of bloom, leaf expansion, fruit set, and fruit enlargement. Irrigation is practiced to provide water when rainfall is not sufficient or timely to meet water needs. Adequate irrigation management is key to optimize water use and increase crop yield. Several weather-, soil-, and plant-based methods are available for irrigation management. The most used methods rely on weather stations to calculate evapotranspiration (ET), the combination of water lost by plant transpiration and removal of water from soils and wet surfaces by evaporation. Thus, ET is a dominating factor in the water use for agricultural production systems. Therefore, ET plays a critical role in agricultural irrigation management.
Allowable Soil Water Depletion
As soil dries out, water becomes increasingly difficult for trees to remove, which can eventually cause water stress. Tree health and yield will suffer if the soil is allowed to get too dry. To provide adequate water for flowering, fruit set, and vegetative growth, maximum soil water depletion should not exceed 25–33% of available water from February to June. The percentage of available water can be measured with commercially available soil moisture sensors. Once the rainy season starts, the maximum depletion can be increased to 50-66% of available water. This additional allowable depletion increases the capacity of the soil to hold rainfall without leaching nutrients or any applied chemicals. The same depletion in the fall and winter months will save water without reduction in yield.
Irrigation Scheduling
Irrigation strategies must be documented and practiced to allow growers to maintain or increase crop production without depleting our water resources. Increase in water use efficiency is achieved by selecting a proper irrigation scheduling method and application timing. Proper irrigation scheduling applies an appropriate volume of water to a citrus grove at the appropriate time based on tree need, soil properties, and weather conditions. With proper irrigation scheduling, yield will not be limited by water stress. Successful irrigation management maintains sufficient water and nutrients in the root zone to maximize plant growth and health. Growers who focus on improving water and nutrient use efficiency simultaneously will reduce nutrient losses and decrease environmental impacts. While some nutrient loss is unavoidable due to excess rainfall, loss due to management decisions can be minimized.
Current UF/IFAS citrus irrigation recommendations estimate citrus tree water requirements for mature trees using data collected prior to introduction of HLB into Florida. Citrus trees affected by HLB are known to lose substantial foliage and up to 80% of the root mass depending on disease severity, thus negatively impacting the ability of HLB-affected trees in water and nutrient uptake. Accurate estimation of citrus water use could improve irrigation management of HLB-affected citrus trees, conserve water, and reduce loss of nutrients from excess irrigation.
The commonly used methods of irrigation management include soil moisture measurement, water budgeting, and smartphone apps.
Soil Moisture Measurement
Experience or the calendar method can provide a reasonably good irrigation schedule, but are not accurate enough to maximize water use efficiency and prevent nutrient leaching. Using soil moisture sensors (Figure 1) improves accuracy because they quantitatively measure changes in soil water status. These devices may be fixed in one location, portable, or hand-held. They may measure soil moisture at one depth or at multiple depths. General categories include:
-
Tensiometers
-
Electrical resistance blocks
-
Time domain reflectometry (TDR) probes
-
Capacitance probes
Considerations when using soil moisture sensors to schedule irrigation include:
-
Knowing the soil water-holding capacity and tree root zone depth.
-
Placing sensors where the majority of roots are located (typically in the top 12 inches), such as at the dripline of the tree.
-
Using multiple sensors, both across the grove and with depth, to fully characterize the tree root zone.
-
Moving sensors to follow root growth as the tree canopy expands in developing groves.
-
Basing irrigation on the soil depth containing the greatest root density.
-
Managing root zone soil moisture between field capacity and the maximum allowable water depletion (one-fourth to two-thirds depletion, depending on time of the year).
-
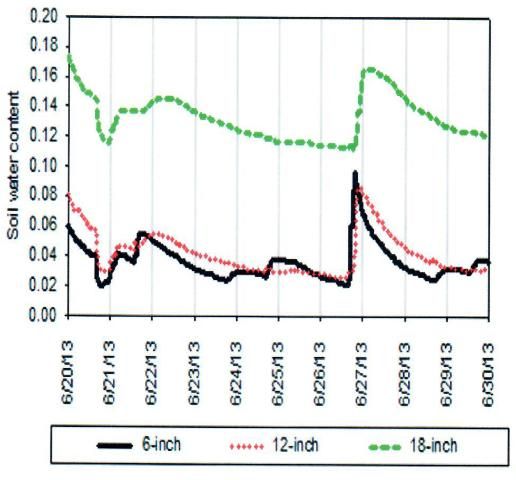
Figure 1. Continuous monitoring of soil moisture at 6-, 12-, and 18-inch depths in the soil by a multi-level capacitance probe installed in the root zone of a mature citrus tree.
Water Budgeting
An alternative method to schedule irrigation uses a computer program that estimates tree water consumption (evapotranspiration, or ET) from weather data. Reference ET and convenient irrigation scheduling management tools for all Florida citrus production regions can be found on the Florida Automated Weather Network (FAWN) website at http://fawn.ifas.ufl.edu.
Smartphone Apps
Mobile smart devices (e.g., smart phones, tablets) have become popular because of their convenience and ease of use, making them ideal for disseminating information on a regular basis with real-time data. Tools developed for use on mobile smart devices are typically called "apps" and are available for a variety of functions. Due to the increasing popularity of smartphones and apps, FAWN developed an app for the iPhone and Android platforms that allows users to view data from grower-owned weather stations-provided as a cost share from the Florida Department of Agriculture and Consumer Services-on their smartphones in much the same way that they can view the data on the FAWN webpage. UF/IFAS has also developed smartphone apps for crop irrigation scheduling using FAWN weather data. The goal is to provide users with an easy-to-use mobile app to access information that would improve irrigation scheduling for a wide range of crops, including citrus. By using the app instead of a set time-based schedule for irrigation, more accurate irrigation is provided. Using the apps to modify the irrigation schedule has the potential of reducing water and fertilizer use, resulting in reduced irrigation and fertilizer costs and the potential of further reducing nutrient leaching. The FAWN and irrigation scheduling apps are available to download in the App Store and Play Store at no cost.
Irrigation Strategies to Improve Nutrient Uptake and Reduce Leaching
Developing an irrigation strategy to reduce nutrient leaching has the objective of not applying more irrigation water than the root zone can hold. Considering the low water-holding capacity of citrus grove soils, this objective is very difficult to accomplish even for the most experienced and diligent irrigation managers. The major questions to be answered in this procedure are:
-
How much water can the root zone hold?
-
What is the maximum irrigation system run time before leaching occurs?
Example
We have a central ridge citrus grove with the following characteristics:
-
Tree spacing—12½ ft in-row x 25 ft between rows.
-
Tree canopy diameter—17½ ft.
-
Root zone depth—3 ft.
-
One 16 gal/hr micro-sprinkler per tree with a 16-ft diameter wetted pattern.
-
The citrus root zone is continuous from tree to tree, existing both inside and outside of the wetted pattern.
-
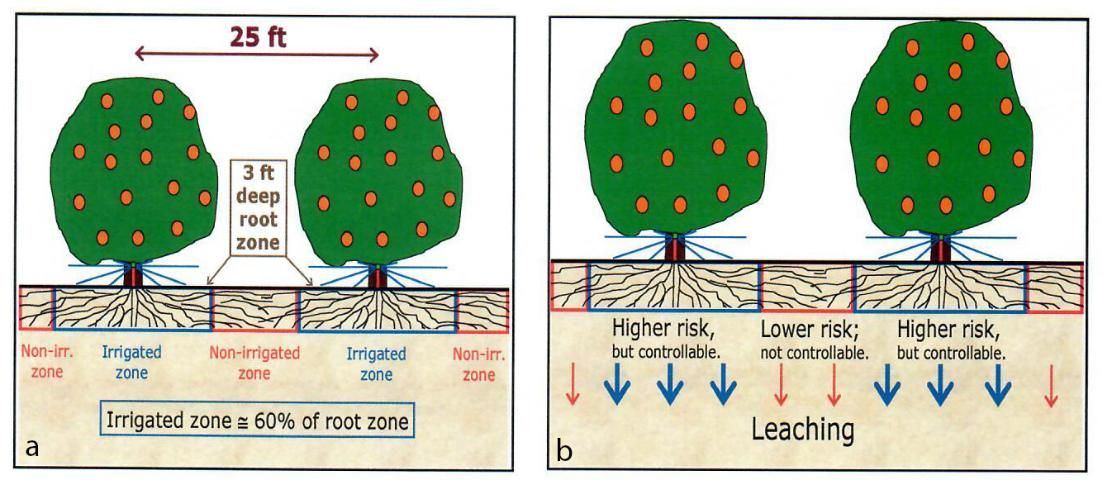
The irrigated system wets approximately 60% of the total root zone (Figure 2a).
Nutrient leaching risk in this grove is higher within the wetted pattern due to potential over-irrigation, plus the fact that most fertilizers are applied to that zone (Figure 2b). A good irrigation manager will control this risk with careful water management.
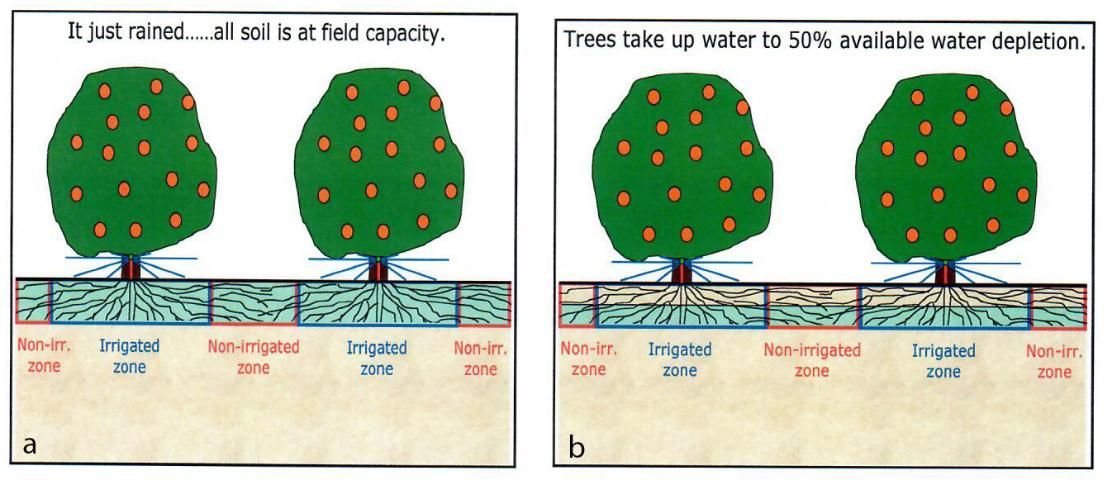
This example starts with the entire grove at field capacity moisture content following a heavy rain (Figure 2b). The citrus trees begin to remove water from the soil in response to the atmospheric ET demand. After several days have passed (depending on time of year), the water content in the root zone decreases to 50% of available water capacity (Figure 3a).
At this point, the grove manager turns on the irrigation system and operates it long enough to return the soil in the wetted pattern back to field capacity (Figure 3b). From this point until the next significant rainfall, the manager can only influence the soil water content in the irrigated zone. The water content in the non-irrigated zone rapidly decreases to the point where little to no soil water can be extracted by the tree.
If the grove manager operates the irrigation system too long and applies more water than the soil can hold, water will move beneath citrus tree roots. If water-soluble nutrients like nitrate or potassium are present in the irrigated zone during the irrigation period, a portion will leach.
How much water can the root zone hold?
-
Central ridge soils—0.3 to 0.7 inches/ft
-
Flatwoods soils—0.3 to 1.2 inches/ft
What is the maximum system run time before leaching occurs?
Calculations
-
Volume of water the root zone can hold: 0.6 inches/ft x 3 ft deep root zone = 1.8 inches
-
Volume of water to refill at maximum depletion: 1.8 inches x 50% = 0.9 inches
-
Volume of water this represents per tree space: 0.9 inches/tree x 1 ft/12 in x (25 ft x 12½ ft) x 7.5 gal/ft3 x 60% coverage = 105 gal/tree
-
Maximum system run time: 105 gal / 16 gal/hr emitter flow rate = 6.6 hr
-
Adjust for system irrigation efficiency of 90%: 6.6 hr / 0.9 = 7.3 hr
Therefore, the irrigation system should never be run longer than about 7 hours for any single cycle, provided that the available soil water is at least 50% depleted (the percentage of depleted water can be measured with commercially available soil moisture sensors) when the irrigation begins.
Irrigation Management Considerations for HLB-Affected Trees
With HLB, irrigation scheduling is becoming more important and critical and growers cannot afford water stress or water excess. Any degree of water stress or imbalance can produce a deleterious change in physiological activity of growth and production of citrus trees. The number of fruits, fruit size, and tree canopy are reduced and premature fruit drop is increased with water stress. Extension growth in shoots and roots and leaf expansion are all negatively impacted by water stress. Other benefits of proper irrigation scheduling include reduced loss of nutrients from leaching as a result of excess water applications and reduced pollution of groundwater or surface waters from the leaching of nutrients.
Three studies were conducted in Florida from 2011 to 2015 with the objective of determining the 1) effectiveness of ET-based irrigation scheduling on HLB-affected citrus trees, 2) irrigation requirements of HLB-affected citrus trees compared with healthy trees, and 3) effect of scheduling on productivity of citrus trees affected with HLB.
Conclusions of the first study indicate water use with soil moisture sensors and ET-based models reduced average monthly water use by approximately 14% from the conventional irrigation practice2 without reducing yields. Results of a second trial using greenhouse lysimeters indicated that healthy trees consumed approximately 25% more water than HLB-affected trees (Table 1). Reduced water uptake by HLB-affected trees resulted in significantly greater soil water content. The relationship between leaf area and water uptake indicated that diseased trees with thin canopy density and corresponding lower leaf area index took up less water and thus less nutrients from the soil, resulting in potentially even thinner canopies. These results indicate that irrigation amounts would depend on canopy density, and elevated soil water content may partially explain elevated Phytophthora spp. infection of HLB-affected trees.
The third experiment was conducted in three commercial groves on Ridge and Flatwoods soils. Irrigation schedules consisted of current UF/IFAS ET-based recommendation, daily irrigation, and an intermediate schedule, all using the same amount of water on an annual basis. The UF/IFAS schedule was determined weekly using the Citrus Irrigation Scheduler found at the Florida Automated Weather Network (FAWN) website (http://fawn.ifas.ufl.edu/tools/irrigation/citrus/scheduler/), and resulted in irrigation schedules as frequently as daily in May and as infrequently as every 10–14 days in the winter. Daily irrigation schedules were determined by dividing the UF/IFAS irrigation duration by the number of days between irrigations. The intermediate was about half the UF/IFAS interval for about half the time. Daily irrigation increased tree water uptake and soil water content. Daily and intermediate irrigation increased canopy density as measured by leaf area index. Fruit drop per square foot of under-canopy area was lower for daily irrigation schedules in the second year of the study, but yields were similar among all irrigation schedules.
For HLB-affected trees, irrigation frequency should increase and irrigation amounts should decrease to minimize water stress from drought stress or water excess, while ensuring optimal water availability in the root zone at all times. It is recommended that growers maintain soil moisture in the root zone (top 3 feet for ridge and 18 inches for flatwoods soils) using soil moisture sensors or irrigation apps. The FAWN and SmartIrrigation app provide the option of daily irrigation schedules. As noted above, HLB-affected trees with thin canopies use less water than do healthy trees. Therefore, if the irrigation scheduling app is used, the irrigation time should be reduced by 10–20%. For example, if the app suggests an irrigation time of 1 hour, this time could be reduced by 6 to 12 minutes for HLB-affected trees.
Notes
1 Note: Figures 2–3 were illustrations included in SL253 chapter 9. The illustrations of water content changes in the citrus tree root zone (Figure 3) do not represent the actual water extraction pattern. The blue shading shows 1) approximately where water extraction occurs beneath the canopy, and 2) the relative soil water content with respect to available soil water-holding capacity.
2 Conventional irrigation practice for Florida citrus refers to use of micro-sprinkler irrigation based on replacing the citrus seasonal tree water requirements using Florida Automated Weather Network data.
Further Reading
Kadyampakeni, D. M., K. T. Morgan, A. W. Schumann, P. Nkedi-Kizza, and T. A. Obreza. 2014a. "Water use in drip and micro-sprinkler irrigated citrus trees." SSSA J. 78(4): 1351–1361.
Kadyampakeni, D. M., K. T. Morgan, A. W. Schumann, and P. Nkedi-Kizza. 2014b. "Effect of irrigation pattern and timing on root density of young citrus trees infected with Huanglongbing disease." Hort. Tech. 24(2): 209–221.
Migliaccio, K.W., K.T. Morgan, G. Vellidis, L. Zotarelli, C. Fraisse, B.A. Zurweller, J.H. Andreis, J.H. Crane, and D.L. Rowland. 2016. "Smartphone apps for irrigation scheduling." Trans. ASABE. 59(1): 291–301.
Morgan, K.T. and T.A. Obreza. 2008. "Irrigation Management to Improve Nutrient Uptake." In Nutrition of Florida citrus trees, SL253. 60–63, 100. Gainesville: University of Florida Institute of Food and Agricultural Sciences.
Morgan, K.T., T.A. Obreza, J.M.S. Scholberg, L.R. Parsons, and T.A. Wheaton. 2006. "Citrus water uptake dynamics on a sandy Florida Entisol." Soil Science Society of America Journal. 70(1): 90–97.