Introduction
Effective irrigation water management begins with accurate water measurement. Water measurement is required to determine both total volumes of water and flow rates pumped. Measurement of volumes will verify that the proper amount of water is applied at each irrigation and that amounts permitted by water management districts are not exceeded. Flow rate measurements help to ensure that the irrigation system is operating properly. For example, lower than normal flow rates may indicate the need for pump repair or adjustment, partially closed or obstructed valves or pipelines, or clogged drip emitters. Higher than normal flow rates may indicate broken pipelines, defective flush valves, too many zones operating simultaneously, or eroded sprinkler nozzles.
Depth and Volume
Pumping rate, application rate, or tree water use rate is measured in units of volume (or depth) per unit of time. Volume can be calculated from the depth applied if the area to which the water is applied is known. The volume can also be calculated by multiplying the flow rate (gallons per minute = gpm) by the duration of flow (min). The depth of application is calculated by multiplying the application rate (inches/hr) by the duration of application (hr). Velocity refers to the speed at which water flows (distance per unit time) as opposed to flow rate (volume per unit time). Thus, the terms flow rate and velocity cannot be used interchangeably. Both the velocity and cross-sectional area of flow must be known in order to calculate flow rates.
Volume (V) is commonly expressed as gallons, acre-inches (ac-in), and acre-feet (ac-ft). An acre-inch is the volume of water that would be required to cover an area of 1 acre to a depth of 1 inch. The relationships among these units are:
1 acre-inch = 27,154 gallons = 102,642 liters = 102.8 cubic meters (m3)
1 acre-foot = 12 acre-inches = 12.34 ha-cm
1 acre-foot = 325,848 gallons = 1233.5 cubic meters
Depth (D) units are used to express soil moisture (e.g., water-holding capacity expressed as inches of water per foot of soil depth) and irrigations are scheduled after a fraction of the soil water in the tree or plant root zone has been depleted.
Example: Calculate the amount of water to be applied per irrigation for the following conditions:
Fine sand soil with 0.75 in/ft available water-holding capacity (AWHC). AWHC is calculated as water available at field capacity minus the water available at wilting point. The root zone depth is 2.0 ft and irrigations are scheduled at 50% depletion of AWHC.
Total soil water storage is calculated as:
Dstored = 0.75 in/ft x 2 ft soil depth = 1.5 in
Amount to be applied per irrigation is:
Dirrigation = 50% x 1.5 in = 0.75 in
Note that the amount of water to be pumped will need to be greater than the 0.75 inches needed to be stored in the plant's root zone since some water will be lost during application. Application efficiencies are always less than 100% because of water losses due to factors such as evaporation, wind drift, and nonuniform water application.
Depth units are also convenient for comparison with rainfall depths. For example, a 1-inch rainfall would supply the same volume of water as a 1-inch irrigation. Evapotranspiration (ET) rates are also usually expressed in inches per day.
Example: For a tree with an ET rate of 0.20 in/day and the root zone that holds 1.2 inches , calculate the irrigation interval for an allowable soil water depletion of 50%.
1.2 inch x 50% / 0.20 inch/day = 3 days
The irrigation would be required early on the 4th day to avoid depleting more than 50% of the available soil water in the root zone.
When irrigation amounts are expressed as depths, it means that the depth is to be applied over the entire area to be irrigated.
Example: For an irrigated area that is 1.0 acre and an applied depth of 1.0 inch, calculate the volume applied.
V = depth x area
= 1.0 inch depth x 1.0 acre = 1.0 ac-in or 27,154 gallons
If the irrigated area was 20 acres, the volume of water applied would be:
V = 20 ac x 1.0 inch = 20 ac-in
20 ac-in x 27,154 gal/ac-in = 543,080 gal
Thus, depth units are used interchangeably with volume units because it is convenient to use depth units when referring to soil water depletion, rainfall, and plant ET rates. However, when referring to amounts of water permitted or pumped, volume units are preferred.
Flow rate (Q) is defined as the volume of water per unit of time flowing past a point in the system. Commonly used units for flow rate are gallons per minute (gal/min or gpm) and acre-inches per hour (ac-in/hr). Equivalent units in metric systems will be cubic meter per hr (1 cubic meter/hr = 4.40 gpm) and hectare–cm/hr (1 hectare-cm/hr = 9728 ac-in/hr). Water management district consumptive use permits are often expressed in units of million gallons per day (mgd). For estimating storm water runoff, cubic feet per second (cfs) is used.
The relationships between these units are:
1 gal/min (gpm) = 0.00221 ac-in/hr
1 gpm = 0.00144 mgd
1 ac-in/hr = 453 gpm = 0.652 mgd
1 mgd = 694.4 gpm = 1.53 ac-in/hr
1 cfs = 448 gpm
Since flow rate is volume per unit time, the volume of water applied during irrigation can be calculated if the flow rate and irrigation duration (time) are known.
Example: Find the volume of water applied and depth of application for a pump that discharges 800 gpm for a duration of 4 hours.
The volume of water applied is:
V = 800 gpm x 60 min/hr x 4 hr = 192,000 gal
or V = 192,000 gal / 27,154 gal/ac-in = 7.1 ac-in
The depth of water applied can be calculated by multiplying the application rate by the duration of irrigation. An application rate of 0. 10 in/hr with a 6 hr irrigation duration results in a gross depth of water applied of 0.6 inches (D = 0. 10 in/hr x 6 hr = 0.6 inches).
Note that the actual depth of water stored in the tree's root zone and available for plant use would be less than 0.6 inches because of water losses during application. A typical application efficiency for microsprinkler irrigation systems is 85% for Florida conditions. Thus, only 0.51 inches (0.6 inches x 85% = 0.51 inches) of the 0.6 inches pumped would be expected to be stored in the root zone and available for plant use. To supply 0.6 in of water in the root zone, 0.71 in (100/85 x 0.6 in) of pumped water will be needed.
Devices and Techniques for Measuring Flow
Accuracy
Measurement accuracy is the difference between the true flow and the flow measured with a meter. The measured flow should be as close as possible to the actual amount of water flowing in the pipe. Most irrigation meters should have an accuracy of + 2.0% of the actual amount. The accuracy for a meter may be specified as a percentage of actual rate or as a percent of full scale. In most instances, flowmeters with rate accuracy should be selected. If a flowmeter is operated above or below its recommended range, the accuracy may be reduced.
Inserting a propeller into the water flow will cause friction, resulting in pressure or head losses in the pipeline. The pressure loss depends on the velocity and pipe diameter (flow rate). The higher the flow rate, the more pressure will be lost due to the flowmeter. Pressure losses from the propeller meters are generally small. For example, with a ten-inch diameter flowmeter, the pressure loss is typically less than 1 psi when flow rates are less then 2,000 gpm.
Since propeller meters are mechanical devices and have moving parts, a scheduled maintenance program is recommended. Most installations have no power or communication ability; therefore, a user must visually inspect his/her meters on site. Often the inaccuracies of a propeller flowmeter arise from mechanical problems that are easily discovered. If a propeller meter is inaccurate, it is often a mechanical problem. Often times, inaccurate flow measurements in propeller meters result from debris lodged inside the meter. If electronic registers are used with the meter, signal and all connections should be checked carefully. Small problems in electrical parts can make the measurement system inaccurate.
When checking an unfamiliar meter, the manufacturer's recommendations should be followed to ensure that the meter is properly installed. The instruction, operation, and maintenance manual should be reviewed for details regarding the requirement for straight pipe lengths before and after the meter. Recommended maintenance should be undertaken according to the manual's suggestions. For propeller meters, the pipeline must remain full of water. If the pipe is sloped, errors will be introduced due to the lack of a completely full pipe under certain flow conditions.
If field checks fail to identify the cause of measurements inaccuracies, a full calibration of the meter is required. This normally necessitates removing the meter from the line and sending it to a calibration laboratory. The propeller meters should be calibrated on a test rig that has been calibrated at the National Institute of Standards and Technology (NIST). The laboratory accuracy should be four times as accurate as the meter tested. For a meter with an accuracy of + 2%, the laboratory should have an accuracy rate of at least + 0.5%.
Flowmeters
Flowmeters are one of the key components of a microirrigation system. Flowmeters are critical for managing irrigation efficiently and for monitoring system performance. Managing irrigation efficiently requires knowing how much water the crop has used since the last irrigation (irrigation scheduling) and operating the irrigation system to apply the required amount of water. Flowmeters provide the information necessary to apply the correct amount of water.
Monitoring the performance of an irrigation system makes it possible to identify changes in flow rate during the season (measured at the same pressure). This change may indicate problems such as clogging of emitters or filters, leaks in the system, or problems with the pump or well. The rate of water flow in an irrigation system depends on a variety of hydraulic factor as well as pump and system constraints. Table 1 lists typical flow rate ranges for common pipe sizes. Various types of flowmeters are available in the market. These flowmeters vary in their installation, maintenance, accuracy, cost, and other factors. Major types of the flowmeters commonly used in irrigation and drainage are discussed below.
Propeller Meters
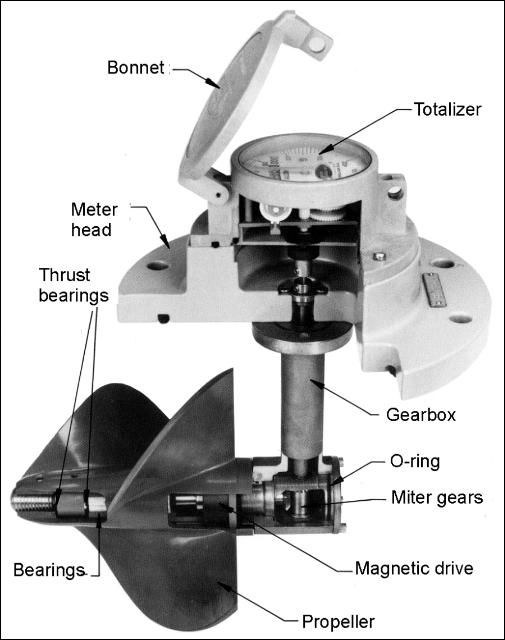
Propeller meters are the most commonly used type of water measurement devices in irrigation systems (Figure 1). Propeller meters need to be installed in straight sections of pipeline according to manufacturer's recommendations. To minimize turbulence and the resulting inaccuracies caused by elbows, valves, and other fittings flowmeters should have at least a distance of 10 times the pipe diameter upstream of the meter free of obstructions (straight pipe). In addition, there should also be a distance of 5 pipe diameters of straight pipe downstream of the meter (Table 2).
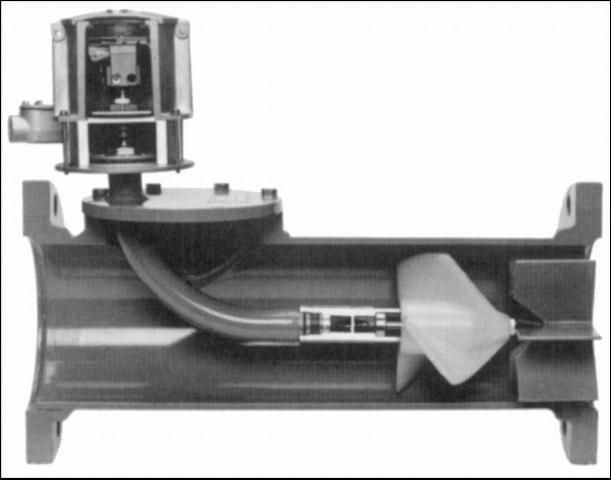
If the required upstream and downstream unobstructed distances cannot be met, straightening vanes (Figure 2) may be used to minimize the effects of turbulence caused by obstructions. For accurate measurement the pipe must flow full. The readout of the flowmeter is through direct gears, cable connections, or magnetic drives. Models are available with both total and instantaneous flow rate measurements. Propeller meters are typically accurate to within two percent when new.
Example
Determine the minimum distance downstream from an elbow required for installing a flowmeter in a 12 inch class 160 PVC pipe (inside diameter = 11.77 in.).
Upstream distance = 10 x 11.77 in. = 118 in.
Downstream distance = 5 x 11.77 in. = 59 in.
Note: due to the high upstream distances required for large pipe diameters, most installations in agricultural microirrigation systems utilize straightening vanes.
It is important to be aware that propeller meters have some potential problems. Debris in the water may entangle or damage the propeller and affect its operation. Many times the meter continues to register, however the rates registered are less than the true rate. If the debris is sufficient, the meter may fail to register completely. There is a small amount of pressure lost as water flows through the meter (typically 2 psi or less if the meter is of proper size).
These drawbacks in propeller meters are minor. In fact, debris that might affect the propeller meter would also clog the emitters and is therefore usually filtered out. Pressure losses caused by the meter can be compensated for in the irrigation system design. Propeller meters are the meter of choice for the irrigation market for several reasons. They are intended to measure water flow rates mechanically and typically indicate instantaneous flow rate and total volume. Because the reading is purely mechanical, it requires no power. The meters can be used in remote areas where power is not available. Propeller meters can be fitted with different types of electronic readouts and outputs. Propeller meters are relatively low cost and can be used economically even if the service need is short. With a typical accuracy of + 2% of rate, the propeller meter gives irrigation users excellent control and accountability of their water. If needed, the meters can be made of high stainless steels for harsh environments.
The propeller should be lightweight so it can respond to fast changes in the flow rates without inertial problems, and stiff enough to resist bending under fast-changing conditions. Friction in the drive system of the meter should be minimal to allow accurate measurement at low velocity ranges of the meter. The propeller must also measure most of the pipe area (full bore measurement) to ensure accurate readings.
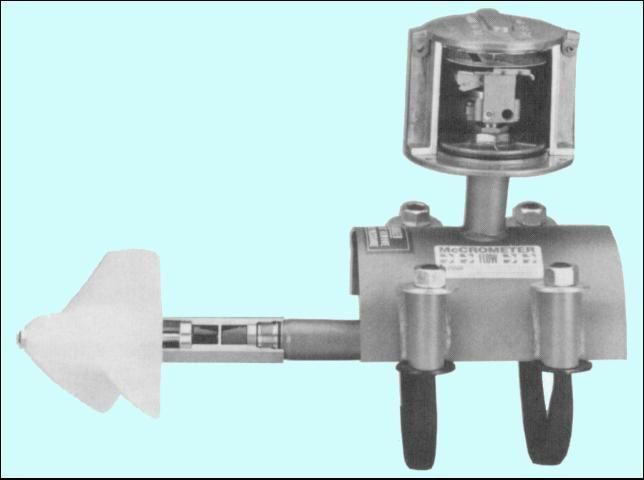
Propeller flowmeters normally have a propeller linked with a cable or shafts and gears to flow indicator. These flowmeters can be installed in several different ways. It can be inserted into a short section of pipe, which is then either welded or bolted into the pipeline. Designs are available which allow the meter to be clamped (Figure 3), strapped, or welded onto the pipeline as a saddle-type meter or to be inserted into the pipe discharge. Propeller meters can also be installed as in-line meters in a short section of portable pipe. Couplings are welded onto each end of the flowmeter pipe section to connect sections of the portable pipe.
Propeller meters must be matched to the correct pipe size since the gear mechanism connecting the propeller to the indicator is based on the pipe diameter and the anticipated flow rate. Table 1 lists maximum and minimum flow rates for various pipe diameters. Most flow rate indicators report in gallons per minute or in cubic feet per second, while total flow indicators (totalizers) report in gallons, acre-feet, or cubic feet. Some indicators report in metric units.
The flowmeter should be installed at a location of minimal water turbulence since too much turbulence will cause the flow rate indicator to oscillate wildly, causing unreliable measurement. A centrifugal sand separator or a series of elbows in the pipeline may cause a swirl or rotation in the flowing water. These swirls may be present even at one hundred pipe diameters downstream. The remedy is to place straightening vanes in the pipeline just in front of the flowmeter (Figure 2). Reliable measurements can normally be made with even short sections of pipe if straightening vanes are used.
A relatively stable rate indicator reading means that turbulence is minimal. Wide variations in indicator readings are a symptom of turbulence in the pipeline. If the readings are extremely erratic, air or gas may be present in the water. Propeller flowmeters operate properly only if the pipe is flowing full. If the pipe is partially full, the flow rate measurement will not be accurate. In pressurized irrigation systems, flow will usually be full at the pump discharge, but in the pumps with an open discharge, as into an irrigation ditch, pipe flow may not be full. This problem can be remedied by creating a slight rise in the pipe, installing a gooseneck at the pipe discharge, or by installing an elbow (discharge end pointing upward at the pipe discharge). Recommended upstream distance of straight pipe should be followed to minimize effects of obstructions on flowmeter accuracy.
Magnetic Flowmeters
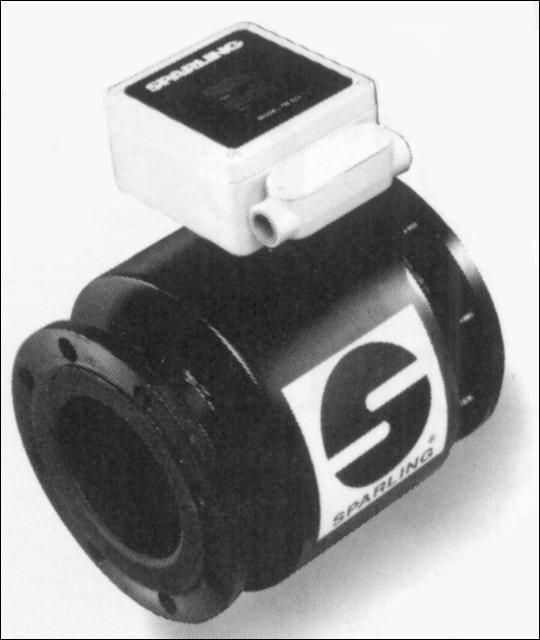
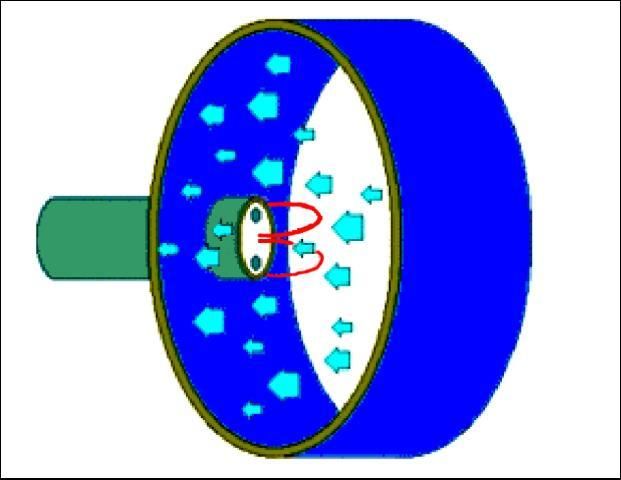
Magnetic flowmeters (Figure 4) have the advantage of not causing obstructions in the pipe. This feature eliminates the problem of possible entanglement from debris in the water as well as any pressure loss across the device. Magnetic flowmeters measure the flow of conductive liquids flowing in filled pipes. The sensor creates a pulsating, alternating magnetic field on the inside of a pipe (Figure 5). The liquid in the pipe will move through this magnetic field and generate a signal current proportional to its velocity. This information is collected by the electrodes and then processed by a microprocessor to provide the user with the flow information. Magnetic flowmeters also require less maintenance than propeller meters, have long-term accuracy, and can be installed only five pipe diameters of straight pipe upstream from the meter. However, they have the disadvantages of a higher initial cost and the need for an external power supply.
Ultrasonic Flowmeters
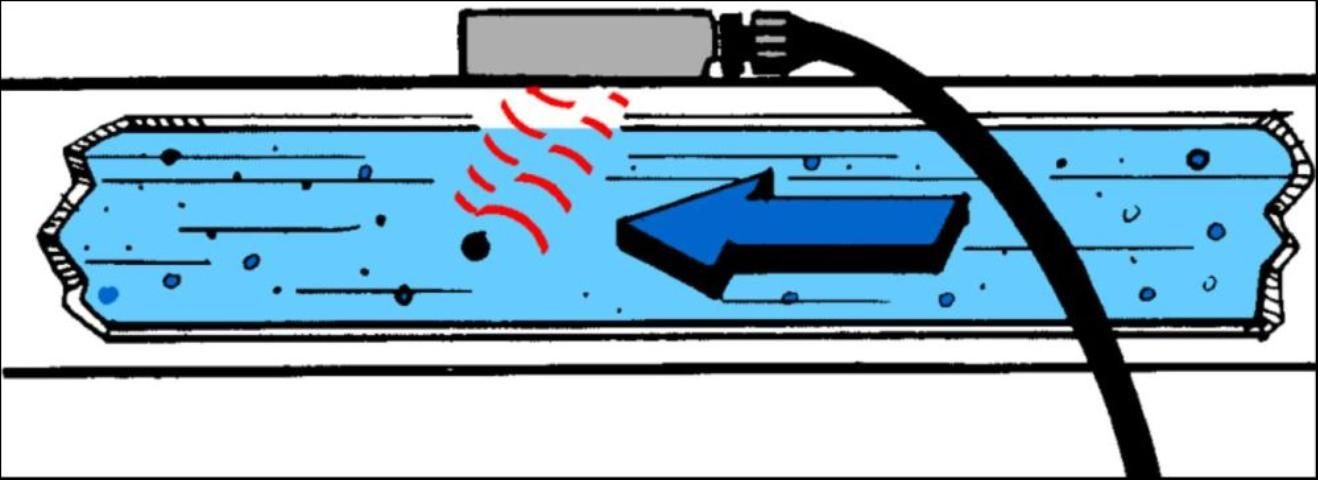
Ultrasonic flowmeters measure flow velocity (and indirectly, flow rate) by directing ultrasonic pulses diagonally across the pipe both upstream and downstream. The difference in time required for the signal to travel through the moving water is measured and converted to flow velocity. The operation of an ultrasonic flowmeter is based on the frequency shift (Doppler Effect) of an ultrasonic signal reflected by suspended particles or gas bubbles in the water stream (Figure 6). This metering technique utilizes the physical phenomenon of a sound wave changing frequency when it is reflected by moving bubbles in the flowing water. In operation, ultrasonic sound is transmitted into a pipe with flowing liquids. The bubbles in the water reflect the ultrasonic wave with a slightly different frequency; the frequency difference being directly proportional to the flow of the liquid.
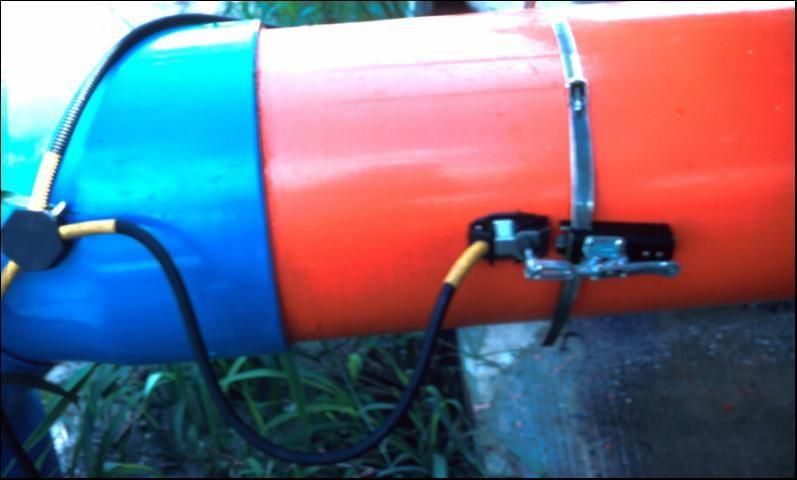
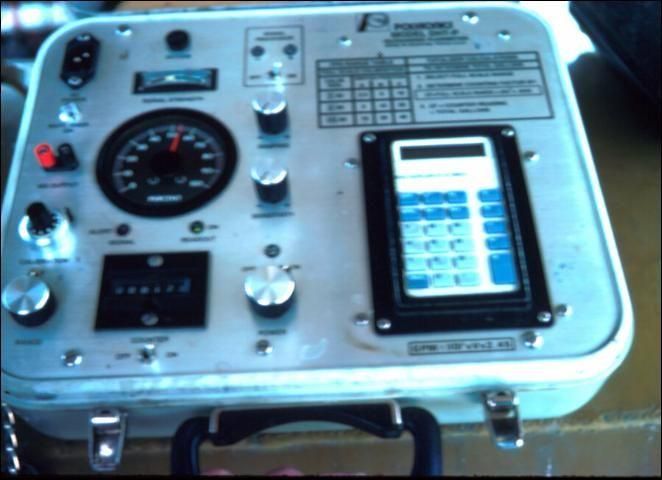
The transducer is mounted on the exterior of the pipe (Figure 7). It receives electronic impulses from the transmitter through an interconnecting cable. The transducer generates an ultrasonic signal which it transmits through the pipe into the flowing liquids. It simultaneously receives an ultrasonic signal reflected from the particles in this flowing liquid. The transmitter measures the difference between its output and input frequency and converts this different frequency into electronic pulses which are processed for an analog indication, and the pulses are scaled and totalized for flow quantity in gallons (Figure 8).
Ultrasonic flowmeters are as accurate as propeller meters and, since they have no moving parts, require little maintenance. Because all attachments are external, these meters can easily be moved to different locations. Ultrasonic flowmeters generally cost more than other types of meters.
Paddlewheel Meters
Paddlewheel flowmeters (Figure 9) can provide economical flow measurement for pipe diameters ranging from 1 inch to very large pipe with diameters of 36-48 inches or more. As water moves through the pipe, the paddle wheel rotates. The rotation velocity is proportional to the flow rate in the pipe. As the paddle wheel rotates past the base of the pickup coil, a voltage pulse is induced. An electronic unit converts pulses to units of flow based on the diameter and flow characteristics of the pipe.
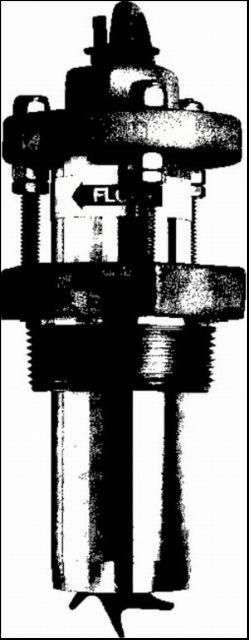
Because the paddles contact only a limited cross section of the flow, the insertion depth of the rotor and the proper flow profile are critical to accurate readings. These meters are inserted to a specific depth into the pipe in which flow is measured. With proper calibration, the pulse rate represents an accurate measurement of velocity, and in turn flow rate. Paddle wheel flowmeters have an accuracy comparable to that of propeller flowmeters (within 2%).
Paddle wheel flowmeters normally need to be installed with at least 10 pipe diameters of straight pipeline upstream and 5 pipe diameters downstream from the sensor to ensure correct operation. However, if there are obstructions, longer upstream straight runs are recommended (Table 2). Some paddle wheel flowmeters can be installed in several sizes of pipe, which provides flexibility in system design. The applicability and cost are comparable to that of propeller meters.
Venturi Meters
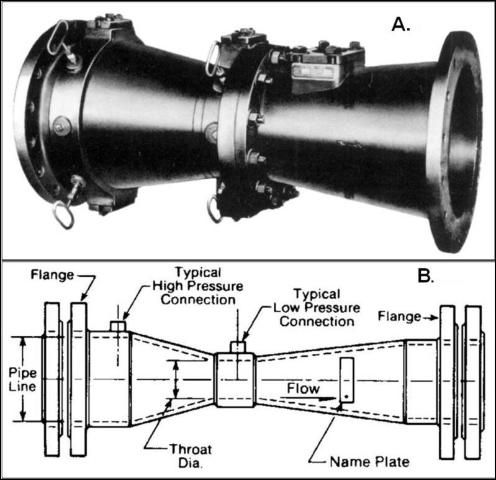
Venturi flowmeters (Figure 10) consist of a section of pipe with a restriction of a specific shape, across which pressure change is measured. The magnitude of this pressure change depends on the flow rate through the device. Venturi flowmeters have the advantages of unobstructed water flow, no moving parts in the main pipeline, little pressure loss across the meter, and good accuracy. Venturi flowmeters typically have low maintenance requirements; however, they cost slightly more than propeller meters.
Shunt Meters
Shunt flow meters (Figure 11) work on the principle that a fraction of the water in the irrigation main pipeline is shunted through a small diameter pipeline. The small diameter pipe is parallel to the mainline for a short distance where it is measured before it is returned to the mainline. The small diameter shunt pipeline is equipped with a totalizing flowmeter which measures only the shunted flow. Flow in the main pipeline is proportional to the amount of flow measured in the shunt pipeline.
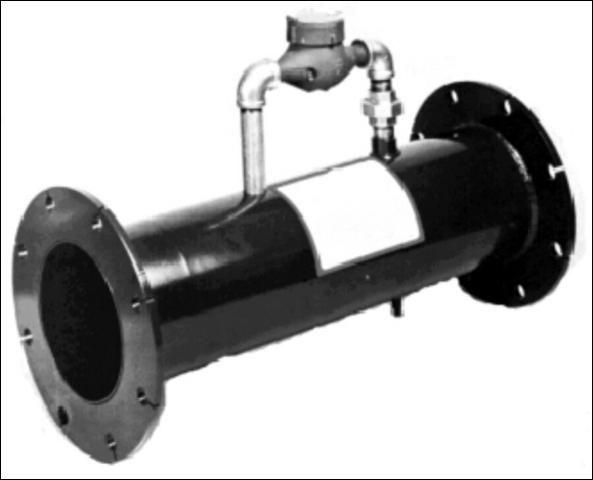
A head loss is required in the main pipeline to create the pressure difference that causes water to flow through the shunt pipeline. Because the shunt flow rate depends on the head loss in the main pipeline, the relationship between the head loss and shunted flow must be determined by calibration. Some of the commercially available shunt flow meters use a venturi constriction to create the head loss in the main pipeline to operate the shunt flow meter. The constriction increases velocity and decreases pressure in the throat of the venturi. The venturi is constructed in tube diameters to be compatible with mainline pipe diameters from 6 to 10.75 inches. The venturi design has the advantage that much of the pressure loss in the throat of the venturi is recovered downstream of the constriction. The venturi is also a simple device whose hydraulic properties are well understood. More importantly, there are no moving parts to wear out.
Flow is registered by a small, low-cost totalizing water meter on the shunt pipeline. The meter gears and register used are sized to indicate the total flow in the main plus shunt pipelines. This design has the advantage that all of the register components are contained on the shunt line where they are readily accessible for calibration, repair, or replacement. Calibration can be performed without removal of the meter. The meter register is a totalizer which does not directly measure flow rate. Rather, total volume of flow is measured in gallons, and this volume must be divided by the time of operation to determine the flow rate for any period of operation. The register components cost less than $100 if the entire register needs to be replaced.
Measurement accuracy of shunt meters can be as good as + 2%. To improve accuracy, straightening vanes can be inserted in the mainline meter tube. However, as with all in-line flowmeters, certain minimal lengths of straight pipeline are required upstream of the meter. Because the straightening vanes are used, the minimum upstream distance of straight pipeline recommended by the manufacturer is only 2 pipe diameters as compared to the 6 to 10 diameters required for conventional impeller meters without straightening vanes.
Estimating Flow Rate with Trajectory Method
With a free-flowing horizontal pipe, the flow can be estimated by measuring the trajectory of the discharge (Figure 12). The distance water flows horizontally past the end of the pipe is dependant on the velocity of the flow. The calculation requires measurements of the vertical drop in the trajectory compared to the horizontal distance the stream travels past the end of the pipe.
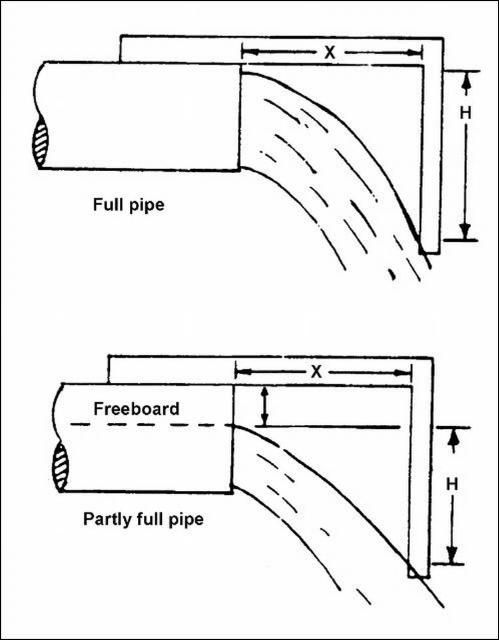
The following steps can be used to estimate discharge from free-flowing pipes. (Adapted from: Irrigation, 5th Edition. 1983. The Irrigation Association, Silver Spring, MD).
Step 1. Measure the inside diameter of the pipe, the freeboard, and the wall thickness of the pipe plus any fittings at the outlet. For pipes larger than 12 inches, measure the outside diameter instead.
Step 2. Choose one of the "H" values given in Table 4 (setting H equal to 13 inches makes the calculation simpler).
Step 3. Set the square so the inside vertical scale reads the "H" value plus freeboard and the thickness of the pipe and fittings. Read the "X" distance on the lower horizontal scale at the end of the pipe. The long side of the square must be parallel with the pipe.
Step 4. From Table 3, read the "A" value.
Step 5. From Table 4, obtain the "K" value. Notice that an "H" value of 13 inches yields a "K" of 1.00.
Step 6. Multiply A with X and K (flow rate = A x X x K) to obtain the flow rate in gallons per minute. For full pipes, add ten percent to the calculated flow rate to obtain a more accurate estimate.
Estimating Volume/Flow In Ditches or Canals
Sometimes it is necessary to estimate the volume or flow rate in an open canal or ditch. Accurate measurement requires the installation of a weir or flume. However, estimates adequate for most purposes can be made from some simple measurements. Volume measurements require determining the cross-sectional area (Figure 13).
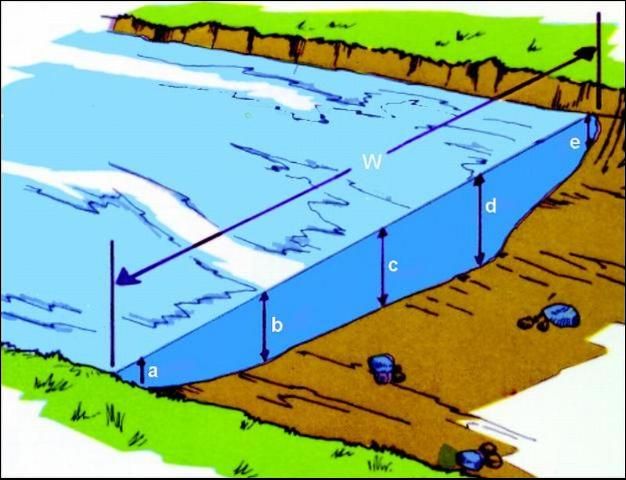
Typically, measurements should be taken at several points along the ditch to obtain the average depth profile. In addition, if the width is not uniform, several measurements should be taken and the average width determined. The average cross-sectional area is calculated by the average depth times the average width as:
Axc = Da x Wa (Eq. 1)
where:
Axc = average cross-sectional area (ft2)
Da = average depth (ft)
W = average canal/ditch width
The volume of water in the ditch can be calculated by multiplying the cross-sectional area by the length of ditch (typically distance between structures). To convert to gallons, Multiply ft3 by 7.48, or to calculate ac-ft, multiply ft3 by 0.00028.
Vol= Aac x L (Eq. 2)
where:
Vol = Volume of water (ft3)
L = Length of ditch (ft)
Example: For the following measurements related to locations in Figure 13, determine the cross-sectional area and volume for a ditch that is 1,200 feet long. (Assume that the measurements represent the average for entire length of ditch).
Width: w = 10 ft
Depth measurements taken 2 ft apart (equally spaced increments):
a = 2 ft., b = 3 ft., c = 4 ft., d = 4.5 ft., e = 2 ft
Axc = l0 ft x 3.1 ft = 31 ft2
Vol = 31 ft2 x 1200 ft = 37,200 ft3
In order to calculate the flow rate in the ditch, the average velocity of water flow must be known. The velocity can be determined by measuring the time required for a floating object to travel a known distance. The velocity multiplied by the cross-sectional area will yield flow rate.
Q = AXC x Vavg (Eq. 3)
where:
Axc = average cross-sectional area (ft2)
Vavg = average velocity (ft/sec)
Q = flow rate (ft3 /sec)
Water along the banks of a ditch or canal flows slower than it does in the center. This is because the banks tend to resist the water flow. This resistance varies with shape and channel roughness. For most ditches and canals, a factor of 0.8 times the indicated velocity of flow can be used to estimate the average velocity.
Example: Using the previous example cross-sectional area and length, if the time required for a float to travel 100 ft in the center of the ditch is 70 seconds, estimate the flow rate of the ditch. Use a factor of 0.8 to convert measured velocity in the center of ditch (Vc) to average velocity (Vavg)
Vc = 100 ft / 70 sec = 1.43 ft/sec
Vavg = V x 0. 8 = 1.43 ft/sec x 0. 8 = 1. 14 ft/sec
Q = A x V = 31 ft2 x 1. 14 ft/sec = 35.5 ft3 /sec
Q = 35.5 ft3 /sec x 7.48 gal/ft3 x 60 sec/min = 15,708 gal/min
Pressure Measurements
Measurement of pressure at key points of a network is of major importance for a system operator. It gives him an effective and simple tool for controlling the performance of the system. A proper gauge type and reasonably chosen measuring points help in discovering leakage and clogging, ascertaining an effective flow distribution, and verifies correct operation of different control devices in a system. Pressure measurements can also give an estimate of the flow rates in various zones of the irrigation system. Therefore the reliability and accuracy of the pressure measuring equipment is an important feature of the irrigation system.
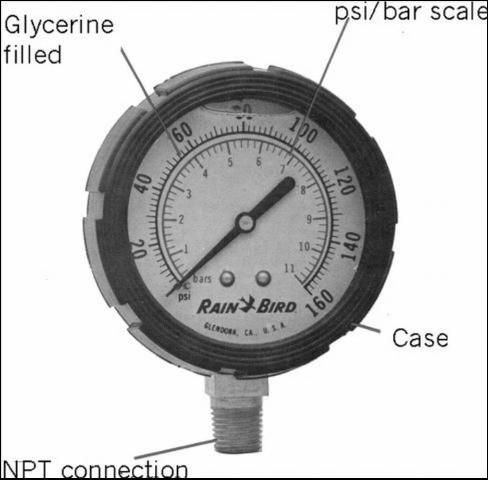
Pressure gauges (Figure 14) should be installed in easily accessible places, so that they are convenient to read and maintain in proper working condition. They should be able to withstand large pressure fluctuations. A pressure gauge must be selected according to the local conditions of installation and to the working pressure range. A properly selected gauge has a scale that will measure up to at least twice the normal working pressure. This allows for pressure surges in the pipeline without damaging the gauge. It also keeps the pointer in the middle of the scale where the accuracy is best under normal operating conditions.
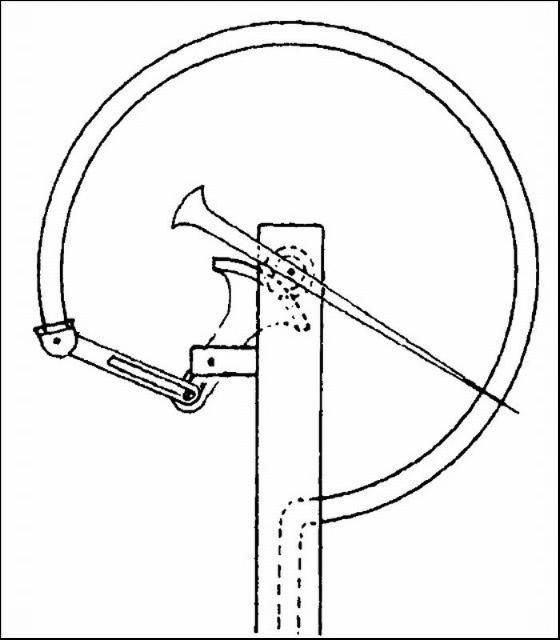
The main type of pressure gauge used in irrigation systems is the Bourdon gauge. This type of gauge uses a C-shaped tube made of copper or stainless alloy (Figure 15). One end of the tube is connected to the inlet of the gauge and the other end is sealed. As the pressure increases, the coiled tube begins to uncoil slightly. This movement of the C-shaped tube is mechanically transferred to the pointer, which moves around a calibrated dial. The dial is typically calibrated in psi. This gauge is available for various pressure ranges.
The accuracy of the pressure gauge depends on the readability of the scale and the precision of the mechanism. Usually, gauge readings can only be made to 1/2 the span increment between scale measurements. For instance, readings for the gauge in Figure 14 would be about 1 psi since the scale is of 2 psi increments. The accuracy of the gauge often changes with the range of the scale. Usually, the most accurate readings are in the range of 25-75% of the full scale reading. Accuracies of 1-2% in this region are normally adequate for irrigation systems.
The proper size of a gauge depends on working conditions. A larger dial permits finer gradation of the scale and easier readout. Larger gauges (4-6 inch) diameter serve as master gauges for testing or as panel instruments in control rooms. Small dials should not be used for stationary control, as they cannot depict the system pressures with sufficient accuracy. Typically 2 ½ - 3 inch gauges are satisfactory for most irrigation system applications.
The materials that make up the gauge box, the transparent face pane, and the internal parts are of the utmost importance. For corrosive conditions, the Bourdon tube and mechanism parts should be made of high grade stainless steel or plastic. In working conditions where mechanical vibrations and pressure fluctuations occur frequently, the rackpinion gear should be reinforced to resist rapid wear.
Special attention should be given to the transparent panes of gauges. They should be made of glass plate only. Gauges with plastic transparent panes tend to become cloudy quickly when used outdoors and exposed to the sun. Dials of pressure gauges for indicating water pressure are usually made of sheet steel. They should be painted white with black graduation marks and have large, easy to read digits. Pressure gauges with dials painted red, blue or green are destined for fluids other than water (i.e., air, oxygen, coolants, etc.) and are not usually suitable for irrigation system service. Pressure units used (typically psi) should be clearly marked on the dial, together with the name or trade mark of the manufacturer. Date of the last calibration and adjustment of the gauge should be recorded in ink on the dial.
Gauges for measuring water pressure usually have an externally threaded inlet at the bottom of the gauge, typically NPT in nominal sizes of 1/8 to 1 inch depending on the size of the gauge. If necessary, the threads can be sealed with Teflon tape. Care should be taken not to cover the orifice. When installing a gauge, its base should be held firmly with a wrench at the square or hexagonal part of the nipple above the thread. Holding the gauge by the box, and turning it while engaging the connecting threads, is a bad practice. It may impair the calibration and accuracy of the gauge, permanently damaging the gauge mechanism.
While handling and installing a pressure gauge, special care must be given to the small orifice at the end of the nipple. This part, which forms the inlet to the Bourdon tube, is extremely delicate, and careless handling may damage the orifice and plug the gauge inlet. In places where the gauge may be subjected to severe pressure fluctuations or water hammer, it should be protected with a valve that can be used to shut off the pressure. When installing the gauge directly in the outlet of a valve, the length of the threads must be considered. The gauge inlet orifice must never touch the rotating element of the ball valves. In systems where the gauge must constantly indicate the pressure and cannot be shut when not in use, vibration choking devices can minimize the effect of pressure fluctuations and water hammer. In these cases, the gauge may be filled with a high viscosity liquid such as glycerin.
Another way of protecting a gauge from effects of surge is to connect it through a vertical loop of small diameter tubing. The upper part of the loop should contain air, which can compress and so compensate the pressure fluctuations. In such an arrangement the presence of air in the loop should be checked periodically. If the air leaks and the loop fills with water, the device becomes ineffective.
Where mechanical vibration in the piping may be a problem, such as near a pumping plant, a flexible connection of gauges, using small diameter, reinforced tubing may prevent the transfer of vibration to the gauge mechanism, and so decrease wear of the parts of mechanism. Such resilient connections may, in certain instances, even prevent the damaging effects of water hammer. The plastic piping must be appropriately chosen and adapted to the working pressure, and to the possible pressure transients in the system.
Recommended upstream distance of straight pipe to minimize effects of obstructions on flow meter accuracy.