Introduction
According to the preliminary estimates compiled by the United States Geological Survey (USGS) for 2010, withdrawals of freshwater for public water supply in Florida averaged about 2.2 billion gallons per day, or about 35 percent of total freshwater withdrawals in the state (Borisova and Rogers 2014; USGS 2010). It is expected that public water supplies will become the largest water user by the year 2025, with an additional 2.0 billion gallons of freshwater withdrawals per day (FDEP 2010).

Extensive water use for public water supply, irrigated agriculture, and periodic droughts has led to a significant decline in Floridan aquifer levels in some areas of Florida, and lowered lake levels and spring discharges throughout the state. Water conservation is seen as "the most important action we can take to sustain our water supplies, meet future needs, and reduce demands on Florida's fragile water-dependent ecosystems such as lakes, streams, and the Everglades" (FDEP 2008).
Currently, water management districts require public water suppliers to implement such water conservation measures as adoption of local irrigation ordinances, leak detection, public education, and conservation-based water rates. This paper focuses on the conservation-based rates (also referred to as inclining block rates, inverted block rates, conservation rates, conservation-oriented rates, or demand management pricing). Below, we define the criteria used to design and evaluate conservation-based rates, consider alternative rate structures, and briefly discuss challenges posed by conservation-oriented rates for utility companies. As an illustrative example, we discuss rates used by Gainesville Regional Utilities (GRU) in 2013–2014 (GRU 2013).
Conservation-Oriented Water Rates
Conservation-oriented water rates are aimed at stimulating water use efficiency and water conservation through economic incentives, specifically through water price signals. American Water Works Association suggested four criteria to design and evaluate a conservation water rate structure. Three of the criteria are discussed here: (1) the structural form of the rate; (2) the proportion of utility costs that is recovered through fixed versus commodity charges; and (3) effective communication of the price signal through consumer billing. The fourth suggested criterion is relevant only for public-sector utilities and is not discussed in this publication: the extent to which the cost of the utility service is covered through user fees as opposed to other sources, such as taxes or general funds transfer (Beecher et al. 1994).
Structural Form of Water Rates
Conservation pricing is based on the idea that customer water use decreases as the price paid for water increases, which is the typical price-quantity relationship for almost any good or service. A variety of structural forms associated with conservation-oriented rates are summarized in Table 1. Inverted block rate (aka, inclining block rate) is the structural form that is most frequently associated with a conservation-oriented water rate. Given an inverted block rate structure, customer water usage is divided into several blocks so that the price paid for the additional unit of water increases as residential water usage increases from one block to the next.
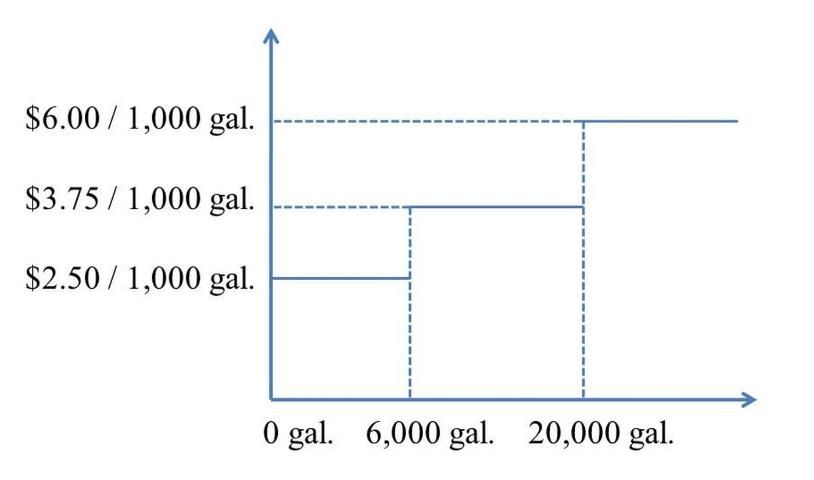
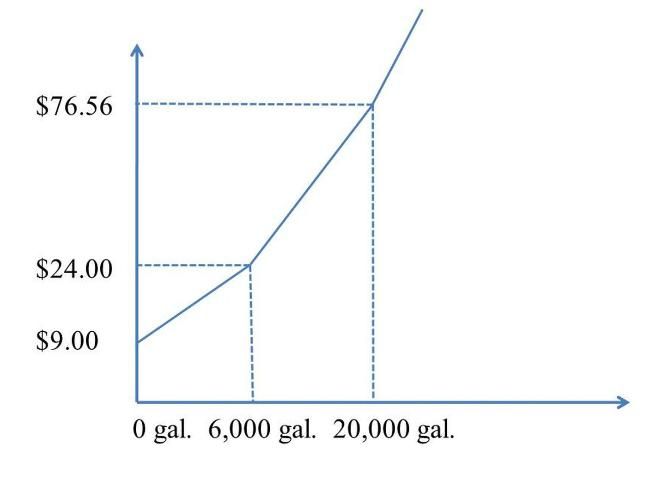
To illustrate an inverted block rate structure, we use an example of the three-block structure employed by GRU in 2013–2014 (Table 2; Figures 1 and 2). The price that GRU customers pay for 1,000 gallons of water is $2.30, as long as a household uses less than 6,000 gallons per billing period (in addition to $9.00 per billing period service charge). However, the household will need to pay $3.75 for each additional thousand gallons in excess of 6,000 gallons per billing period. Each additional thousand gallons will cost even more ($6.00) if the household exceeds the 20,000 gallons per billing period. Similarly, for residents who have a separate meter for their irrigation water use, GRU uses inverted block structure with two blocks (Table 2).


The inverted block water rate structure is often contrasted with flat, declining block, and uniform water rate structures. A flat rate structure implies that consumers' monthly payments are fixed and independent of the volumes of water used. This structure is often employed when consumers' water usage is not metered. Flat rate structure does not provide economic incentives for water conservation since customers' costs of additional gallons of water are zero. Under a declining block rate structure, a consumer pays less per additional unit of water as usage increases. Finally, given a uniform rate structure, customers pay the same price for every additional unit of water that they use. Although customers' total monthly payments increase with the amount of water they use, uniform and declining water rate structures provide weaker incentives for water conservation in comparison with inverted block water rates, for which not only the total payment, but also the unit payment increases with the volume of water used.
In 2012, of the 170 Florida utility companies surveyed by Raftelis (2012), 18 used uniform rate structures (11%) and 152 used inverted block rate structures with two to six rate blocks (89%). The number of utility companies using inverted block rate structure increases over time (Whitcomb 2005).
Design of a Conservation-Oriented Rate Structure
Water utilities employing an inverted block rate structures have the flexibility to decide on the number of blocks, block water rates, and threshold usage for each block. The decision is typically based on customers' characteristics and is made iteratively until the appropriate demand response and revenue collection goals are achieved (Raftelis 2005). For example, the first block can cover non-discretionary water usage, such as average indoor water uses for drinking, cooking, sanitation, and cleaning. The first block rates are kept relatively low to ensure water affordability for the low-income group. Alternatively, the blocks can be linked to average daily, maximum daily, and maximum hourly costs of serving residential customers (Raftelis 2005). Also, computer models are available to help utilities simulate the effects of different rate designs on their revenue streams.

To capture differences in discretionary and non-discretionary use amounts, as well as in the costs of servicing, multiple inverted block rate structures can be developed for different classes of customers, such as residential, commercial, industrial, and institutional classes. However, to avoid over-complication of a utility's pricing system, an inverted rate structure is usually introduced for residential customers only, since this class can find it relatively easy to improve water use efficiency (Raftelis 2005).
The design of a conservation-oriented rate structure for residential customers should take into account the responsiveness of water usage to water rates, which economists call price elasticity of demand (or price elasticity). Water price elasticity is usually negative, indicating that the price and the quantity demanded move in opposite directions such that an increase in price results in a decrease in quantity demanded. Price elasticity values between –1 and 0 characterize an inelastic demand, for which a change in price results in a smaller percentage change in the quantity demanded. For an inelastic demand, an increase in price results in an increase in the overall revenue. In contrast, a price elasticity value less than –1 characterizes an elastic demand, for which an increase in the price results in a larger decrease in quantity demanded, thereby reducing total revenues.
According to Beecher et al. (1994), as well as the variety of studies conducted in recent years, the most likely price elasticity range for residential demand is –0.2 to –0.4, which implies that an increase in water rates will lead to a relatively small reduction in water use, and hence, an increase in utility revenues. However, the price elasticity varies among regions, customer classes, water use categories, seasons, and time periods. It is recommended for utilities to estimate price elasticity using the data specific for their own customers. Generally, water demand for outdoor discretionary uses (such as lawn watering, car washing, and swimming pools) is more elastic than the demand for non-discretionary indoor water uses. Water demand of low-income customer groups is usually less elastic than the demand of high-income customer groups because low-income customers usually use less water for non-discretionary uses (Beecher et al. 1994). In Florida, there is less outdoor discretionary water use during late fall and winter when non-discretionary water uses decrease and the demand for water may be less responsive to price changes during that season. Other determinants of price elasticity (Beecher et al. 1994) include the following:
-
Rate levels: For lower rates, an increase in the rates from block to block would have a small effect on quantity demanded. The rates are low if the total water bill amounts to a very small share in the total household income. Note that in periods of high inflation, it is important to focus on real water rates (i.e., rates adjusted for inflation).
-
Environmental awareness and attitudes: More environmentally-oriented customers may be more responsive to water conservation signals sent through water rates, which make educational programs an especially important component in utilities' water efficiency and conservation programs.
-
Other conservation programs: For example, a combination of conservation pricing and water quantity restrictions (i.e., reduction in the number of weekdays residents are allowed to irrigate) can lead to more significant reductions in water use than conservation pricing alone (Kenney et al. 2008).
-
Time period: Water demand is usually more price-elastic in the long run (about five years or longer) than in the short run. In the long run, customers have the opportunity to adapt to higher prices by making their appliances and outdoor irrigation methods more water efficient.
-
Availability of alternative water sources: The demand for water will be more elastic if customers have access to alternative water sources such as private irrigation wells or reclaimed water. Since customers have an opportunity to switch to an alternative water source, demand for water from utilities will be more responsive to the rate changes.
Proportion of the Utility Costs Recovered through Fixed Versus Commodity Charges
Inverted block, flat, uniform, declining block, and other rate structures are all linked to the amount of water used by customers, and are referred to as commodity charges (alternatively, such rates can be referred to as volumetric or usage charges). In addition to commodity charges, utility companies also impose fixed charges that are the same for all customers within a certain customer class, and that are not directly linked to the amount of water used by the customers. For residential customers, the fixed monthly charges usually cover utilities' costs of metering, billing, customer service, and some capital-related cost; however, some utilities include payment for some minimum level of usage into the fixed charge, and in this way recover a part of their water withdrawal and delivery costs. For example, GRU charges residential customers a fixed monthly charge of $9.00, based on the cost of service to provide metering, meter reading, billing, and customer service (GRU 2013).

American Water Works Association suggests that along with the commodity rate structure, utilities should design and evaluate their conservation-oriented water rates based on the proportion of the utility costs recovered through fixed charges versus commodity charges (Beecher et al. 1994). A higher proportion of costs recovered through fixed charges translates into higher fixed charges as a proportion of total customers' monthly bills, and diminishes the effect of the inverted block volumetric rates on customers' water uses.
Wastewater charges applied by many utilities, based on non-discretionary water usage, can also distort the conservation price signal sent by the inverted volumetric water rates to the customers. For example, in 2013–2014, GRU charges residential customers a wastewater charge of $5.85 per thousand gallons, in addition to the flat rate of $7.85 per billing period. Since wastewater is not metered, GRU estimates monthly wastewater volume based on the amount of water a household uses for non-discretionary uses, specifically, based on the winter maximum water usage (estimated as the average daily consumption used in January and February times 30.4; January and February are selected since the customers generally do not irrigate their lawns during these months). Wastewater bill is based on monthly water usage or the winter maximum water use, whichever is lower (GRU 2013). Such wastewater charges effectively increase water rates for non-discretionary water usage.
Communication of the Price Signal through Consumer Billing
The third criterion suggested by the American Water Works Association to design and evaluate conservation pricing is the effective communication of the price signal through consumer billing (Beecher et al. 1994). To influence water demand, the conservation pricing must be understood by customers. Households should be able to estimate changes in their water bills as a result of increases in water usage. Many Florida utility companies describe their water rates on their websites and/or through newsletters to their customers. However, this information is often limited. For example, the survey of customers of sixteen Florida utilities, conducted by Whitcomb (2005), showed that 39 percent of respondents are not knowledgeable about water rate structures (i.e., number, size, and prices of the blocks). At the time of the survey, only five of the sixteen participating utilities printed their water rates on their bills, which partially explain this lack of customer knowledge (Whitcomb 2005).
Conclusions
In conclusion, the pricing objectives of a water utility are not exclusively based on the efficient use of water and water conservation. Other pricing objectives can include financial viability of the utility over time, revenue stability, competitiveness and economic development, equity and fairness toward customers, legality and litigation potential, and difficulty of implementation and management of a pricing structure (Green and Yingling 2007; Raftelis 2005). Because these pricing objectives can conflict with one another, conservation pricing can only help achieve some of the objectives. Conservation pricing promotes efficient use of water resources, allows utilities to postpone costly development of new water sources, and reduces incremental facility capacity and peak demand (specifically, seasonal or time-of-use rates). Seasonal and time-of-use rates may increase the use of existing facilities during non-peak periods and improve the efficiency of available capacity use (Raftelis 2005). On the other hand, conservation pricing can lead to revenue instability due to the shift of cost recovery from fixed charges to less predictable volumetric charges. To ensure a stable stream of revenues to cover costs and meet revenue requirements, utilities can save any revenue surplus during periods of high revenues to cover costs during periods of low revenues (Beecher et al. 1994). For example, GRU maintains a rate stabilization fund to smooth revenue variations associated with variations in demand and billing (Richardson 2008). Also, high unit rates for large-volume customers increase the risk of utilization of alternative water sources (i.e., private wells), which can decrease a utility's revenue and increase the overall water withdrawals in the area, impacting other water uses such as environmental and recreational uses. For example, customers had access to surficial irrigation wells in the service areas of twelve out of sixteen Florida utilities examined by Whitcomb (2005).
Conservation rates can be complex, require advanced metering capability and cost-tracking methodologies, and may be more costly to administer. Some economists argue in favor of water rates that accurately reflect service costs. Since the cost of delivering an additional unit of water from an existing water source often decreases with the volume of water purchased, economically efficient water rates would imply a rate reduction with the purchase volume (not increase, as in water conservation rates) (Raftelis 2005).
The tradeoffs associated with conservation pricing demonstrate the need for a careful examination of all the possible effects of conservation pricing structure on utilities' revenue streams and customers' water uses. Such examination requires reliable data on customers' responses to different price signals. The analysis of possible price structures should involve representatives from all the key areas of utility companies. Many utilities involve customers in the rate-setting process to elicit additional information and increase support for the final rate structure adopted (Raftelis 2005).
References
Beecher J.A., P.C. Mann, Y. Hegazy, and J.D. Stanford. 1994. Revenue Effects of Water Conservation and Conservation Pricing: Issues and Practices. National Regulatory Research Institute Report 94-18. The Ohio State University, Columbus, OH.
Borisova, T. and J. Rogers. 2014. Water withdrawals and their use in Florida in 2010. EDIS #943. UF/IFAS Extension, University of Florida, Gainesville, FL.
FDEP. 2008. Office of Water Policy: Water Conservation. Florida Department of Environmental Protection, Tallahassee, FL. http://www.dep.state.fl.us/water/waterpolicy/conservation.htm
FDEP. 2010. Water Use Trends in Florida. Florida Department of Environmental Protection, Tallahassee, FL. http://www.dep.state.fl.us/water/waterpolicy/docs/factsheets/wrfss-water-use-trends.pdf.
GRU. 2013. Rates & Charges — Calculating Your Bill. Gainesville Regional Utilities (GRU), Gainesville, FL. http://www.gru.com/Portals/0/Legacy/Pdf/RatesCharges.pdf.
Green, D. and J. Yingling. 2007. Increase conservation and maintain revenues: Mission (not) impossible. Florida Water Resources Journal (August): 32–36.
Kenney, D.S., C. Goemans, R. Klein, J. Lowrey, and K. Reidy. 2008. Residential water demand management: Lessons from Aurora, Colorado. Journal of the American Water Resources Association 44(1): 192–207.
Marella, Richard L. 1999. Water Withdrawals, Use, Discharge, and Trends in Florida, 1995. Water Resources Investigations Report 99-4002, United States Department of the Interior, U.S. Geological Survey, Tallahassee, FL. https://fl.water.usgs.gov/PDF_files/wri99_4002_marella.pdf.
Mayer, P., W. DeOreo, T. Chesnutt, and L. Summers. 2008. Water budgets and rate structures: Innovative management tools. American Water Works Association Journal 100(5): 117.
Raftelis Financial Consultants, Inc., 2012. 2012 Florida Water Rate Survey. Raftelis Financial Consultants, Inc., Orlando, FL. http://www.raftelis.com/_files/pages/2012-Florida-Water-Rate-Survey.pdf.
Raftelis G.A. 2005. Water and Wastewater Finance and Pricing: A Comprehensive Guide, Third Edition. Boca Raton, FL: Taylor & Francis Group.
Richardson, David, Assistant General Manager, Water/ Wastewater Systems, Gainesville Regional Utilities. 2008. Personal communications (October).
Stallworth, H. 2003. Water and Wastewater Pricing. EPA Report 832-F-03-027. United States Environmental Protection Agency, Washington, D.C. https://nepis.epa.gov/Exe/ZyPDF.cgi/901U1200.PDF?Dockey=901U1200.PDF. Accessed October 28, 2022.
USGS. 2010. Water Use Data Tables, 2010. United States Geological Survey (USGS), Reston, VA.
University of Florida, Institute of Food and Agricultural Sciences (UF/IFAS). 2008. Living green: Water conservation. Solutions for Your Life. http://livinggreen.ifas.ufl.edu/water/water_conservation.html
Whitcomb J.B. 2005a. Florida Water Rates Evaluation of Single-Family Homes . Northwest Florida Water Management District, Havana, FL. https://www.sfwmd.gov/sites/default/files/documents/water_rate_report.pdf. Accessed October 28, 2022.