Boom Sprayer Nozzle Performance Test1
Introduction
Calibration is adjusting equipment to determine the amount of material being applied to the target area. The main reason for calibration of liquid spray equipment is to determine how much pesticide to put into the sprayer's tank, so you can apply the recommended volume to the target site at a determined speed. Making sure all nozzle tips on the spray boom function uniformly is the fundamental first step of sprayer calibration. The nozzle tips can be affected by several things. Age, lack of maintenance, or type and amount of spray can cause nozzle tips to wear or clog. Worn or clogged nozzle tips make a boom sprayer unable to deliver a uniform spray pattern. The use of a boom sprayer that has a non-uniform nozzle tip output will very likely result in a misapplication.
Why You Need to Calibrate Equipment
Applicators are legally liable for injuries or damage caused by improper pesticide application. Several problems are associated with applying a pesticide at the incorrect volume.
Illegal residues. Applying higher than legal volumes of a pesticide may result in residues on crop plants that exceed the legal tolerance level. If over-application results in illegal residues on plant surfaces, regulators have the authority to confiscate and destroy an entire crop to protect consumers.
Impact on effective pest control. Pesticide registrants and/or manufacturers of pesticides spend millions of dollars researching ways to use their products correctly and effectively. This research includes determining the right amount of pesticide to apply to control target pests. Using less than the labeled rate is legal in most cases but may result in inadequate control, wasting time and money. Application volumes that are too low also may lead to problems such as pest resistance and resurgence. Using higher than the labeled rates is illegal and wastes pesticides and using too much pesticide may adversely affect natural enemies of the pest being controlled.
Human health concerns. Pesticides applied at higher than label rates could endanger the health of pesticide handlers, field workers, yourself, and other people working in or around an area where you applied them.
Environmental concerns. Pesticide concentrations higher than label directions may cause serious environmental problems. Calibrating equipment to maintain application volumes within label requirements reduces the potential for contaminating surface water, groundwater, and the air.
Impact on treated plant surfaces. Certain pesticides are phytotoxic (injurious to plants) and damage treated plant surfaces when used at higher than label-prescribed rates. Manufacturers evaluate these potential problems while testing their products, so they can determine safe concentrations.
Soil contamination. Using too much pesticide increases the chance of building up excessive residues in the soil. A buildup of certain pesticides sometimes seriously limits the types of future crops that can safely be grown in the treated area.
Wasting resources. Using the improper amount of pesticide wastes time and adds unnecessary costs to the application.
Conducting the Test
Begin by making certain the boom sprayer has clean water in its tank, is mechanically sound, and has clean screens and intact plumbing. Make sure that all of the nozzle tips on the boom are the same type and size (for example, all tips are AI8002).
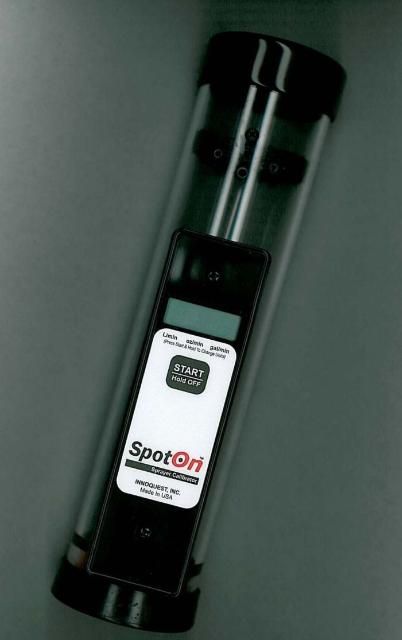
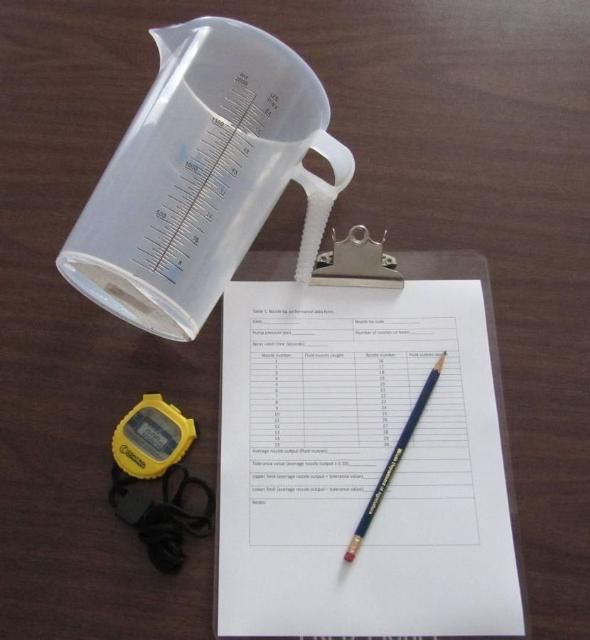
Commercial tip testers that measure nozzle flow rate are available but not necessary (Figure 1). Only a few simple items are needed for conducting the test (Figure 2), including the following: a clipboard, a nozzle performance data form (Table 1 located on the last page), a pencil, a wristwatch with a second hand or stopwatch, and a hand-held graduated container marked in milliliters and/or ounces.
Credit: UF/IFAS Pesticide Information Office
Credit: UF/IFAS Pesticide Information Office
Steps to Perform the Test
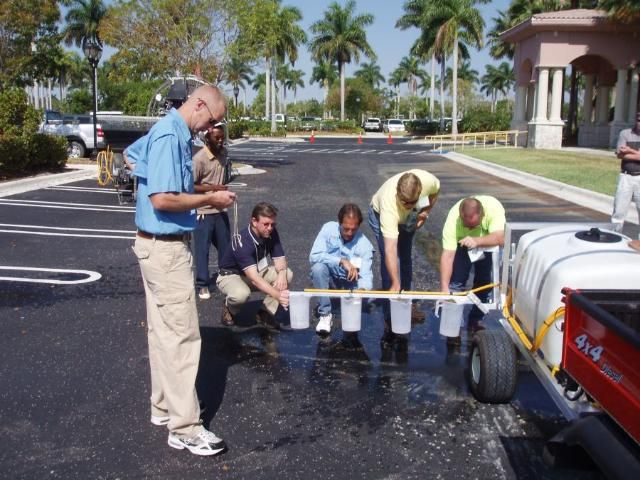
Using the graduated container, catch the output from each nozzle for a predetermined time; either 30 seconds or 1 minute is usually adequate (Figure 3). Write down the nozzle outputs by nozzle on the data form.
Sum total amounts from each nozzle. Divide by the number of nozzles to get the average nozzle output. Write down the average output on the data form.
Determine the tolerance value by multiplying the average nozzle output by 0.10. In other words, you will replace any nozzle that is applying more or less than 10% of the average nozzle output.
Determine the upper limit by adding the tolerance value to the average nozzle output, and determine the lower limit by subtracting the tolerance value from the average nozzle output.
If output from any nozzle is greater than the upper limit, the nozzle tip is probably worn out, and a new tip is needed. If output from any nozzle is less than the lower limit, cleaning may bring it into the correct range. If not, replace the nozzle, and repeat the test.
If tips are replaced after the initial test, repeat steps 1–5.
Credit: UF/IFAS Pesticide Information Office
Example Calculation
You have a boom with 8 nozzles and catch the following outputs in 30 seconds per nozzle:
Nozzle 1: 16 ounces
Nozzle 2: 12 ounces
Nozzle 3: 15 ounces
Nozzle 4: 16 ounces
Nozzle 5: 16 ounces
Nozzle 6: 15 ounces
Nozzle 7: 14 ounces
Nozzle 8: 19 ounces
2. The average nozzle output is 15.4 ounces (123 ÷ 8).
3. The tolerance value is 1.5 (15.4 x 0.10).
4. The upper limit is 16.9 (15.4 + 1.5), and the lower limit is 13.9 (15.4 – 1.5).
5. Nozzles 2 and 8 should be replaced and the test repeated.
Additional Information
Dean, T.W. and F.M. Fishel. 2008. Broadcast Boom Sprayer Calibration. Gainesville: University of Florida Institute of Food and Agricultural Sciences. https://edis.ifas.ufl.edu/pi016.
J.A. Ferrell, B.A. Sellers, and R. Leon. 2012. Calibration of Herbicide Applicators. Gainesville: University of Florida Institute of Food and Agricultural Sciences. https://edis.ifas.ufl.edu/wg013.
