Growing Degree-Days or Heat Units
It is not a coincidence that many have heard of the Farmers' Almanac; farmers spend their lifetime tracking the weather. How much and when it rains, freezes, and thaws can make the difference between boom and bust for a year's crop. However, temperature can predict more than boom or bust. Atmospheric temperature can predict the growth rates of many plants. For this reason, growers use a concept called growing degree-days (GDD), sometimes called heat units. GDD relate air temperature to plant growth, development, and maturity.
The French scientist Rene A. F. de Réaumur introduced the idea of GDD in 1730 (McMaster and Wilhelm 1997). Since that time, GDD has been used as a means to predict the growth stages of many living things—plants and animals (Cross and Zuber 1972; Gilmore and Rogers 1958; Jarosik et al. 2011; Klepper et al. 1984; McMaster and Smika 1988; Russelle et al. 1984). GDD is based on the idea that the development of a plant will occur only when the temperature exceeds a specific base temperature for a certain number of days. Each type of plant is adapted to grow best over its own specific base temperature, called Tbase. Even cultivars of the same plant species sometimes have different Tbase.
We count one GDD for every 24-hour period during which the average temperature is one degree greater than Tbase. If the average temperature is two degrees above Tbase, then we count two GDD, and so on. It is also important to remember that a Celsius degree-day is not the same as a Fahrenheit degree-day, because Celsius degrees are almost twice as "large" as Fahrenheit degrees. It takes nine Fahrenheit degree-days to make five Celsius degree-days. GDD provides growers with a more scientific way of understanding how the daily warmth provided by the sun and plant growth are related. Growers can use the number of GDD or heat units required for a given crop and variety to reach maturity to estimate when to be ready for harvest. Researchers have also developed charts relating growth stages of certain crops, such as cotton, to GDD accumulation.
The growth of insects can also be related to temperature. Insects are cold-blooded animals, and temperature is crucial in controlling their rate of development. The prediction of survival and development of insects using GDD is based on Tbase for each species. GDD has been a useful Integrated Pest Management (IPM) tool, indicating the time to start scouting fields for pests. The accuracy and species-specific database of the Tbase is critical when using GDD to support pest sampling. However, when the thermal requirements of the species are unknown, data of taxonomic closely related species could be used in the GDD calculations (Jarosik et al. 2011). Table 1 lists values of Tbase that researchers have determined for various crops and insects. Growth does not increase constantly with temperature.
Using the AgroClimate Website to Track and Forecast GDD Accumulation
Growers can use the AgroClimate website (http://agroclimate.org/) to track and predict GDD accumulation for the current season, and to review GDD for past seasons. AgroClimate is a Web-based climate forecast and decision support system (Fraisse et al. 2006) that offers a wide variety of information, including climate forecasts combined with risk management tools and information for selected crops.
Forecasting GDD accumulation can be used to determine when a crop will flower or mature and help growers in scheduling scouting activities, field application of chemicals, or any other activity that needs to be performed during a specific development stage. Follow the steps below to monitor and forecast GDD accumulation for a limited selection of base temperatures in AgroClimate.org.
1. Navigate to the Growing Degree-Days Calculator tool
Select "Tools" in the main menu. Move the cursor over "Degree Days & Chill Hours" and click on "Growing Degree Days Calculator" (http://agroclimate.org/tools/growing-degree-days-calculator/).
2. Select a weather station
Available weather stations in the Southeast United States are displayed on a map. Click on the station of interest.
3. Select a base temperature
The following base temperatures are available for GDD forecasting: 40°F, 50°F, and 60°F. Once a temperature is selected, GDD is calculated, and results are displayed in tables and graphs.
4. Select projected period
Select start and end dates for the forecast from the left-side menu. The crop planting date should be entered as the start date if the user is interested in tracking GDD accumulation during a crop cycle.
5. Select graph options
Indicate whether you want to display long-term average and/or last season accumulation to compare with current values.
The AgroClimate website uses the current best forecast of the El Niño Southern Oscillation (ENSO) cycle by default to estimate GDD accumulation if the selected end date is after the current date.
Users can examine this information in different ways by selecting one of the two tabs located at the top of the results window. Each one is discussed below.
Total Accumulated and Projected
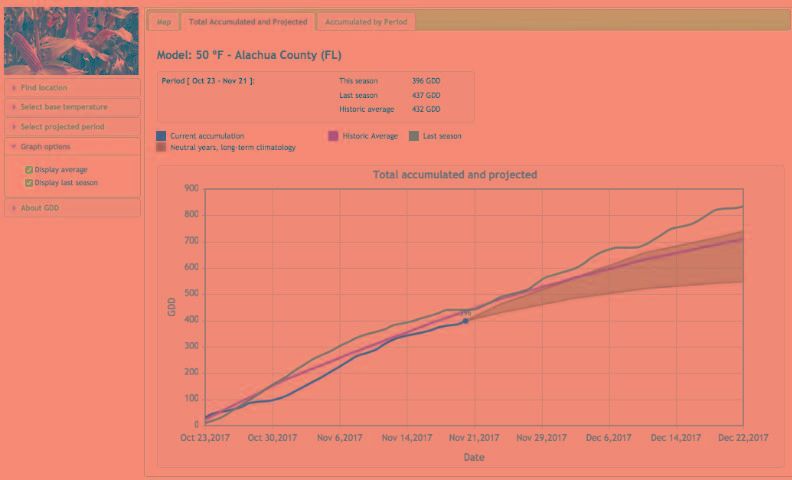
This tab provides users with the observed and projected accumulation based on the selected location and base temperature (Figure 1). Users can select the period of interest, normally starting with the planting date and the graph option that allow comparison of current accumulation with the long-term average and last year conditions. The data table above the chart gives the numerical values that correspond to the graph.

Credit: AgroClimate.org
Accumulated by Period
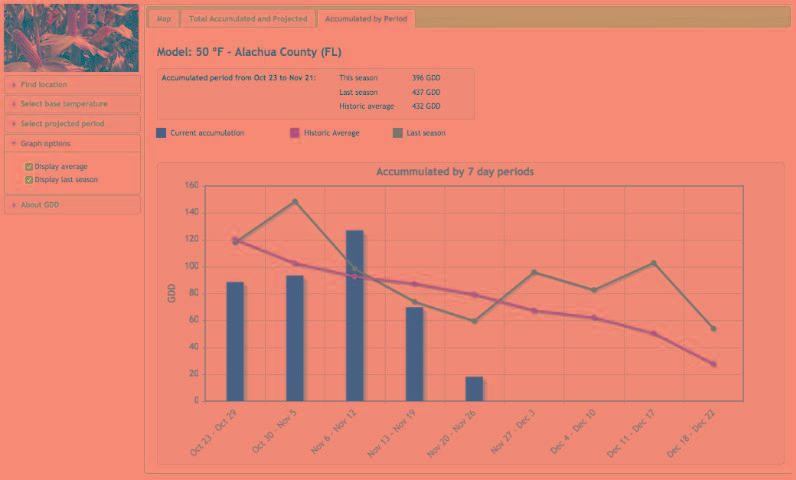
This tab provides the same information as the previous one, but with the GDD accumulation displayed in periods of 7 days. Current accumulation aggregated in 7-day periods is represented by bars, while the long-term average and last year accumulations for the same 7-day periods are shown as lines (Figure 2).

Credit: AgroClimate.org
Heating and Cooling Degree-Days
People often discuss how hot or cold it is. Usually, it is a question of comfort, and it is simple enough to measure the temperature. However, in some industries, it is not enough to know the temperature. It is important to find a way of measuring the impact of the temperature.
For example, if you are in charge of a power company trying to run hundreds of thousands of air conditioners or heaters at the same time, it is a question of whether there will be enough power to run all those homes or enough fuel to run the generators. Understanding heating and cooling degree-days can take some of the guesswork out of these questions, allowing engineers to do their jobs more effectively and make good decisions about resources. Heating degree-days (HDD) are normally used by power companies to estimate the amount of energy required for residential or commercial space heating during the cold season. Cooling degree-days (CDD) are used to estimate the amount of air conditioning usage during the warm season.
There are different ways of measuring heating and cooling degree-days. The simplest way to do this involves using a base temperature of 65°F (18.3°C) to calculate both HDD and CDD. If the current air temperature is below 65°F, then we assume energy will be used for heating. If it is above 65°F, energy will be needed for air conditioning. Therefore, a day with an average temperature of 55°F will correspond to 10 HDD, and a day with an average temperature of 75°F will correspond to 10 CDD. The AgroClimate website can also be used to monitor and predict HDD and CDD: http://agroclimate.org/tools/cooling-and-heating-degree-days-calculator/
Methods for Calculating HDD, CDD, and GDD
Standard or Averaging Method
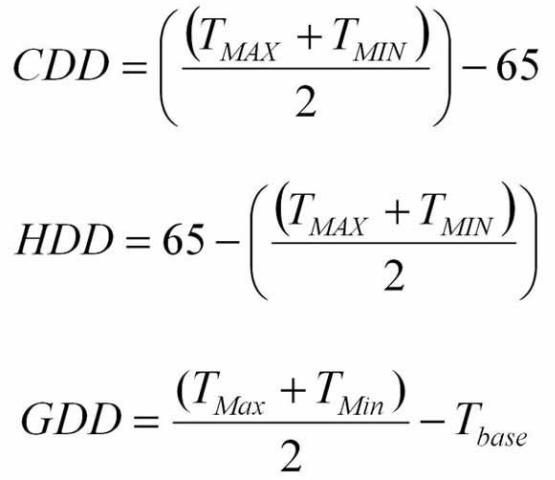
The simplest form of degree-day calculation is the standard (also called averaging or rectangle) method, which uses simple averaging. Degree-days for a single day using the standard method can be calculated with the following formulae:

In these equations, the average or mean temperature is calculated by adding together the high for the day and the low for the day, and then dividing the result by 2. Tbase is the minimum developmental threshold temperature. If the average temperature is equal to 65°F, then both HDD and CDD are equal to zero. In the case of GDD, if the average temperature is less than or equal to Tbase, then GDD is equal to zero.
Examples:
-
Calculate CDD and HDD given TMax = 87°F and TMin = 63°F.
TAvg. = (87 + 63) / 2 = 75°F
CDD = 75 - 65 = 10°F
HDD = 0°F
-
Calculate GDD, base 60°F, given TMax = 78°F and TMin = 52°F.
TAvg. = (78 + 52) / 2 = 65°F
GDD, base 60 = 65 - 60 = 5°F
-
See what happens given TMax = 70°F and TMin = 42°F.
TAvg. = (70 + 42) / 2 = 56°F
GDD, base 60 = 56 - 60 = -4 = 0°F
In the last example, the maximum temperature was higher than the base of 60°F, but no degree-days were accumulated. Because of this, the averaging method tends to underestimate early season GDD accumulation.
Modified Growing Degree-Days
The standard method for calculating growing degree-days can be modified to consider the upper developmental threshold (Tcutoff) or other Tcutoff temperature adjustments. Tcutoff is the temperature above which the rate of growth or development begins to decrease or stop, which is most commonly assumed to be equal to 86°F.
Other literature may refer to the upper developmental threshold as ceiling, the upper cutoff, the upper developmental cutoff, or cutoff. In this case, GDD for a single day can be calculated by using TMax if TMax < Tcutoff, or using the following formula if TMax > Tcutoff:

Sine Curve Method
Although it is simple to calculate the degree-days accumulated based on the average temperature, calculating degree-days for the daily temperature fluctuations that occur in nature is more difficult. Since hourly temperature records are not always available, several methods are used to estimate degree-days through the use of daily minimum and maximum temperatures. All are approximations of the actual number of degree-days accumulated for a given set of daily temperatures. However, most are adequate, considering the accuracy of the weather instruments used and the precision required for management decisions.
The sine or Baskerville-Emin (BE) method uses a sine curve that is fitted to the maximum and minimum temperature profile to simulate how the daily temperature would vary. The area under the curve and above the base temperature is then calculated. This gives a better estimate of the heat accumulation, but uses a more complex calculation than the standard method.
Hourly Average Integration
The Hourly Average Integration methods are usually implemented on automated dataloggers. They use average hourly temperatures to calculate an hourly heat accumulation. These are then summed up over the day to give a daily GDD.
Some systems use 15-minute and even 5-minute average temperatures.
A Note about How AgroClimate Calculates GDD
Since long-term weather records used for estimating GDD accumulation do not include hourly temperature, AgroClimate uses the modified method that takes into consideration daily average temperature based on the minimum and a cutoff temperature (86°F).
References
Cross, H. Z. and M. S. Zuber. 1972. "Prediction of flowering dates in maize based on different methods of estimating thermal units." Agron. J. 64: 351–355.
Fraisse, C. W., N. Breuer, J. G. Bellow, V. Cabrera, U. Hatch, G. Hoogenboom, K. Ingram, et al. 2006. "AgClimate: A climate forecast information system for agricultural risk management in the southeastern USA." Computers & Electronics in Agriculture 53(1): 13–27.
Gilmore, E. C., Jr. and J. S. Rogers. 1958. "Heat units as a method of measuring maturity in corn." Agron. J. 50: 611–615.
Jarosik, V., A. Honek, R. D. Magarey, and J. Skuhrovec. 2011. "Developmental database for phenology models: Related insect and mite species have similar thermal requirements." Journal of Economic Entomology 104: 1870–1876.
Klepper, B., R. K. Belford, and R. W. Rickman. 1984. "Root and shoot development in winter wheat." Agron. J. 76: 117–122.
McMaster, G. S. and D. E. Smika. 1988. "Estimation and evaluation of winter wheat phenology in the central Great Plains." Agric. Forest Meteorol. 43: 1–18.
McMaster, G. S. and W. W. Wilhelm. 1997. "Growing degree-days: One equation, two interpretations." Agric. Forest Meteorol. 87: 291–300.
Pedigo, L. P. and M. E. Rice. 2009. Entomology and pest management. New Jersey: Prentice Hall.
Russelle, M. P., W. W. Wilhelm, R. A. Olson, and J. F. Power. 1984. "Growth analysis based on degree days." Crop Sci. 24: 28–32.