Benefits of Yield Mapping
Crop yield varies due to many factors, such as soil type, soil moisture, fertility, hybrid, weather conditions, and pressure from diseases, insects, and weeds. Yield data is necessary for monitoring crop production and evaluating the economic benefits of management practices. The traditional method of monitoring yield is to weigh the bulk crop after harvest. However, this method only provides overall average yield for the field and does not provide any site-specific yield information. Yield maps created with on-the-go yield monitoring systems (YMS) and positioning equipment record yield flow data with spatially referenced field locations as the crop is being harvested. Field maps with yield data can show variability in yield patterns across fields. Site-specific yield maps point to high as well as low production areas. Areas with lower yields can be further investigated and correlated with other spatially referenced field data, such as soil fertility maps, drainage flow maps, or field scouting data. Yield maps provide a wealth of information that is useful for directing site-specific scouting and management techniques or identifying issues with field equipment mechanics or operation. Yield maps are often utilized to delineate management zones for variable-rate fertilizer or seeding applications. Areas that need drainage tile installation can also be located using information from yield maps. Additionally, yield maps can be useful for on-farm research studies to compare hybrids, chemical products, or other management practices.
Hardware Components for Yield Mapping
Grain and cotton yield mapping systems generally require the following hardware components:
- Yield flow sensor
- Moisture sensor (not yet available for cotton)
- Header position sensor
- Differential GNSS receiver
- Ground speed sensor (can be substituted with GNSS data)
- Computer display or field console
Grain Yield Flow Sensors
Research development has resulted in different types of yield sensors for grain combines (Tables 1 and 2). In systems utilizing an impact-plate sensor, grain mass-flow is indirectly measured by the impact of the grain on the plate. The Ag Leader® Yield Monitor 2000 impact-plate tested in a Missouri cornfield showed high correlation (r2 = 0.993) with the batch weights (Birrell, Sudduth, and Borgelt 1996). Impact-plate sensors are located on the inside of the grain tank at the top of the clean grain elevator just before the grain enters the loading auger (Figure 1). As the grain presses against the impact-plate, a load cell converts the applied pressure into a voltage signal that increases with higher pressure. The voltage is sent to the computer where it is converted from an analog to a digital signal. Impact-plate mass-flow sensors require multi-point calibration for best accuracy, because the flow rate (lbs/sec) is not linear with the voltage signal. The newer flow sensors, such as the flat impact-plate sensors found on the John Deere S-Series and Case IH AF 6140 combines (Figure 2), use multi-point calibration. Some of the older monitoring systems only have single-point calibration, such as the system with the curved impact-plate found on the John Deere STS combines (Figure 3). The impact-plate Fieldstar® II system is installed on AGCO combines, but an Ag Leader® sensor can alternatively be pre-installed on AGCO combines beginning with the 2015 models (Ag Leader). Ag Leader® sensors can also be retrofitted on many other machine models. Precision Planting has a new type of impact-plate yield sensor called YieldSense that may soon become the main system installed on combines (John Fulton, Ohio State University, personal communication, May 2016).
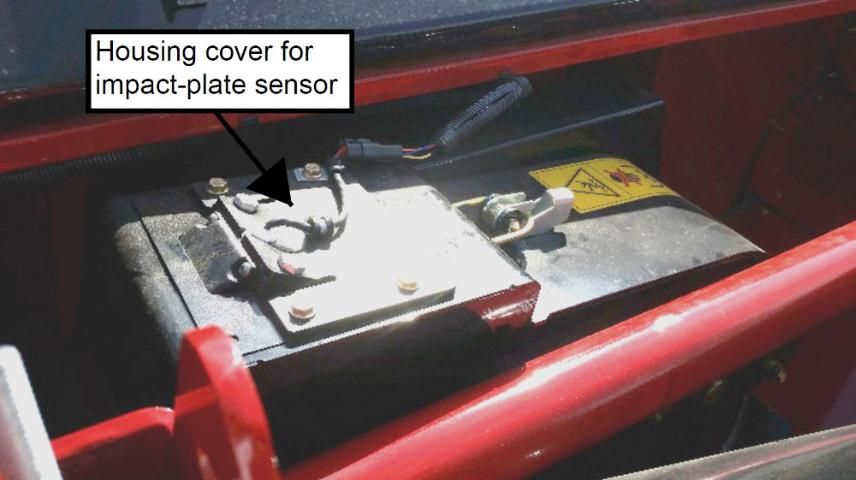
Credit: Rebecca Barocco, UF/IFAS
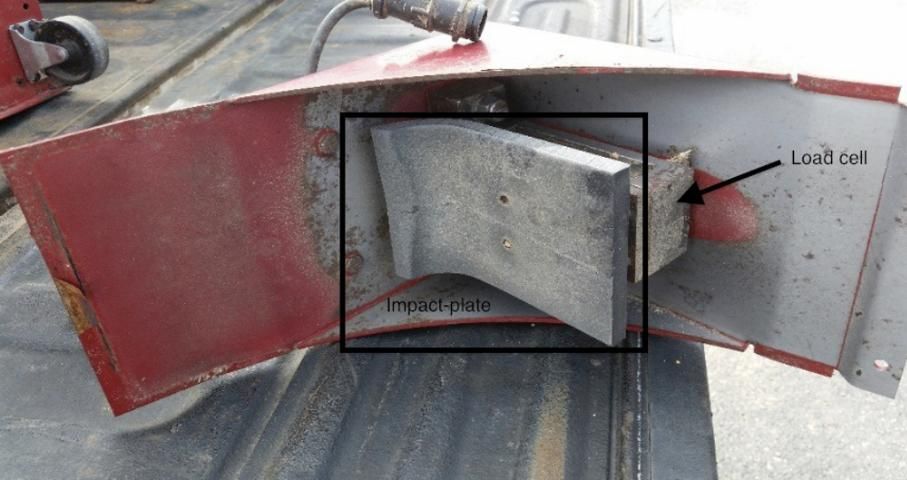
Credit: Rebecca Barocco, UF/IFAS
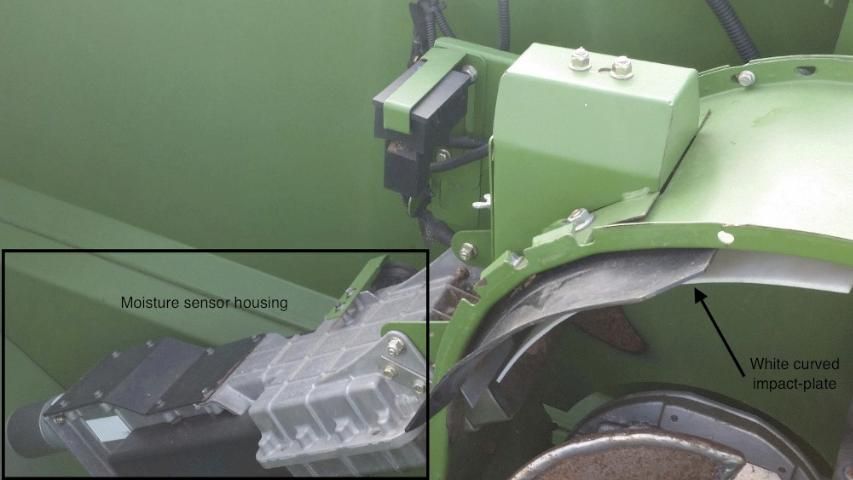
Credit: Rebecca Barocco, UF/IFAS
Optical sensors measure volume-flow using a light emitter on one side of the grain elevator and detectors on the other side that determine the height of grain held by the paddles over a certain amount of time (Reyns, Missotten, Ramon, and De Baerdemaeker 2002). CLAAS combines have an optical flow sensor. Accuracy of the optical system can be affected by conditions that cause changes in the surface of the scoops of the grain on the paddle, such as slope, moisture conditions, vibrations, and kernel type. A three-dimensional optical system using four sensors was developed to help reduce the likelihood of these errors (Strubbe, Missotten, and De Baerdemaeker 1996).
Yield flow measurements using optical sensors have also been made in the past with a paddle wheel method called the Claydon Yield-O-Meter (Reyns, Missotten, Ramon, and De Baerdemaeker 2002). A cell in the paddle fills with grain and then rotates, and the volume over a certain amount of time is calculated using the number of rotations and the size of the cell. The first published yield mapping study used the Yield-O-Meter on an Allis-Chalmers N6 combine (Searcy et al. 1989). The Yield-O-Meter was also once commercialized by CLAAS but has been replaced by the optical sensor called the Quantimeter II (Reyns, Missotten, Ramon, and De Baerdemaeker 2002). The Yield-O-Meter wheel system introduced an obstacle for the transport of the grain in the elevator if it was plugged by debris, such as soil or seeds (Strubbe, Missotten, and De Baerdemaeker 1996). Several methods of measuring yield flow by direct weight measurements have also been tested in early studies, but these are difficult to construct or have accuracy problems and have not been adapted for commercial systems (Reyns, Missotten, Ramon, and De Baerdemaeker 2002).
Grain Moisture Sensors
Weather conditions cause changes in humidity, rain, and temperature that lead to changes in grain moisture. Moisture sensors are utilized on grain combines to correct for dry yield by measuring capacitance of the grain as it flows through the elevator (Reyns, Missotten, Ramon, and De Baerdemaeker 2002). The moisture and temperature sensors on the Case IH and John Deere S-Series combines are located on the side of the lower clean grain auger. Every few seconds, clean grain will move through a hole out of the grain auger and into the collection cylinder (Figure 4), where it remains for about a second. The moisture sensor (Figure 5) inside the cylinder will then measure capacitance of the grain. The grain is then moved out of the cylinder and back into the lower clean grain auger by a smaller auger inside the cylinder (Figure 6).
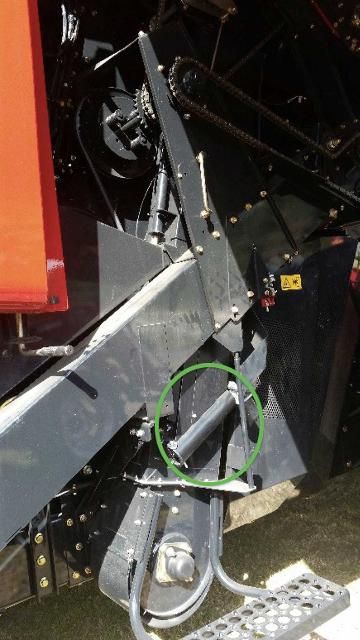
Credit: Rebecca Barocco, UF/IFAS
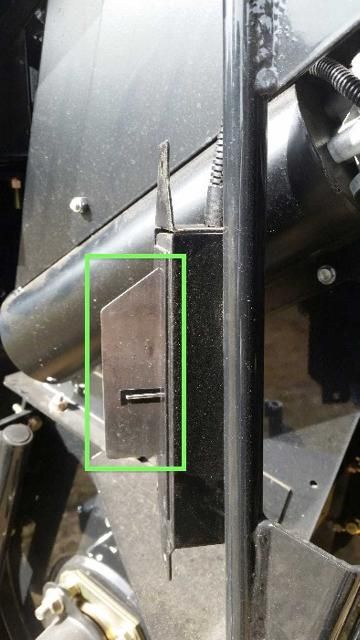
Credit: Rebecca Barocco, UF/IFAS
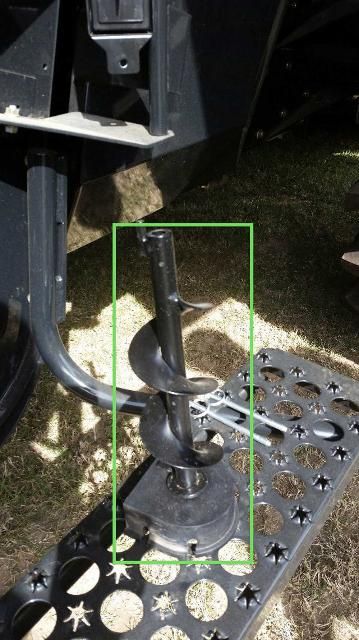
Credit: Rebecca Barocco, UF/IFAS
The YMS on the John Deere STS combines correlates yield using single data points with a linear increase in moisture for calibration. The YMS on the newer S-Series combines can capture multiple data points to improve measurement accuracy. A best-fit curve is calculated to obtain a much better yield estimation, particularly in scenarios with very high yield and low moisture or very high moisture and low yield. Knowing grain temperature can also improve accuracy of the moisture sensor. Grain temperature is taken at the same time as the moisture measurement in the cylinder on certain combines, such as the Case IH AF 6140 and John Deere S-Series. The moisture sensor on the John Deere STS combines does not have a temperature sensor. It is located at the top of the clean grain elevator next to the yield sensor (Figure 3).
Cotton Yield Flow Sensors
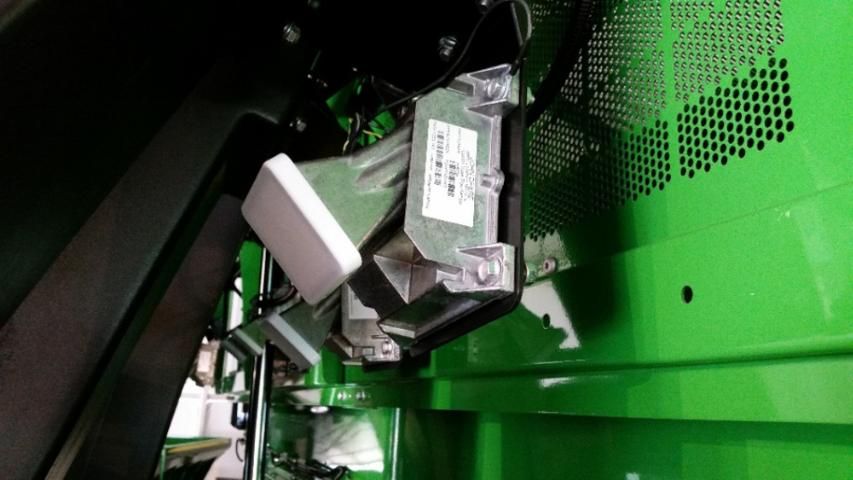
Three different types of cotton yield flow sensors are currently available in the market (Table 3). Commercial use of YMS technology has been less extensive for cotton than for grain production, but adoption is growing (Sui, Thomasson, and Ge 2012). Cotton yield sensors measure volume-flow by radiation reflectance from the cotton when it is being transported to a storage basket by way of pneumatic ducts. Optical yield sensors are installed within the ducts (Figures 7 and 8), whereas microwave yield sensors are mounted outside just behind the ducts (Figure 9). The lack of moisture sensors on cotton harvesters may contribute to errors in yield measurement, particularly under the high-humidity conditions in the Southeast.
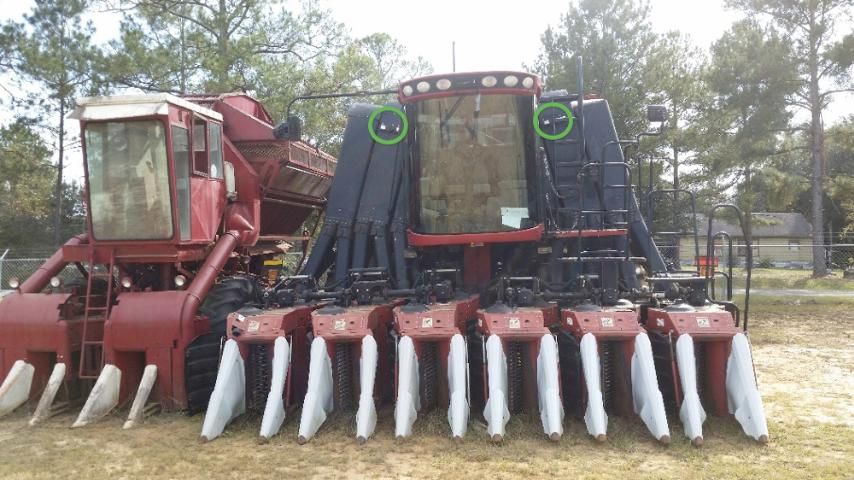
Credit: Rebecca Barocco, UF/IFAS
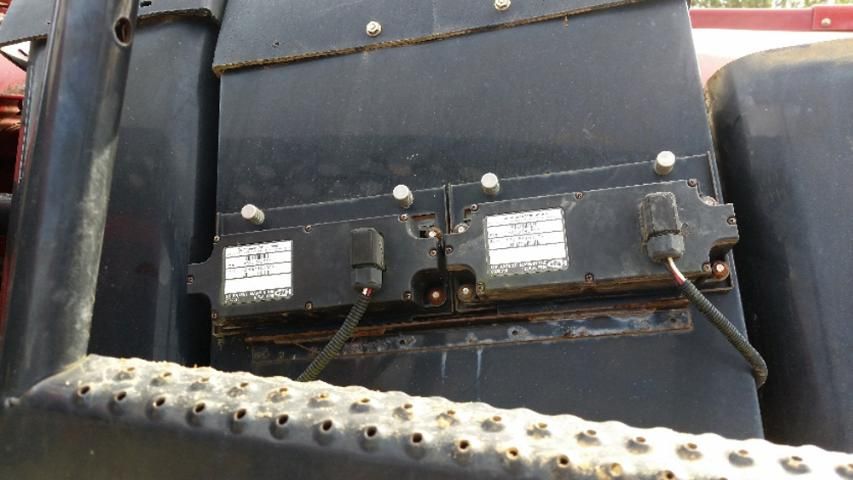
Credit: Rebecca Barocco, UF/IFAS
Credit: Rebecca Barocco, UF/IFAS
For optical yield sensors, a light emitter and detector are installed into a duct wall to measure the amount of light transmitted through or reflected from the cotton flowing through the ducts. The amount of light from the emitter that is transmitted or reflected onto the detector is used to calculate the volume. The Ag Leader® system has two mounts with the light emitter on one side of the duct and the light detector on the opposite side. The Ag Leader® system was field tested by the original developers at the University of Tennessee over three seasons with an average absolute error of 4% (Wilkerson, Moody, and Hart 2002). For optical sensors mounted on opposite sides to work properly, the light emitter and detector must be lined up; however, movements over time can cause misalignment of the two sensors (Sui et al. 2004). Wilkerson, Moody, and Hart (2002) say that installing a thick metal pipe adapter that replaces part of the uppermost conveyer pipe section has eliminated this movement.
The Cotton Yield Monitor System (CYMS) developed at the Mississippi State University and commercialized by MSTX Agriculture Sensor Technologies, LLC has addressed the issue of misalignment in a different way by having the light source and receiver mounted in the same port on the same duct wall (Sui et al. 2004; Sui, Thomasson, and Ge 2012). Field tests in Mississippi and Georgia indicated a high correlation between the yield monitor and scale weight (r2 = 0.99) with an average absolute error of 3.8% and maximum error of 12% among 42 loads. There was less than 5% error in 67% of the loads tested and less than 10% error in 95% of the loads. The CYMS performed well in showing field variability based on grower and consultant expectations and observations of other factors such as soil type (Sui et al. 2004).
Differential GNSS Receivers
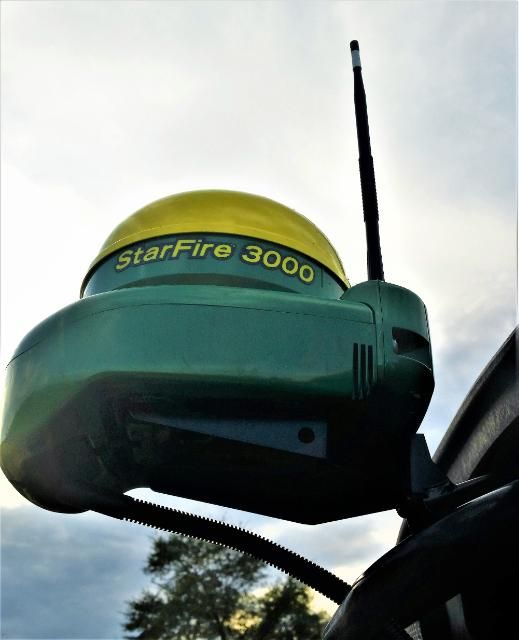
To generate a yield map, a positioning system is required to record the locations as yield is being measured across the field. A receiver that collects data from satellites is generally used to calculate the geographical locations. The receiver collects signals through an antenna that is externally mounted on top of the cab and connected to an in-cab receiver. The antenna and receiver may be mounted together on or near the top of the cab as one unit (Figure 10).
Credit: Rebecca Barocco, UF/IFAS
The Global Positioning System (GPS) and GLONASS are satellite constellations maintained by the United States and Russia, respectively. Many contemporary receivers are typically capable of adding GLONASS signals to the GPS signals for increased accuracy. Collectively, GPS and GLONASS are referred to as the Global Navigation Satellite System (GNSS). Other developing satellite constellations may become viable in the near future, particularly the European Union's Galileo system and Beidou from China.
Signals sent from the orbiting satellites are prone to a variety of errors while traveling from space to the receiver. The receivers on the harvesters can also receive error correction signals from stationary ground or satellite base stations with a known geographical position determined through high-standard surveying methods. The base station receiver calculates its location using the same orbiting satellite signals as the receiver on the harvester and determines the difference between the calculated location and the known location of the stationary base station. The base station then transmits the difference as a correction signal, commonly referred to as a differential signal, to the receiver on the harvester. Without a differential signal, GNSS receivers only have an accuracy of about 10 meters, which is not sufficient for precision agriculture operations. Several differential GNSS options are available with different levels of accuracy (Table 4). Real-time kinematic (RTK) is the most accurate technology. The highest accuracy is achieved when the base station required for RTK is set up as close to the harvester as possible.
Ground Speed Sensor
Ground speed is required to compute grain yield. Ground speed can be calculated using a GNSS receiver or alternatively using a sensor that monitors ground speed, such as the shaft speed type found on John Deere and Case IH combines. Most systems use GNSS for primary ground speed calculations and utilize a ground speed sensor as secondary input. For shaft speed types, a magnetic encoder determines the speed by counting pulses of the drive shaft from wheel rotation. Issues with this type of sensor include wheel slippage or tire deflection that can cause a reduced radius and create errors in speed calculation.
Header Position Sensor
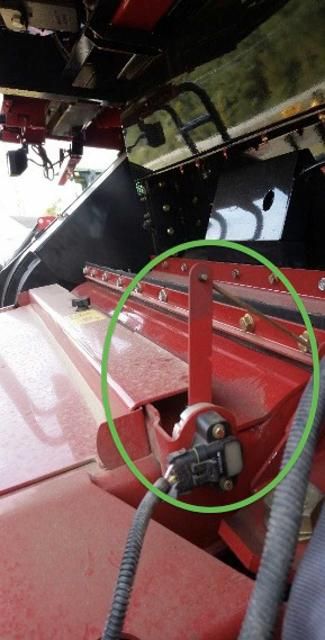
Header position sensors are also included to determine whether or not the harvester is active. The header position sensor (or potentiometer) is located on the side of the feeder house (Figure 11). The movement of the arm is converted to a voltage signal that is correlated with the height of the header.
Credit: Rebecca Barocco, UF/IFAS
Computer Display
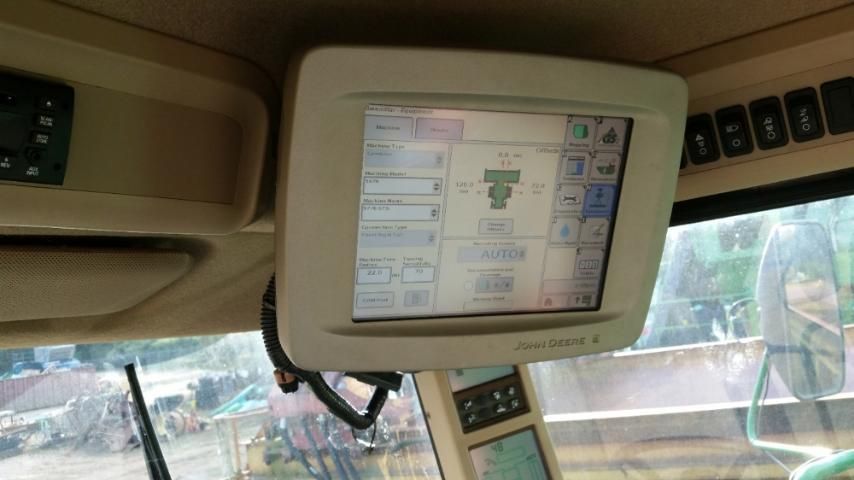
The computer display is located in the driver's cab (Figure 12). The computer collects the information from the yield flow sensors and GNSS receiver to calculate yield on-the-go, which is then displayed as a map in real time on the console screen. The display is also used by the grower to input information, such as the header width, field name, crop type, and cultivar. The software on the computer is generally sold as part of a mapping software system with other precision agriculture solutions, such as John Deere's Agricultural Management Solutions (AMS), Case IH's Advanced Farming Systems (AFS), New Holland's Precision Land Management (PLM), and AGCO's Fuse® Technology. The resulting map can be further analyzed using the standard integrated system, or it can be imported into other mapping analysis software if preferred, such as Ag Leader®'s SMS™ or ESRI®'s ArcMap™. Combine manufacturers offer display options that come pre-installed with their systems, but other computer displays, such as the Ag Leader® Integra or Trimble® FmX®, are also available through third party dealers. Computer displays and the GNSS receivers can be moved between harvesters and tractors used for other precision agriculture technologies, so they can be used for more than yield mapping.
Credit: Rebecca Barocco, UF/IFAS
On some display models such as the John Deere (JD) GreenStarTM 2 (GS2) 2600, the map is stored as a file on a PC card or USB flash drive so the file can be transferred to a computer with mapping analysis software. The newer JD GS3 2630 display can transmit the data wirelessly for an additional account fee to My John Deere's Operation Center using the JD Link/Connect system or Mobile Data Transfer. A cell phone with Apple iOS7, Android Jelly Bean, or later operating systems is required for the Mobile Data Transfer service. Other display manufacturers may also have similar services. Displays compatible with the Mobile Data Transfer Stick include JD GS3 2630 and Ag Leader® Integra and Versa. Prescription files from other precision agriculture applications can be transmitted from the Operation Center using the JD GS3 2630, Ag Leader® Integra and Versa, Raven Envizio Pro™ and Viper® 4, and Trimble® FmX®.
Yield Calculation and Calibration
Yield is defined as crop weight (lbs for cotton) or volume (bu for grains) harvested per unit area, which is indirectly measured by the yield sensor flow rate/(speed x swath width). Yield flow rate is typically calculated every 1–2 seconds during harvesting. The start and end times for each row pass are adjusted depending on the amount of time the crop takes to move through threshing, separating, and cleaning to the location of the yield sensor. The delays for start-of-pass and end-of-pass will depend on the crop and speed of the combine. Mathematical interpolation techniques have been employed to remove noise due to errors and frequent spikes in the raw sensor and location data (Searcy et al. 1989; Birrell, Sudduth, and Borgelt 1996). The spike errors result in high yield outliers where the interpolation techniques can be used to create maps that display smoother trends across the field.
Yield sensors indirectly measure yield as a mass force or volume measurement. The yield calculation that converts to weight depends on the crop; therefore, the yield calculation needs to incorporate a calibration factor. Proper sensor calibration is crucial for collecting accurate yield data. A calibration curve is determined by comparing the scale weights of four or five loads with the calculated yield. Moisture sensors may also be corrected periodically using a comparison with a handheld sensor. Yield sensors should be recalibrated as variables change, such as moisture content or hybrid. However, using the YieldSense monitor removes the need for recalibration after the initial calibration at the beginning of the season (Precision Planting). For cotton, Wilkerson, Moody, and Hart (2002) suggest that calibration at each change in variety could have improved the error observed in their study. Sui et al. (2004) also suggest limiting calibration for cotton at the beginning of each season but then post-processing the yield data as a more practical method than multiple calibrations. To improve accuracy, post-processing calculates a ratio of the real-time yield monitor calculations from the total over the season measured at the beginning to calibrate yield monitor measurements based on actual yield that was harvested. The grower can receive an estimated real-time value while harvesting as well as more accurate calculations at the end of the season after post-processing (Sui et al. 2004). A cotton quality monitor is a recent conception that could be used in conjunction with the yield monitors to improve the yield map (Sui, Thomasson, and Ge 2012), but this has not yet been commercialized.
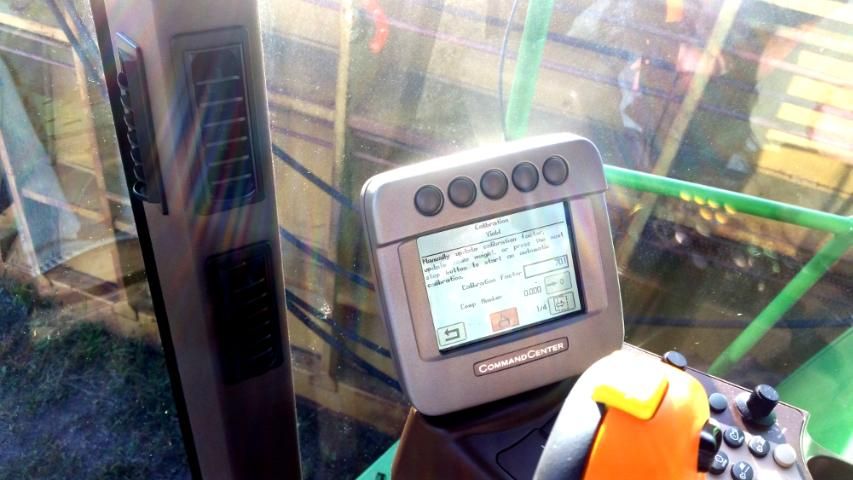
As an example, the calibration factor for John Deere YMS is calculated using Equation 1. The John Deere system requires the use of a second console that comes standard for general combine controls. The console is the smaller GS3 Touchscreen CommandCenter located on the arm in the cab (Figure 13), which is connected with the larger GS computer display. The CommandCenter is required to enter calibration information to determine the calibration factor.
C=C std x Wmonitor (1)
Wscale
C = calibration factor
Cstd = standard calibration factor based on grain type or previous calibration factor
Wmonitor = weight of the grain calculated by the YMS that appears on the display
Wscale = scale weight of a load of grain
Credit: Rebecca Barocco, UF/IFAS
The steps to the John Deere combine calibration system are as follows:
- Make sure the grain tank is empty.
- If known, enter the calibration factor.
- Enter the maximum scale weight.
- Start harvesting until the grain tank has collected no more than the maximum capacity of the scale cart. This capacity is generally about 2,000 lbs. At least 1,000 lbs should be collected for calibration.
- Unload the grain tank and transport to obtain a scale weight. This may require a long distance, depending on the field and the location of the scale.
- Stop the calibration once the threshing and separating system is done and the elevator is cleaned out (automated by the Harvest Monitor software).
- Enter the scale weight of the load of grain.
- A new calibration factor is calculated.
More detailed information on calibration and post-processing methods can be found in the following University of Nebraska Lincoln Extension publications:
Luck, J. D. and J. P. Fulton. 2014. "Best Management Practices for collecting accurate yield data and avoiding errors during harvest." http://extensionpublications.unl.edu/assets/pdf/ec2004.pdf
Luck, J. D., N. Mueller, and J. P. Fulton. 2015. "Improving yield map quality by reducing errors through yield data file post-processing." http://extensionpublications.unl.edu/assets/pdf/ec2005.pdf
Costs of Yield Mapping Hardware Components
Yield monitoring sensors come pre-installed in most of the new grain and cotton harvesters. Table 5 lists the hardware components required for yield mapping that are standard for new John Deere, Case IH, New Holland, and AGCO harvesters. The specific costs mentioned here are subject to change over time. The DGNSS receiver and computer display can be used for other applications, so the additional costs for these may be spread over other precision agriculture operations. Retrofitting an older harvester will cost about $10,000–$12,000 for the entire system. The higher accuracy subscription-based DGNSS systems could add a significant activation charge of roughly up to $4,000 plus a yearly subscription. Local base station RTK is not subscription-based, but it would require an activation charge and the additional purchase of an RTK radio. Although RTK may not be necessary for yield monitoring, receivers that can process RTK signals could be the best investment for future use during operations where high accuracy and/or long-term repeatability is required, such as auto-steering and precision seeding.
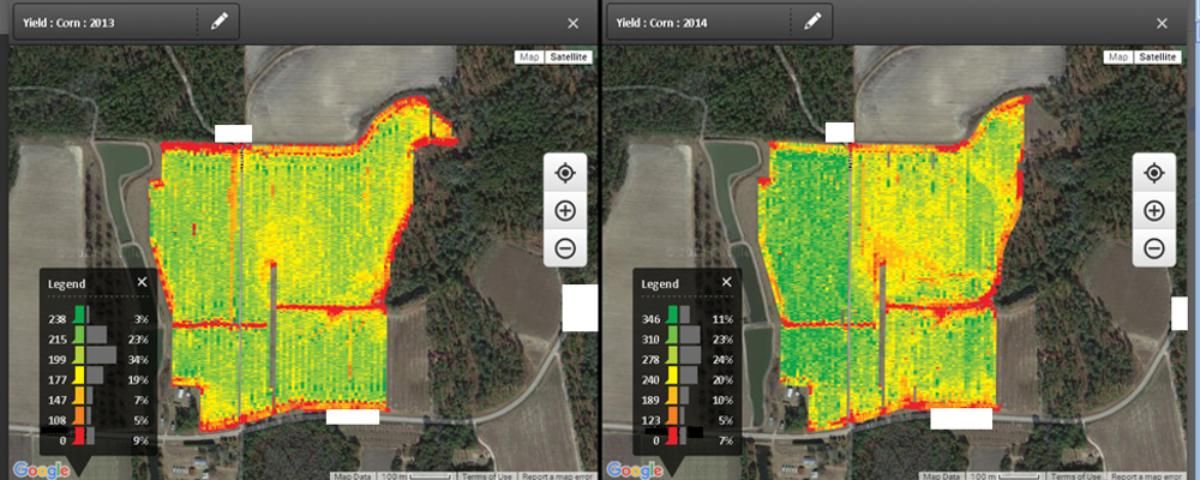
The costs mentioned here are only for the hardware components required for yield mapping. Analysis of yield maps (Figure 14) is the next step and is required for making crop-related management decisions. Analysis would require additional processing and/or advising costs. Although product advances are constantly improving this technology, such as the instant yield-by-hybrids reports generated using the YieldSense system (Precision Planting), yield mapping is part of a whole precision agriculture management system that requires additional data, ground-truthing, and interpretation. Management practices based on interpreting map data that save on inputs and/or increase yields, such as variable rate technology, will be necessary to make spatial data analysis profitable. Site-specific management may increase profits, but producers should individually evaluate the cost effectiveness of precision agriculture systems for their operations. Larger operations will be able to spread the costs over more acres. Yield mapping is the most practical initial step that can help estimate the benefit of adopting a precision agriculture management system.
Credit: Garret Hortman using My John Deere's Operation Center
Commercial development of mapping systems using instantaneous yield monitoring sensors has been focused primarily on grains and, to a lesser extent, cotton. Development and adoption of on-the-go sensor systems for other crops would depend on whether producers find yield mapping to be economically beneficial for their operations. For example, systems for peanut have been developed (Rains, Perry, and Vellidis 2005; Thomasson et al. 2006). One modified from the cotton system is commercially available (MSTX Agriculture Sensor Technologies, LLC), but it has not been adopted yet. Precision agriculture applications could help producers save on input costs and also protect and preserve natural resources by reducing fertilizer leaching, pesticide applications, and water use. For this reason, cost share programs are available to help with this promising investment.
Recommended Videos
The following videos by former Alabama Precision Ag Team leader Dr. John Fulton are highly recommended for more information on yield mapping and GPS/GNSS technology.
Yield Mapping: https://www.youtube.com/watch?v=mq_8Ckhl2es
GPS/GNSS: https://www.youtube.com/watch?v=b9VGjvOgcAA
These videos and other lessons on precision agriculture in agronomic crop production can also be accessed through the following website: http://www.aces.edu/anr/precisionag/PrecAgLessons/index.php
Acknowledgments
Special thanks to Jacob Bell, precision farming specialist at DeMott Tractor Company in Moultrie, GA, for showing and discussing the hardware components on Case IH harvesters.
References
AGCO Gleaner. 2017. "Product configurator." Build and Quote. Accessed on January 7, 2017. http://www.gleanercombines.com/special-offers/build-and-quote.html
AGCO Massey Ferguson. 2017. "Build my Massey Ferguson." Accessed on January 7, 2017. http://www.masseyferguson.us/sales-and-support/build-my-massey-ferguson.html
Ag Leader. 2014. "Ag Leader yield monitoring system offered on North American AGCO combines." Precision Point Blog. Accessed on January 7, 2017. http://www.agleader.com/blog/ag-leader-yield-monitoring-system-offered-on-north-american-agco-combines/
Birrell, S. J., K. A. Sudduth, and S. D. Borgelt. 1996. "Comparison of sensors and techniques for crop yield mapping." Comput. Electron. Agr. 14: 215–233.
Case IH. 2017. "Build and price." Axial-Flow® Combines. Accessed on January 7, 2017. http://www.caseih.com/northamerica/en-us/products/harvesting/axial-flow-combines
John Deere. 2017. "Build your own." S-Series. Accessed on April 4, 2017. https://configure.deere.com/cbyo/#/en_us/products/agriculture/grain_harvesting/combines/s-series
New Holland. 2017. "Build & price." Accessed on January 7, 2017. http://agriculture1.newholland.com/nar/en-us/about-us/buying-services/sale/build-price
Precision Planting. 2017. "Harvest/Planning." YieldSense. Accessed on January 7, 2017. http://www.precisionplanting.com/#products/yieldsense/
Rains, G. C., C. D. Perry, and G. Vellidis. 2005. "Adaptation and testing of the Agleader cotton yield sensor on a peanut combine." Appl. Eng. Agric. 21(6): 979–983.
Reyns, P., B. Missotten, H. Ramon, and J. De Baerdemaeker. 2002. "A review of combine sensors for precision farming." Precis. Agric. 3(2): 169–182.
Searcy, S. W., J. K. Schueller, Y. H. Bae, S. C. Borgelt, and B. A. Stout. 1989. "Mapping of spatially-variable yield during grain combining." T. ASAE 32(3): 826–829.
Strubbe, G., B. Missotten, and J. De Baerdemaeker. 1996. "Performance evaluation of a three-dimensional optical volume flow meter." Appl. Eng. Agric. 12(4): 403–409.
Sui, R., J. A. Thomasson, and Y. Ge. 2012. "Development of sensor systems for precision agriculture in cotton." Int. J. Agri. and Biol. Eng. 5(4): 1–14.
Sui, R., J. A. Thomasson, R. Mehrle, M. Dale, C. Perry, and G. Raines. 2004. "Mississippi cotton yield monitor: Beta test for commercialization." Comput. Electron. Agr. 42(3): 149–160.
Thomasson, J. A., R. Sui, G. C. Wright, and J. A. Robson. 2006. "Optical peanut yield monitor: Development and testing." Appl. Eng. Agric. 22(6): 808–818.
Wilkerson, J. B., F. H. Moody, and W. E. Hart. 2002. "Implementation and field evaluation of a cotton yield monitor." Appl. Eng. Agric. 18(2): 153–159.