Introduction
Market cattle shown at county and state fairs and other youth shows across the United States are food animals. The endpoint value of food animals is primarily based on their carcass merit. The merit of a beef carcass is based on three variables: 1) animal or carcass weight; 2) quality of lean; and 3) quantity of lean.
Most packers want beef carcasses that range from 600 to 950 pounds, which means that the cattle weigh approximately 1000–1400 pounds. Carcasses under 600 pounds are less profitable for most packers because of the greater production costs per pound of carcass. Carcasses over 950 pounds (and certainly those over 1000 pounds) will generate retail cuts larger than what most consumers would prefer. Carcasses outside this weight range customarily receive a discounted price (USDA-AMS 2011a).
Slaughtering animals to evaluate lean quality, actual fat thickness, and ribeye area from chilled carcasses is certainly the preferred method to assess carcass merit. However, if carcass data are not available, ultrasound evaluation of the live animal is an excellent method to predict fat thickness and ribeye area (Greiner et al. 2003; Williams 2001; Perkins et al. 1997; Perkins, Green, and Hamlin 1992).
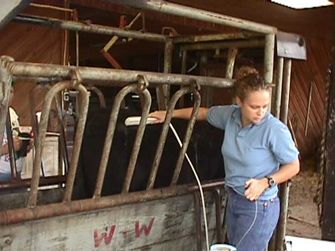
What is the technician doing in Figure 1?
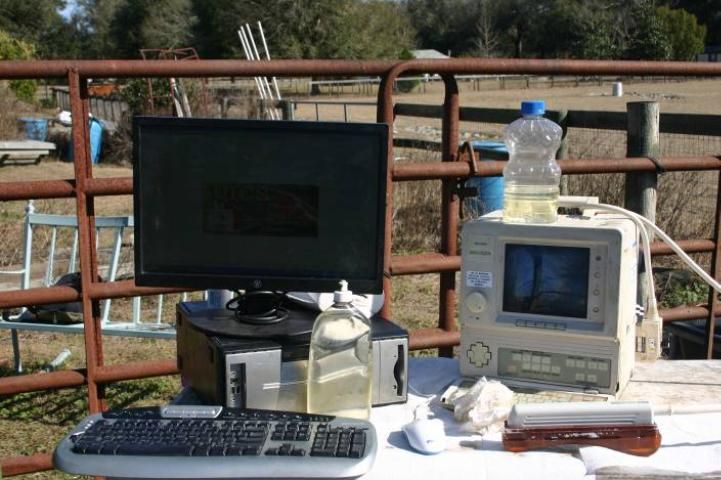
In Figure 1, the technician is using ultrasound to assess how much external fat and muscle this beef animal has using a real-time ultrasound machine. The ultrasound machine can be described as real-time because it updates the image at a high rate of speed, creating an image similar to a movie. Real-time machines (Figure 2) can be very accurate when used by properly trained technicians (Greiner et al. 2003; Williams 2001).
Credit: University of Georgia
Credit: Mark Shuffitt
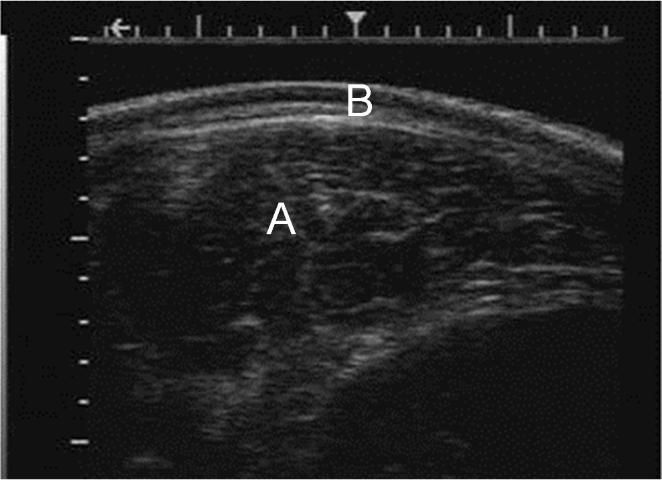
Figure 3 shows an example of an ultrasound machine image.
Credit: Jentech Ultrasound (2011)
What is the technician measuring?
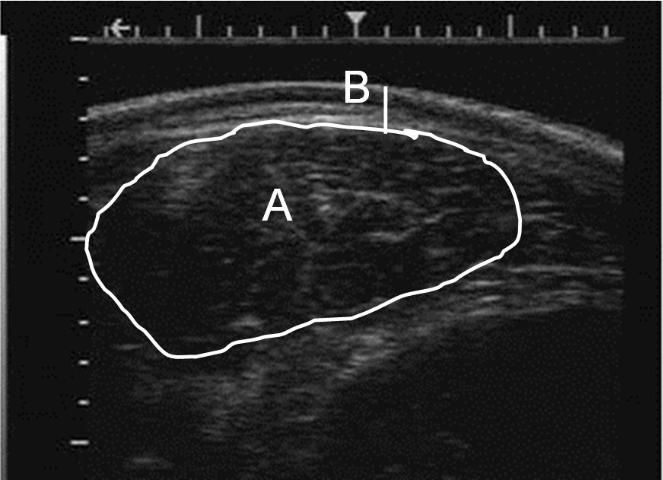
In Figure 3, the technician is using the machine to measure the area of the ribeye (A) and how much fat is deposited over the ribeye (B).
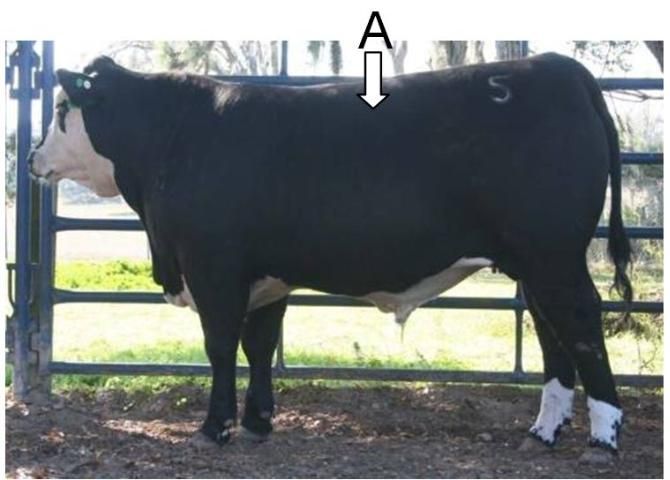
Where is the technician measuring?
Figure 4 shows the area where the technician will measure using the ultrasound. The ultrasound technician will find the last rib (A) and place the probe on the ribeye muscle between the last and 12th rib.
Credit: University of Florida
After the technician gets the image at the proper location what does the technician do?
Once the technician gets a high quality image, he or she will use the computer to trace the ribeye (A) and fat thickness ¾ of the distance from the middle of the animal (B) (see Figure 5).
Credit: Jentech Ultrasound (2011)
How accurate are the ultrasound estimates of fat thickness and ribeye area to the actual carcass measurement?
Greiner et al. (2003) reported the average difference between the ultrasound measurement and carcass measurement for fat thickness to be 0.07 in and ribeye area to be 0.51 in2. Generally, ultrasound estimates will tend to err toward the middle.
Specifically, Greiner et al. (2003) found that ultrasound measurements slightly overestimated (0.06 in) fat thickness on lean cattle (= 0.30 in backfat), slightly underestimated (0.05–0.07 in) fat thickness on cattle with intermediate fatness (0.31–0.59 in backfat), and underestimated fat thickness (0.12 in) on fatter cattle (= 0.60 in). The ultrasound measurements overestimated ribeye area by 0.48–0.66 in2 when cattle had a small ribeye (= 12.0 in2) and underestimated ribeye area by 0.47–0.81 in2 when cattle had an actual ribeye area = 13.0 in2.
How well do ultrasound images of fat thickness and ribeye area replicate the actual carcass?
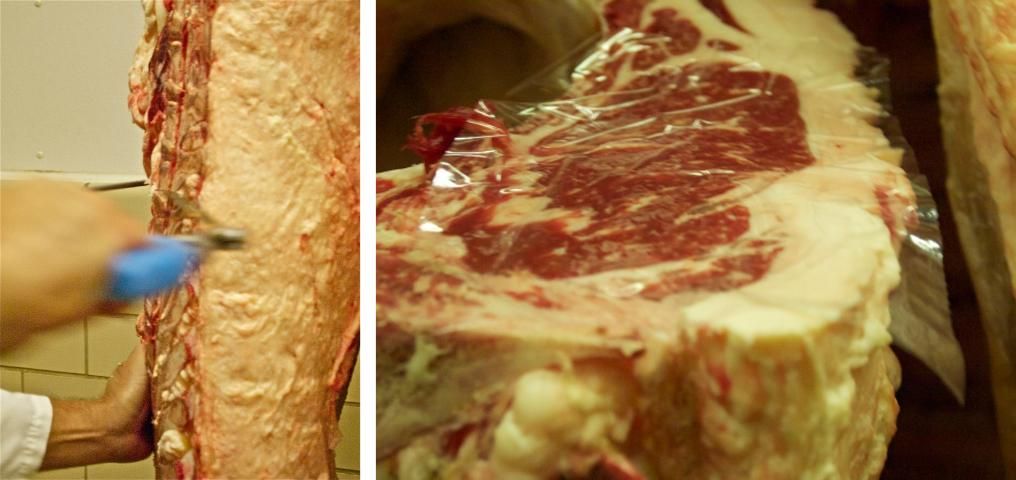
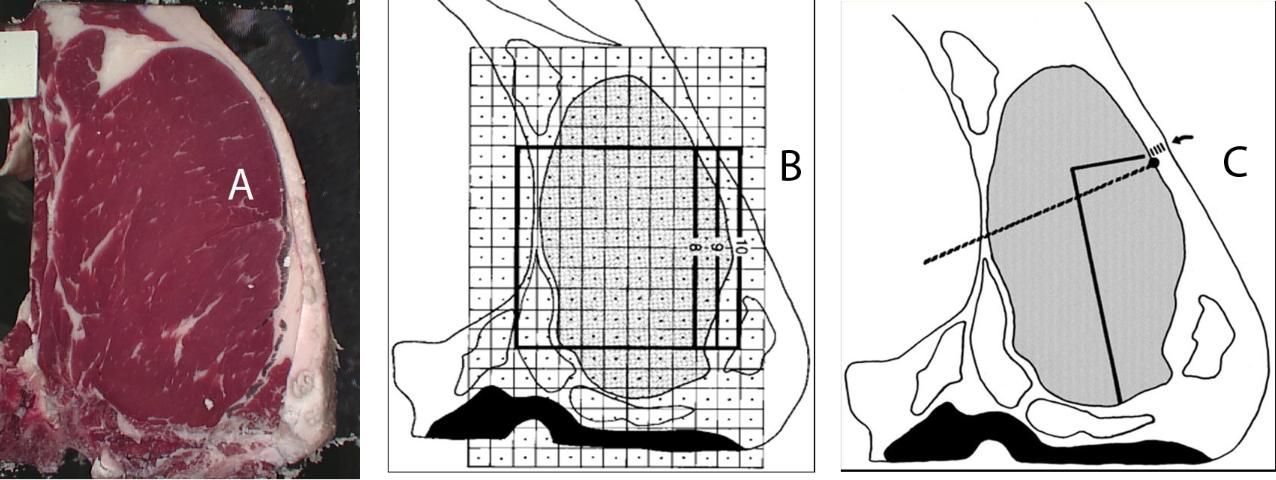
See Figures 6 and 7 for an example of how ultrasound images replicate the fat thickness and ribeye area of the actual carcass.
Credit: Chris Raines
Credit: American Meat Science Association
What is the value in determining ribeye area and fat thickness?
Ultrasound images can provide valuable information to cattle producers. The ultrasound measurements for fat thickness and ribeye area, when combined with estimated carcass weight and estimated percentage of kidney, pelvic, and heart fat, can be used to predict USDA yield grade (Table 1).
How should hot carcass weight and percentage of kidney, pelvic, and heart (KPH) fat be estimated?
To estimate hot carcass weight, use a standard dressing percentage. Table 1 uses a dressing percentage of 63% to estimate hot carcass weight. Kidney, pelvic, and heart fat percentage is a visual estimate or an actual weight of those three fat depots presented as a percentage of hot carcass weight. The average for KPH percentage of fed cattle was 2.3% in the 2005 National Beef Quality Audit (Garcia et al. 2008). The KPH percentage used for the calculations in Table 3 is 2.5%.
Ultrasound technicians do not have to use the estimates for dressing and KPH percentage suggested in this document, but technicians should use the same percentages for all animals when calculating USDA yield grade.
What does USDA yield grade predict?
The USDA yield grade equation predicts the percentage of boneless, closely-trimmed round, loin, rib, and chuck.
Can marbling within the ribeye be evaluated using ultrasound?
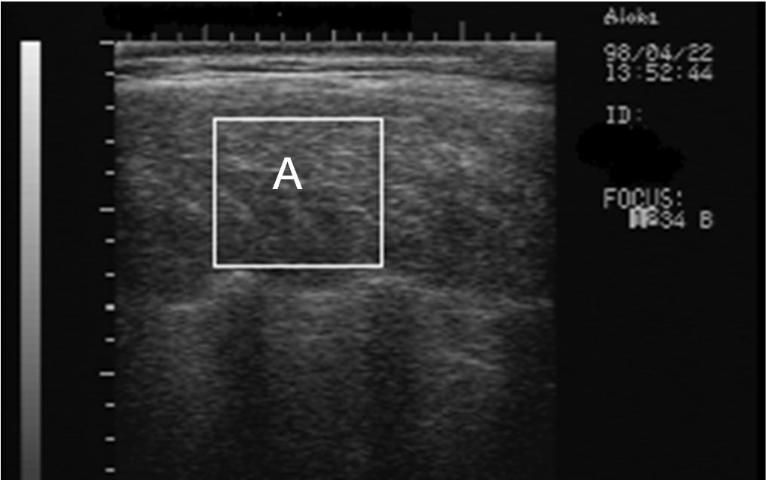
Yes, marbling (or intramuscular fat) can be predicted rather accurately using ultrasound technology. The ultrasound image (Figure 8) looks different because the probe is placed parallel to the spine along the ribeye muscle from the 11th to 13th rib, rather than perpendicular to the spine, which is how to scan for fat thickness and ribeye area. The area within the box (A) is interpreted by a computer program to predict the percentage of intramuscular fat (Figure 8).
Credit: Photo modified from http://www.bovineengineering.com
How accurate are the ultrasound estimates of marbling to the actual carcass measurement?
The review by Williams (2001) reported correlations between ultrasound intramuscular fat and actual carcass marbling scores to range from 0.69 (Perkins et al. 1997) to 0.85 (Brethour 2000).
What is the value in determining intramuscular fat within the ribeye?
Predicting marbling using ultrasound technology is valuable because the percentage of intramuscular fat within the ribeye associates with an approximate USDA marbling score (Table 2; USDA-AMS 1997).
What does USDA marbling score predict?
If the animal is less than approximately 30 months of age, USDA marbling score directly associates with USDA quality grade (Table 2; USDA-AMS 1997). Over a wide range of marbling scores, the amount of intramuscular fat is the driving force in consumer eating satisfaction of beef tenderness, juiciness, and flavor (Smith et al. 1987).
Why does the technician measure fat thickness, ribeye area, and intramuscular fat at that location?
The location used in ultrasound technology is where fat thickness, ribeye area, and USDA marbling score are measured to calculate USDA yield and quality grades (USDA-AMS 1997). Carcass weight and USDA yield and quality grades are the primary drivers of price discovery for market cattle and beef carcasses. Average carcass quality grade base prices are published daily (USDA-AMS 2011b), and average yield grade and carcass weight premiums and discounts are published weekly (USDA-AMS 2011a).
Which carcasses are the best?
The answer to this question is somewhat subjective, but carcass value is objective. The free market system dictates base carcass values and discounts, which the USDA reports weekly (USDA-AMS 2011b). The values reported on March 19, 2012, were used as the adjusted values per hundred weight to calculate the total adjusted carcass value of the set of example carcasses presented in Table 3.
In Table 3, Carcass 6 has the greatest total carcass value by over $200. This advantage is primarily driven by its 70-pound advantage in carcass weight. However, this carcass has excess trimmable fat and will generate some cuts that are too large for many applications. The carcass that maximizes all industry targets the best is Carcass 7. It is a premium choice, yield grade 2 carcass with an optimal carcass weight. Carcass 10 has the same adjusted carcass value per hundred weight as Carcass 7, but it has the second lowest total carcass value because it is such a lightweight carcass.
Cattle with similar total adjusted carcass values should be ranked by adjusted carcass value per hundred weight. Those with the same estimated carcass value per hundred weight should be ranked on final estimated yield grade and/or ribeye per hundred weight.
Conclusion
Ideally, carcass merit should be assessed from actual carcasses. However, when carcass data cannot be collected, ultrasound evaluation of market cattle is an excellent method to accurately assess differences in fat thickness, ribeye area, and percentage of intramuscular fat within the ribeye.
References
Brethour, J.R. 2000. "Using Serial Ultrasound Measures to Generate Models of Marbling and Backfat Thickness Changes in Feedlot Cattle." J. Anim. Sci. 78:2055-61.
Garcia, L.G., K.L. Nicholson, T.W. Hoffman, T.E. Lawrence, D.S. Hale, D.B. Griffin, J.W. Savell, D.L. VanOverbeke, J.B. Morgan, K.E. Belk, T.G. Field, J.A. Scanga, J.D. Tatum, and G.C. Smith. 2008. "National Beef Quality Audit—2005: Survey of Targeted Cattle and Carcass Characteristics Related to Quality, Quantity, and Value of Fed Steers and Heifers." J. Anim. Sci. 86:3533-43.
Greiner, S.P., G.H. Rouse, D.E. Wilson, L.V. Cundiff, and T.L. Wheeler. 2003. "The Relationship between Ultrasound Measurements and Carcass Fat Thickness and Longissimus Muscle Area in Beef Cattle." J. Anim. Sci. 81:676-882.
Perkins, T.L., R.D. Green, and K.E. Hamlin. 1992. "Evaluation of Ultrasonic Estimates of Carcass Fat Thickness and Longissimus Muscle Area in Beef Cattle." J. Anim. Sci. 70:1002-10.
Perkins, T.L., J.C. Paschal, N.C. Tipton, and M.J. De La Zerda. 1997. "Ultrasonic Prediction of Quality Grade and Percent Retail Cuts in Beef Cattle." J. Anim. Sci. 75(Suppl. 1):178 (Abstr.).
Smith, G.C., J.W. Savell, H.R. Cross, Z.L. Carpenter, C.E. Murphey, G.W. Davis, H.C. Abraham, F.C. Parrish Jr., and B.W. Berry. 1987. "Relationship of USDA Quality Grades to Palatability of Cooked Beef." J. Food Quality 10:269-86.
USDA-AMS (United States Department of Agriculture, Agricultural Marketing Service). 1997. United States Standards for Grades of Carcass Beef. Accessed May 25, 2012. http://www.ams.usda.gov/AMSv1.0/getfile?dDocName=STELDEV3002979.
USDA-AMS. 2011a. National Weekly Direct Slaughter Cattle - Premiums and Discounts for the Week of: 11/7/2011. Accessed November 7, 2011. http://www.ams.usda.gov/mnreports/lm_ct155.txt.
USDA-AMS. 2011b. National Daily Boxed Beef Cutout and Boxed Beef Cuts. Accessed November 7, 2011. http://www.ams.usda.gov/mnreports/lm_xb403.txt.
Williams, A.R. 2001. "Ultrasound Applications in Beef Cattle Carcass Research and Management." J. Animal Science 80, Supplement 2: E183-E188. Accessed September 25, 2012. http://www.tallgrassbeef.com/pdf_uploads/WilliamsUltrasoundArticle.pdf.