This section contains basic information on vegetable water use and irrigation management, along with some references on irrigation systems. Proper water management planning must consider all uses of water, from the source of irrigation water to plant water use. Therefore, it is very important to differentiate between crop water requirements and irrigation or production system water requirements. Crop water requirements refer to the actual water needs for evapotranspiration (ET) which are related to soil type and plant growth, and primarily depend on crop development and climatic factors which are closely related to climatic demands. Irrigation requirements are primarily determined by crop water requirements, but also depend on the characteristics of the irrigation system, management practices, and the soil characteristics in the irrigated area.
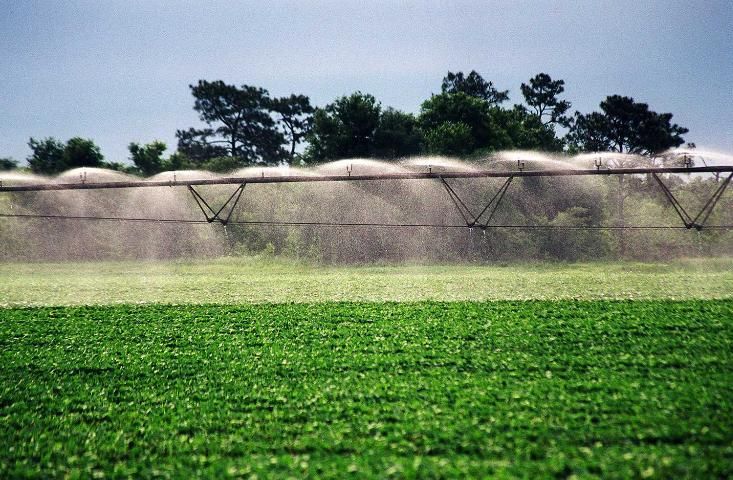
Credit: UF/IFAS Photography
Best Management Practices (BMP) for Irrigation
BMPs have historically been focused on nutrient management and fertilizer rates. However, as rainfall or irrigation water is the vector of off-site nutrient movement of nitrate in solution and phosphate in sediments as well as other soluble chemicals, proper irrigation management directly affects the efficacy of a BMP plan. The irrigation BMPs in the "Water Quality/Quantity Best Management Practices for Florida Vegetable and Agronomic Crops" (accessible at https://www.fdacs.gov/Divisions-Offices/Agricultural-Water-Policy) manual cover all major aspects of irrigation such as irrigation system design, system maintenance, erosion control, and irrigation scheduling.
Irrigation Water Quality Criteria
Understanding irrigation water quality is critical for sustainability of vegetable production. In some areas of Florida, water quality impacts crop productivity more than soil fertility, pest and weed control, variety, and other factors. Irrigation water quality is determined by the following: (1) salinity hazard: total soluble salt content; (2) sodium hazard: ratio of sodium (Na+) to calcium (Ca2+) and magnesium (Mg2+) ions; (3) water pH; (4) alkalinity: carbonate and bicarbonate; specific ions: chloride (Cl-), sulfate (SO42-), boron (BO3-), and nitrate-nitrogen (NO3-N); (5) organic contaminates: oil pollutants; and (6) other factors such as heavy metals. Among these factors, salinity is most significant particularly in those areas close to the coast where salt content in ground water is frequently high. Irrigation water quality can be evaluated based on electrical conductivity (Table 1).
There are two main issues related to salinity: short term, i.e., effect of water electrical conductivity on a particular crop and long term, namely, soil salinization. There is abundant biodiversity in crop tolerance to salinity stresses (Tables 2 and 3). Generally speaking, vegetable crops are more susceptible than cereal crops.
Salinity level (dS/m) of irrigation water for 100% productivity (zero yield loss) or zero productivity (zero yield) in vegetable production
Also, different vegetable species differ significantly in tolerance to salinity stress. For example, tomato is relatively tolerant to salinity stress. At 1 dS m-1, tomato yield increased with N rate but there was no yield response to N fertilization at 5 dS m-1. However, carrot is rated as a sensitive crop. Root yield declines 14% for every unit increase in salinity beyond the threshold of 1 dS m-1. Therefore, irrigation management for vegetable production needs to be more careful. To avoid any accidental economic loss, before irrigating vegetable crops, irrigation water quality should be checked based on electrical conductivity with an appropriate salinity meter at least once a year, particularly in the near coastal areas. Vegetable growers may need to consult their extension agent to interpret the results.
Uses of Irrigation Water
Irrigation systems have several uses in addition to water delivery for crop ET. Water is required for a preseason operational test of the irrigation system to check for leaks and to ensure proper performance of the pump and power plant. Irrigation water is also required for field preparation, crop establishment, crop growth and development, within-season system maintenance, delivery of chemicals, frost protection, and other uses such as dust control.
Field Preparation
Field preparation water is used to provide moisture to the field soil for tillage and bed formation. The water used for field preparation depends on specific field cultural practices, initial soil moisture conditions, the depth to the natural water table, and the type of irrigation system. Drip-irrigated fields on sandy soils often require an additional irrigation system for field preparation because drip tubes are not installed until the beds are formed. Many drip irrigated vegetable fields may also require an overhead or subirrigation system for field preparation. However, sprinkler irrigation systems can meet different water requirements. For example, sprinkler irrigation systems installed in many strawberry production fields can work for both irrigation and frost protection. These systems are also used for field preparation and may apply one or more inches of water for this purpose. Subirrigated fields use the same system for field preparation as well as for crop establishment, plant growth needs, and frost protection. Subirrigation water management requirements depend on the soil characteristics within the irrigated field and surrounding areas. Sufficient water must be provided to raise the water table level as high as 18 to 24 inches below the soil surface. Water is required to fill the pores of the soil and also satisfies evaporation and subsurface runoff requirements. As a rough guide, 1.0 to 2.5 inches of water are required for each foot of water table rise. For example, a field with a pre-irrigation water table 60 inches deep may need about 2 inches of water to raise the water table to 18 inches, while a pre-irrigation water table at 48 inches may require 5 inches of water for the same result.
Crop Establishment
Vegetables that are set as transplants, rather than direct seeded require irrigation for crop establishment in excess of crop ET. Establishment irrigations are used to either keep plant foliage wet by overhead sprinkler irrigation (to avoid desiccation of leaves) or to maintain high soil moisture levels until the root systems increase in size and plants start to actively grow and develop. Establishment irrigation practices vary among crops and irrigation systems. Strawberry plants set as bare-root transplants may require 10 to 14 days of frequent intermittent overhead irrigation for establishment prior to irrigation with the drip system. The amount of water required for crop establishment can range widely depending on crop, irrigation system, and climate demand. Adequate soil moisture is also needed for the uniform establishment of direct-seeded vegetable crops.
Crop Growth and Development
Irrigation requirements necessary to meet the ET needs of a crop depend on the type of crop and growth stage, field soil characteristics, irrigation system type and capacity. Different crops vary in growth characteristics that result in different relative water use rates. Soils differ in texture and hydraulic characteristics such as available water-holding capacity (AWHC) and capillary movement. Because sands generally have very low AWHC values (3% to 6% is common), a 1% change in AWHC affects irrigation practices.
Water Application (Irrigation Requirement)
Irrigation systems are generally rated with respect to application efficiency (Ea), which is the fraction of the water that has been applied by the irrigation system and that is available to the plant for use (Table 4). Applied water that is not available to the plant may have been lost from the crop root zone through evaporation or wind drifts of spray droplets, leaks in the pipe system, surface runoff, subsurface runoff, or deep percolation within the irrigated area. Irrigation requirements (IR) are determined by dividing the desired amount of water to provide to the plant (ETc), by the Ea as a decimal fraction (Eq.[1]). For example, if it is desired to apply 0.5 inches to the crop with a 75% efficient system, then 0.5/0.75 = 0.67 inches would need to be pumped. Hence, when seasonal water needs are assessed, the amount of water needed should be based on the irrigation requirement and all the needs for water, and not only on the crop water requirement. For more information, consult IFAS bulletin 247 "Efficiencies of Florida agricultural irrigation systems" (https://edis.ifas.ufl.edu/ae110) and Bulletin 265 "Field evaluation of microirrigation water application uniformity" (https://edis.ifas.ufl.edu/publication/ae094). Catch cans can be used in the field to measure the actual amount of water applied.
Eq. [1] Irrigation requirement =
Crop water requirement / Application efficiency
IR = ETc/Ea
Fertigation/Chemigation
Irrigation systems are often used for delivery of chemicals such as fertilizers, soil fumigants, or insecticides. The crop may require nutrients when irrigation is not required, e.g. after heavy rainfall. Fertilizer injection schedules based on soil tests results are provided in each crop production chapter of this production guide. Fertigation should not begin until the system is pressurized. It is recommended to always end a fertigation/chemigation event with a short flushing cycle with clear water to avoid the accumulation of fertilizer or chemical deposits in the irrigation system, and/or rinse crop foliage. The length of the flushing cycle should be 10 minutes longer than the travel time of the fertilizer from the irrigation point to the farthest point of the system.
System Maintenance
Irrigation systems require periodic maintenance through-out the growing season. These activities may require system operation during rainy periods to ensure that the system is ready when needed. In addition, drip irrigation systems may require periodic maintenance to prevent clogging and system failure. Typically, cleaning agents are injected weekly, but in some instances more frequent injections are needed.
Frost Protection
For some crops, irrigation is used for frost protection during winter growing seasons. For strawberry production, sprinkler irrigation is primarily used with application rates of about 0.25 inches per hour during freeze events. Water freezes at 32ºF, while most plant tissues freeze at lower temperatures. Overhead freeze protection is efficient for air temperature as low as 26ºF-28ºF, but seldom below. For vegetable fields with subirrigation systems, the relatively higher temperature of groundwater can be used for cold protection. Growers may also irrigate to raise the water table throughout the field. Frost protection water requirements vary and depend on the severity and duration of freeze events, the depth to the existing water table level, and field hydraulic characteristics. For more information, consult UF/IFAS bulletin HS931 "Microsprinkler Irrigation for Cold Protection of Florida Citrus" (https://edis.ifas.ufl.edu/publication/ch182) and bulletin SL296 "Citrus Cold Weather Protection and Irrigation Scheduling Tools Using Florida Automated Weather Network (FAWN) Data" (https://edis.ifas.ufl.edu/publication/ss509).
Other Uses
Other irrigation uses vary according to the type of crop, system characteristics, and field location. Some examples include: periodic overhead irrigation for dust control; wetting of dry row middles to settle dust and prevent sand from blowing during windy conditions; and wetting of roadways and drive aisles to provide traction of farm vehicles.
Irrigation Scheduling
A wide range of irrigation scheduling methods is used in Florida, with corresponding levels of water management (Table 5). The recommended method (level 5) for scheduling irrigation (drip or overhead) for vegetable crops is to use together: the crop water requirement method that takes into account plant stage of growth associated with measurements of soil water status, and guidelines for splitting irrigation (see below). A typical irrigation schedule contains (1) a target crop water requirement adjusted to crop stage of growth and actual weather demand, (2) adjustment of irrigation application based on soil moisture, (3) a rule for splitting irrigation, (4) a method to account for rainfall, and (5) record keeping (Table 6). For seepage irrigation, the water table should be maintained near the 18-inch depth (measured from the top of the bed) at planting and near the 24-inch depth when plants are fully grown. Water tables should be maintained at the proper level to ensure optimum moisture in the bed without leading to oversaturation of the root zone and potential losses of nutrients. Water tables can be monitored with a section of PVC pipe sunk in the soil with a calibrated float inside the PVC pipe. The calibrated float can be used to determine the exact level of the water table.
Summary of irrigation scheduling guidelines for vegetable crops grown in Florida
Soil Water Status, Soil Water Tension, and Soil Volumetric Water Content
Generally, two types of sensors may be used for measurements of soil water status, those that measure soil water potential (also called tension or suction) and those that measure volumetric water content directly. Soil water tension (SWT) represents the magnitude of the suction (negative pressure) the plant roots have to create to free soil water from the attraction of the soil, and move it into the root cells. The dryer the soil, the higher the suction needed, hence, the higher SWT. SWT is commonly expressed in centibars (cb) or kilopascals (kPa; 1cb = 1 kPa; 7 kPa = 1psi). For most vegetable crops grown on the sandy soils of Florida, SWT in the rooting zone should be maintained between 6 (slightly above field capacity) and 15 cb. Because of the low AWHC of Florida soils, most full-grown vegetable crops will need to be irrigated daily. During early growth, irrigation may be needed only two to three times weekly. SWT can be measured in the field with moisture sensors or tensiometers. For more information on SWT measuring devices, consult UF/IFAS Circular 487 "Tensiometers for Soil Moisture Measurement and Irrigation Scheduling" and Bulletin 319 "Tensiometer Service, Testing, and Calibration."
Within the category of volumetric sensors, capacitance based sensors have become common in recent years due to a decrease in cost of electronic components and increased reliability of these types of sensors. However, sensors available on the market have substantially different accuracies, response to salts, and cost. Soil moisture sensors are detailed in the publication, "Field Devices for Monitoring Soil Water Content" (https://edis.ifas.ufl.edu/publication/ae266). All methods under this definition estimate the volume of water in a sample volume of undisturbed soil [ft3/ft3 or percentage]. This quantity is useful for determining how saturated the soil is (or, what fraction of total soil volume is filled with the soil aqueous solution). When it is expressed in terms of depth (volume of water in soil down to a given depth over a unit surface area (inches of water)), it can be compared with other hydrologic variables like precipitation, evaporation, transpiration and deep drainage.
Practical Determination of Soil Field Capacity Using Volumetric Soil Moisture Sensors
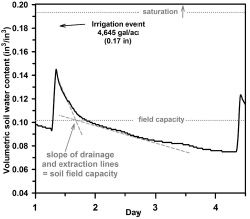
It is very important that the irrigation manager understand the concept of "field capacity" to establish an irrigation control strategy with the goals of providing optimum soil moisture for plant growth, productivity, and reduction of fertilizer nutrient leaching. Figure 2 represents volumetric soil water content (VWC) at depth of 0-6 inches measured by a capacitance sensor during a period of 4 days. For the soil field capacity point determination, it is necessary to apply an irrigation depth that results in saturation of the soil layer, in this particular case 0-6 inches. The depth of irrigation applied is 4,645 gal/ac (equivalent to 0.17 in for overhead or seepage irrigation, or 34 gal/100ft for drip irrigation with 6 ft. bed centers in plasticulture) in a single irrigation event. Right after the irrigation events, there was a noticeable increase in soil moisture content. The degree to which the VWC increases, however, is dependent upon volume of irrigation, which is normally set by the duration of irrigation event. For plastic mulched drip-irrigation in sandy soils, long irrigation events result in a relatively large increase in soil moisture in the area below the drip emitter. The spike in soil moisture appears to only be temporary, as the irrigation water rapidly drains down beyond the 6-inch zone (observed by the decrease in VWC). This rapid spike in soil water content indicates that the VWC has rapidly reached a point above the soil water holding capacity and the water has percolated down to deeper soil layers. Between the end of day 1 and day 3 (Fig. 2), the VWC declined at a constant rate due to some soil water extraction by drainage, but most extraction due to evapotranspiration took place during the day. For sandy soils, the change in the slope of drainage and extraction lines—in other words, changing from "rapid" to "slower" decrease in soil water content—can be assumed as the "field capacity point". At this time, the water has moved out from the large soil pores (macropores), and its place has been taken by air. The remaining pore spaces (micropores) are still filled with water and will supply the plants with needed moisture.
Examples of Irrigation Scheduling Using Volumetric Soil Moisture Sensor Devices
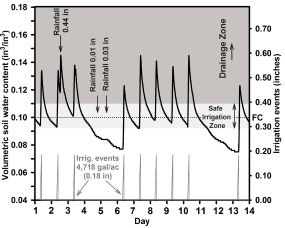
In this section, two examples of irrigation management of vegetable crops in sandy soils using soil moisture sensor readings stored in a data logger are provided: one example with excessive ("over") irrigation (Fig. 3) and one with adequate irrigation (Fig.4) using plasticulture. In Figure 3, the irrigation events consisted of the application of a single daily irrigation event of 4,718 gal/ac (equivalent to 0.18 in for overhead or seepage irrigation, or 36 gal/100ft for drip irrigation with 6-ft bed centers in plasticulture. After each irrigation event, there was an increase in the soil water content followed by rapid drainage. Large rainfall events may lead to substantial increases in soil moisture content. On day 2, right after the irrigation, a large rainfall of 0.44 in. occurred, which resulted in a second spike of soil water content in the same day. The following irrigation (day 3) started when the volumetric soil water content was above the soil field capacity. In this case, the irrigation event of the day 3 could have been safely skipped. Between day 3 and 6, no irrigation was applied to the crop. The volumetric water content decreased from 0.14 to 0.08 in3 water/in3 soil. Due to the very low water holding capacity of the sandy soils, skipping irrigation for several days could lead to unneeded crop water stress especially during very hot days or very windy days (when high evapotranspiration rates may occur), or during flowering stage. Between day 6 and 10, large daily irrigation events were repeated, exceeding the "safe irrigation zone", and leading to more water drainage and nutrient leaching.
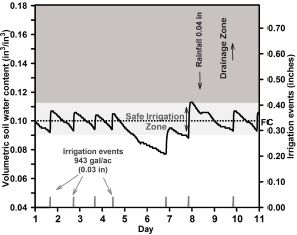
Conversely, Figure 4 shows "adequate" irrigation applications for a 10-day period. In this case, the irrigation event will start exclusively when the volumetric soil water content reaches an arbitrary threshold. For this particular situation, the soil field capacity is known; the irrigation events started when the volumetric soil moisture content reached values below the soil field capacity (or 0.09 in3/in3). However, to maintain the soil volumetric water content in the "safe irrigation zone", a previous determination of the length of the irrigation is necessary, to avoid over irrigation (additional information about irrigation depths can be obtained in the IFAS bulletin AE72 "Microirrigation in Mulched Bed Production Systems: Irrigation Depths" at (https://edis.ifas.ufl.edu/publication/ae049).
The example in Figure 4 received irrigation depth of 943 gal/ac (equivalent to 0.03 in for overhead or seepage irrigation, or 6 gal/100 ft for drip irrigation with 6-ft bed centers in plasticulture; this irrigation depth was sufficient to increase the volumetric water content to a given moisture without exceeding the "safe irrigation zone". On average, the volumetric soil water content is maintained close to the field capacity, keeping water and nutrients in the root zone. For this particular example, there was no deep water percolation. In addition, with the information of the soil water status, the irrigation manager might decide to not irrigate if the soil moisture content is at a satisfactory level. For example, in day 8, due to a rainfall event of 0.04 in, there was no need of irrigation because the soil moisture was above the field capacity and the arbitrary threshold, therefore the irrigation event of day 8 was skipped. On the other hand, this "precise" irrigation management requires very close attention by the irrigation manager. For a given reason (such as pump issue), the irrigation was ceased in day 5 and it was resumed late in day 6. As a result, soil water storage decreased to a certain level, and if the water shortage is prolonged, the plants would be water stressed.
Tips on Installation and Placing of Soil Moisture Sensor Devices in Vegetable Fields
The use of soil moisture monitoring devices (volumetric or soil water tension) has the potential to save irrigation water application in a given vegetable area by reducing the number of unnecessary irrigation events. However, the effectiveness of the use of these sensors depends on a proper installation in representative locations within vegetable fields. These sensors may be used to monitor water table levels in seepage irrigation.
Sensors should be buried in the root zone of the plants to be irrigated. Most of the vegetable crops have 80% to 90% of the root zone in the upper 12 in., which generally is the soil layer with higher water depletion by evapotranspiration. For vegetable crops cultivated in rows and irrigated by drip tapes, the sensors should be installed 2-3 in. away from the plant row. For single row crops (such as tomato, eggplant, or watermelon), the sensor should be placed on the opposite side of the drip tape; for double row crops (pepper, squash), the sensors should be placed in between the drip tape and plant rows.
Sensors need to be in good contact with the soil after burial; there should be no air gaps surrounding the sensor. Soil should be packed firmly but not excessively around the sensor. In plasticulture, after the installation, the area above the sensor should be recovered back with plastic and sealed with tape.
Crop Water Requirement (ET)
Crop water requirements depend on crop type, stage of growth, and evaporative demand. Evaporative demand is termed evapotranspiration (ET) and may be estimated using historical or current weather data. Generally, reference evapotranspiration (ETo) is determined for use as a base level. By definition, ETo represents the water use from a uniform green cover surface, actively growing, and well watered (such as turf or grass covered area).
Historical daily averages of Penman-method ETo values are available for 6 Florida regions expressed in units of acre-inches and gallons per acre (Table 7).
While these values are provided as guidelines for management purposes, actual values may vary above and below these values, requiring individual site adjustments. Actual daily values may be as much as 25% higher on days that are hotter and drier than normal or as much as 25% lower on days that are cooler or more overcast than nor-mal. Real time ETo estimates can be found at the Florida Automated Weather Network (FAWN) internet site (https://fawn.ifas.ufl.edu). For precise management, SWT or soil moisture should be monitored daily in the field.
Crop water use (ETc) is related to ETo by a crop coefficient (Kc) which is the ratio of ETc to the reference value ETo (Eq. [2]). Because different methods exist for estimating ETo, it is very important to use Kc coefficients which were derived using the same ETo estimation method as will be used to determine the crop water requirements. Also, Kc values for the appropriate stage of growth (Tables 8 and 9; Fig. 3) and production system (Tables 6 and 7) must be used.
With drip irrigation where the wetted area is limited and plastic mulch is often used, Kc values are lower to reflect changes in row spacing and mulch use. Plastic mulches substantially reduce evaporation of water from the soil surface. Associated with the reduction of evaporation is a general increase in transpiration. Even though the transpiration rates under mulch may increase by an average of 10%-30% over the season as compared to a no-mulched system, overall water use values decrease by an average of 10%-30% due to the reduction in soil evaporation. ETo may be estimated from atmometers (also called modified Bellani plates) by using an adjustment factor. During days without rainfall, ETo may be estimated from evaporation from an ET gauge (Ea) as ETo = Ea/0.89. On rainy days (>0.2 in) ETo = Ea/0.84.
Eq. [2] Crop water requirement =
Crop coefficient x Reference evapotranspiration
ETc = Kc x ETo
Historical Penman method reference evapotranspiration (ETo) for six Florida regions expressed in (A) inches per day and (B) gallons per acre per day1
Description of stages of growth (plant appearance and estimated number of weeks) for most vegetable crops grown in the spring in Florida1
Crop coefficient estimates for use with the ETo values in Table 6 and growth stages in Table 7 for unmulched crops. (Actual values will vary with time of planting, soil conditions, cultural conditions, length of growing season and other site-specific factors)
Soil Water Holding Capacity and the Need to Split Irrigations
Appropriate irrigation scheduling and matching irrigation amounts with the water holding capacity of the effective root zone may help minimize the incidence of excess leaching associated with over-irrigation. In Florida sandy soils, the amount of water that can be stored in the root zone and be available to the plants is limited. Usually, it is assumed that approximately 0.75 in. of water can be stored in every foot of the root zone. Only half of that should be used before next irrigation to avoid plant stress and yield reduction (this will help maintain SWT below 15 cb). Any additional water will be lost by deep percolation below the root zone.
Table 11 gives approximate amount of water that can be applied at each event in Florida sandy soil under different production systems. When the calculated volume of water to be applied in one day exceeds the values in Table 10, then it is necessary to split applications. The number of split irrigations can be determined by dividing the irrigation requirement (Eq. [1]) by the numbers in Table 11, and rounding up the result to the nearest whole number. Splitting irrigation reduces both risks of water loss through deep percolation and nutrient leaching. Sandy soil with the available water holding capacity of 0.75 in/ft was assumed in these calculations. If a soil contains more clay or organic matter the amount of water applied during one irrigation event and stored in the root zone can be increased. It is recommended to check the depth of wetting after irrigation to assure that the water is not lost from the roots by digging out a perpendicular profile to the drip line and observing the wetted pattern.
Crop coefficient estimates (Kc) for use with ETo values in Table 6 and growth stages in Table 7 for selected crops grown in a plasticulture system1
Maximum water application (in gallons per acre and in gallons/100 lbf) in one irrigation event for various production systems on sandy soil (available water holding capacity 0.75 in/ft and 50% soil water depletion). Split irrigations may be required during peak water requirement
Example
As an example, consider drip irrigated tomatoes on 6-ft center beds, grown under a plastic mulch production system in central west Florida (sandy soils). For plants in growth Stage 5 the crop coefficient is 0.85 (Table 10). If this period of growth occurred in May, the corresponding ETo value is 4,914 gal/ac/day (Table 7). Daily crop water use would be estimated as:
ETcrop = (0.85) x (4,914 gal/ac/day) = 4,177 gal/ac/day
If the drip irrigation system can apply water to the root zone of the crop with an application efficiency of 85%, the irrigation requirement would be
Irrigation Requirement = (4,177 gal/ac/day) / (0.80) = 5,221 gal/ac/day
If the maximum water application in one irrigation event for this type of soil is 1,700 gal/ac/irrigation, then the irrigation will have to be split:
Number of events = (5,221 gal/acre/day) / (1,700 gal/acre/day/irrigation event) = 3.1, rounded up to 4 irrigation events each of 5,221 / 4 = 1,305 gal/acre
Therefore, in this example, four irrigations of 1,305 gal/ac each will be needed to replace ETc, and not exceed the soil water holding capacity. This amount of water would be a good estimate for scheduling purposes under average growth and average May climatic conditions. However, field moisture plant status should also be monitored to determine if irrigation levels need to be increased or reduced. While deficit irrigation will reduce fruit size and plant growth, excessive irrigation may leach nutrients from the active root system. This may also reduce plant growth.