Introduction
Eye-tracking analysis is a research tool used to measure visual attention. Visual attention is of interest because 83 percent of the information used in cognitive processing is visually obtained (Wästlund et al. 2010). Regarding consumer behavior, approximately 70 percent of purchasing decisions are made in-store (Clement 2007). Consequently, the connection between visual attention and consumer behavior has numerous implications in terms of understanding consumer purchasing decisions.
Eye-tracking technology is a means of exploring the relationship between visual attention and consumer behavior. In the past, eye-tracking technology has been used to conduct research on consumer decision-making, marketing, and advertising (Orquin and Loose 2013; Pieters and Warlop 1999). This article serves as an introduction to eye-tracking technology and methodology.

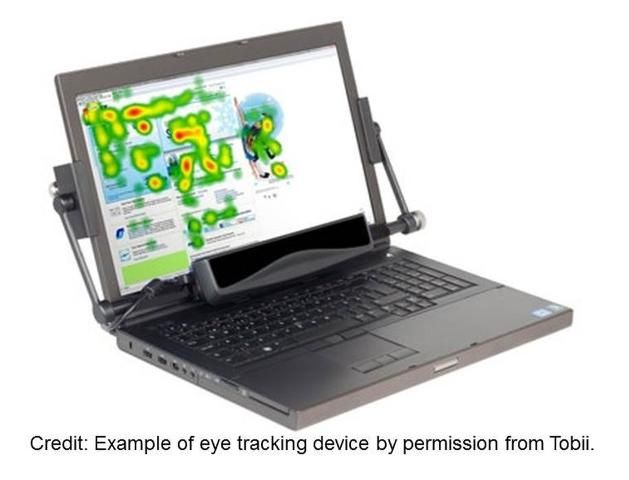
Credit: by permission of Tobii
Technology: Advantages, Disadvantages, and Applications
Advances in eye-tracking technology have resulted in increased availability of less expensive, easier-to-use equipment that can be used by marketers to better understand consumer choice behavior. There are a variety of eye-tracking camera options available (i.e., glasses, light eye-trackers, and computer monitor eye-trackers) with different advantages and disadvantages related to weight, portability and durability. Eye tracking glasses, for example, are more suitable for data collection in open environments (e.g., grocery stores, garden centers, etc.), where participants can shop while wearing eye-tracking glasses. Conversely, light eye-trackers are more appropriate for controlled environments, such as in a research laboratory or in a retail setting, where the experimental materials (e.g., images of products, labels, or animations) are shown on a computer screen. There are several advantages and disadvantages that are universal among eye-tracking devices (Table 1).
Advantages
One advantage of eye-tracking technology is it records actual eye movements (Table 1). In consumer behavior research, reactivity (when participants change their behavior due to being observed) is a major concern. Eye-tracking technology reduces this concern because real eye movements are documented and consumers often forget their eye movements are being recorded (Maughan et al. 2007). Eye-tracking recordings accurately depict natural eye movement and fixations.
An additional advantage of using eye-tracking technology in research is the quality and quantity of the data (Table 1). Eye-tracking cameras record actual, real-time eye movements. Eye movements are typically recorded at 30 Hz (meaning 30 gaze points are collected per second; Tobii 2014). As a result, eye-tracking technology collects large amounts of accurate and precise data.
Eye-tracking technology also provides flexibility in terms of research locations (Table 1). Depending on the study objectives, intercept studies (where data is collected from real customers in retail centers) can be conducted in retail outlets or participants can be invited into a laboratory for the experiment.
Disadvantages
One of the main disadvantages of eye-tracking technology is not all eyes can be tracked (Table 1). Contact lenses, glasses, and pupil color can all impact the eye-tracking camera's ability to record eye movements (Tobii 2014). Consequently, not everyone (typically 10–20% of the sample) can participate in an eye-tracking study (Jacob and Karn 2003). As a result, the representativeness of the sample will be impacted.
Eye-tracking studies also require considerable financial, time and labor resources (Table 1). Eye-tracking equipment (i.e., camera, computer, software) and training can be expensive. Additionally, only one person can be recorded at a time. Individual participation instead of group participation takes considerably more time and labor. The use of multiple eye tracking devices could help reduce the total experiment time, but could be more labor intensive.
A third challenge is that eye-tracking technology only records eye movements (Table 1). Therefore, eye-tracking technology needs to be paired with an additional data collection method to accurately interpret the recordings. For example, Likert scales assessing consumers' willingness-to-purchase can be used to determine what information consumers' visually inspect and use while deciding whether they are willing to purchase a product. However, interpreting these results can be challenging because visual attention is not the only factor impacting consumer behavior (Orquin and Loose 2013).
Applications and Use
Eye-tracking technology gives researchers the opportunity to collect and analyze consumer visual information acquisition patterns and search for correlations between visual attention and consumer behavior. As a result, eye-tracking technology has many uses in consumer behavior research and can aid in answering research questions related to product, package, and promotional designs (Wästlund et al. 2010). Eye-tracking technology can also measure the impact of different visual stimuli on consumers' decision-making strategies (Orquin and Loose 2013). As a result, researchers can investigate the best advertisement, packaging, and/or in-store display designs to attract consumers' attention. Researchers are able to focus on specific format options (such as font style/size, color, images, number of products, and so on) or on advertisement content (including branding, value-added information, and promotional messages). Some of the specific research that can be addressed using eye-tracking technology includes what visual search patterns can be used to acquire product information; what information impacts consumers' decisions; whether visual attention varies based on level of importance, familiarity, or external pressures (time, goals, etc.); and which product or label/packaging design is the most visually appealing,
Methodology: Experimental Design, Sampling, and Data Analysis
Eye-tracking research methodology includes experimental design, sampling, and data analysis. The following section covers the core aspects of these elements.
Experimental Design
To record meaningful eye movements, products, displays and/or images are created to align with research objectives. Actual products or displays in a laboratory or retail setting can be used with eye-tracking glasses. Alternatively, representative images can be constructed and displayed on a computer monitor. However, often when computer monitor images are used, a screen with a central fixation point needs to be shown between images to ensure participants have the same initial focal point for each image.
Because eye-tracking cameras only record eye movements, additional measurements must be employed to understand the eye-tracking results. Often Likert scales are used to measure liking-rating, ad recognition/recall, willingness to purchase, and brand attractiveness (Orquin and Loose 2013; Pieters and Warlop 1999). Participant responses can be measured using verbal (Reisen et al. 2008) or click-on methods where participants select their responses from a predetermined set of answers (Pieters and Warlop 1999). Verbal responses are advantageous because participants only need to focus on the visual stimuli while they make their choices. However, verbal responses require additional labor during the data collection process. Click-on methods reduce labor requirements and potential data entry errors.
External pressures on eye movements and consumer behavior can be measured by manipulating participant instructions and/or providing additional motivations (Pieters and Warlop 1999). For instance, time pressure impacts participant visual search behavior and can be manipulated by having trials with different view times (Pieters and Warlop 1999). Participants can be motivated to truthfully reveal their preferences by giving them one of the selected products at the end of the experiment (Armel et al. 2008). Both studies emphasize the importance of defining an experimental task and being aware of motivations to address them accordingly.
Sampling
At the present time, not all eyes can be recorded. Prescreening participants for normal or corrected-to-normal vision and full-color vision increases the likelihood that the recruited participants will be able to have their eye movements recorded.
Individual participation is required because the eye-tracking camera needs to be calibrated to each individual's eyes. During camera calibration, participants fixate on a focal point as it moves around the viewing area. Once calibration is complete, at least one non-target product is used as an example. A non-target product is any product that is unrelated to the products of interest in the experiment. Non-target products are used to decrease participant error and to familiarize participants with the technology. After calibration, data can be collected and analyzed.
Data Analysis
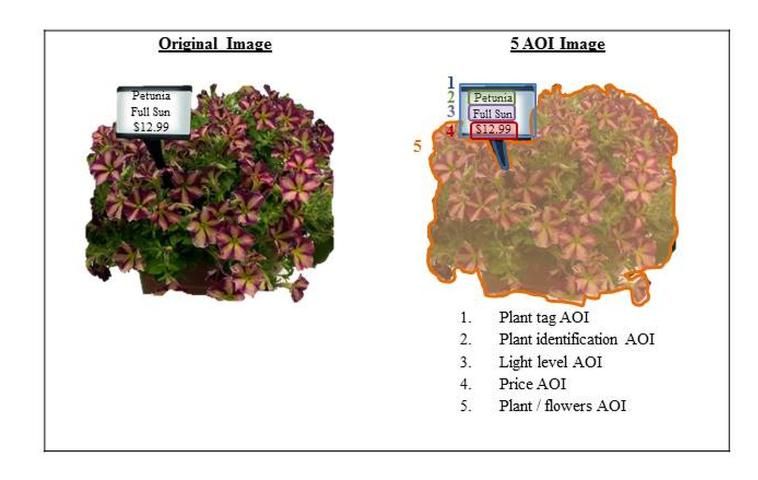
After the participant's eye movements have been recorded, geometric areas of interest (AOI) are defined using the eye-tracking software (Figure 1). Each AOI is a polygon encompassing an attribute of interest within the image. For instance, in Figure 1, there are five AOIs: the plant tag, the plant type, the light level, the price, and the plant itself. The attributes of interest are research-dependent and include any visual stimuli being investigated.

Credit: Source: Alicia L. Rihn
Once the AOIs are defined, data can then be exported to statistical software for each AOI. Recorded eye movements include fixations (when the eye stops and focuses) and saccades (when the eye moves between fixation points). Fixation counts and duration are often used to investigate consumer behavior because information acquisition occurs during fixations. Eye-tracking cameras record the following metrics: fixation count (number of fixations), fixation duration (length of fixations in milliseconds), total fixation duration (fixation count times fixation duration), percent fixated (percent of sample who fixated in the AOI), time to first fixation (in milliseconds), and scan path (chronological fixations and saccades) for each AOI.
Duration and/or fixation parameters are used to clean the data. For instance, trials can be removed if the fixation duration is greater than two standard deviations from the sample mean to remove distracted participants from the sample (Armel et al. 2008). Fixations lasting less than 50 milliseconds can also be removed since fixations typically last more than 50 milliseconds (Reisen et al. 2008).
As with other types of research, statistical model selection depends on the variables and research objectives. Past studies have used analysis of variance (Reisen et al. 2008), t-tests (Armel et al. 2008), and conditional logit analysis (Pieters and Warlop 1999) to analyze eye-tracking data.
Eye-tracking Visuals
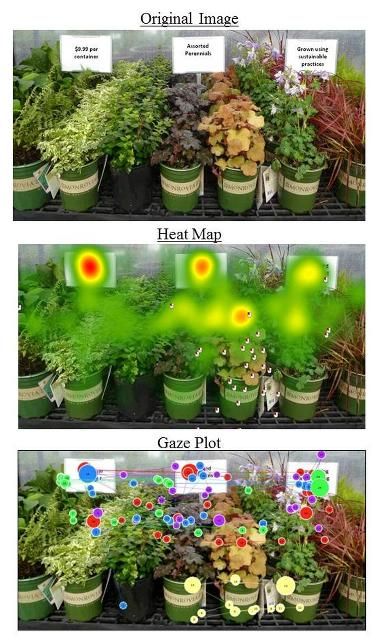
Eye-tracking software can generate graphic representations of participant eye movements, including heat maps and gaze plots (Figure 2). Heat maps represent fixation concentration. Red coloration indicates areas of high fixation concentration, followed by yellow, and then green. Gaze plots show the fixations, saccades, and scan path. In gaze plots, each participant is represented by a different color. Each fixation is denoted by a chronologically numbered circle. The circle diameter corresponds to the length of the fixation in milliseconds (i.e., a larger circle signifies a longer fixation duration).

Credit: Source: Hayk Khachatryan
Conclusions
Eye-tracking technology and methodology can be used by marketing specialists or retailers to better understand consumer visual attention. This article examines the basics of applicable research topics, experimental design, sampling, and data analysis, along with the advantages and disadvantages of eye-tracking technology. Eye-tracking technologies can be used as a research tool to investigate numerous topics related to consumer behavior, information acquisition, and decision making. Similarly, eye-tracking research results are beneficial for business professionals interested in knowing what consumers are looking at and how they respond to what they see.
References
Armel, K.C., A. Beaumel, and A. Rangel. 2008. Biasing simple choices by manipulating relative visual attention. Judgment and Decision Making 3(5):396–403.
Clement, J. 2007. Visual influence on in-store buying decisions: An eye-tracking experiment on the visual influence of packaging design. Journal of Marketing Management 23(9):917–928.
Jacob, R.J. and K.S. Karn. 2003. Eye tracking in human-computer interaction and usability research: Ready to deliver the promises. Mind 2(3), 4:573–604.
Maughan, L., S. Gutnikov, and R. Stevens. 2007. Look more, like more: The evidence from eye tracking. Journal of Brand Management 14(4):335–342.
Orquin, J.L. and S.M. Loose. 2013. Attention and choice: A review on eye movements in decision making. Acta Psychologica 144:190–206.
Pieters, R. and L. Warlop. 1999. Visual attention during brand choice: The impact of time pressure and task motivation. International Journal of Research in Marketing 16:1–16.
Reisen, N., U. Hoffrage, and F.W. Mast. 2008. Identifying decision strategies in a consumer choice situation. Judgment and Decision Making 3(8):641–658.
Tobii. 2014. Tobii Website. http://www.tobii.com.
Wästlund, E., P. Shams, M. Löfgren, L. Witell, and A. Gustafsson. 2010. Consumer perception at point of purchase: Evaluating proposed package designs in an eye-tracking lab. Journal of Business and Retail Management Research 5(1):41–50.