Introduction
The Florida state legislature allocates funds for highway landscaping projects each year. While highway beautification may enhance the driving experience of motorists and result in more environmentally sustainable road infrastructure, it is also presumed to provide monetary benefits by attracting private investment and contributing to the economy. This study was commissioned by the Florida Department of Transportation (FDOT) to estimate the regional economic impacts of highway beautification expenditures within the state. Activities related to highway beautification generate economic impacts in the form of increased industry output (revenues), employment, income, and local and state government tax revenues. Spending for highway beautification stimulates additional economic activity through economic multiplier effects. These impacts typically occur over the 18- to 24-month development period of highway landscaping projects.
Methodology
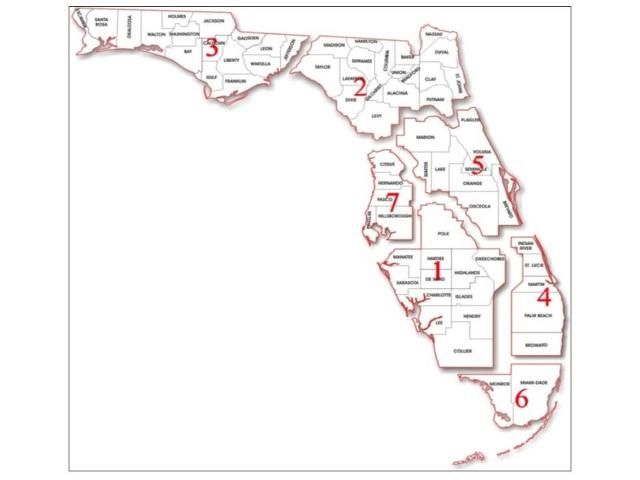
This analysis was based on the data provided by the Florida Department of Transportation (FDOT) on highway landscaping (beautification) expenditure for each of the eight FDOT districts over the period July 2008 through May 2013, as shown in Table 1. A map of the districts is shown in Figure 1. Total highway beautification expenditures for all districts over this period were more than $209 million in nominal dollar terms. District 4 had the highest total expenditures over this period of $52.5 million, followed by District 6 ($36.2 million), the Florida Turnpike (FTE) District ($28.6 million), and District 7 ($24.7 million). For the study period, expenditures peaked in 2009 and 2013 at $43.9 million and $43.4 million, respectively. Expenditures were deflated to express as constant 2011 dollars using the GDP Implicit Price Deflator (United States Department of Commerce, Bureau of Economic Analysis).

The total economic impacts of highway beautification expenditures by FDOT were estimated using regional economic models for the state of Florida constructed with the Impact Analysis for Planning (IMPLAN) software (v.3) and associated 2011 regional data licensed from the IMPLAN Group LLC, Inc. IMPLAN is an input-output analysis/social accounting matrix (I-O/SAM) modeling system. The I-O/SAM technique is standard for estimating the broad economic impacts resulting from changes in specific economic activities in a regional economy (Miernyk 1965; Miller and Blair 2009). IMPLAN models provide estimates of impacts on the regional economy from changes in final demand or purchases for final use, changes in earnings, or changes in employment. Final demand is the value of goods and services produced and sold to final users (households or institutions). Changes in final demand result in changes in industry purchases of goods and services from their input industries in the local economy, and changes in employee spending.
The secondary economic effects of given direct changes in spending (output) for highway beautification are estimated by economic multipliers that represent the activity generated from intermediate purchases through the industry supply chain (indirect effects) and activity generated from employee household spending (induced effects). For example, indirect effects occur as landscaping contractors purchase materials and equipment from other businesses in the state, while induced effects occur when households of proprietors and employees of affected businesses purchase goods and services within the state for personal consumption. The combined direct, indirect, and induced impacts of an activity represent its total economic impacts. IMPLAN is a static equilibrium model, meaning that the estimated changes in output, earnings or employment have no time dimensions; however, it is usually assumed that the forecasted changes represent annual changes because the model is based on annual data. Spending that occurs outside the region under study represents a "leakage" of money that has no economic impact on region.
Parameters in the IMPLAN software and databases are derived from state and federal government statistics and national accounting data for transactions between industries, governments, social institutions, employees, and households for a specific base year. Regional data are available for all US states and counties for 440 industry sectors classified by the North American Industry Classification System (NAICS) and an additional 25 institutional sectors. Information is provided on industry output (revenues), employment, labor and property income, personal and business taxes, household and institutional commodity demand, interregional commodity trade (imports, exports), transfer payments (e.g., welfare and retirement pensions), personal savings, and capital investments.
In this study, eight regional IMPLAN models were constructed based on Florida's transportation districts. Each district model includes IMPLAN data for counties in each district and Florida's Turnpike Enterprise (FTE). The model for the FTE district included all counties containing part of the Florida Turnpike system. The IMPLAN models were constructed with 2011 IMPLAN data for Florida counties and with trade flows estimated using econometric regional purchase coefficients (RPCs). Each category of expenditures for highway beautification from 2008 through the first quarter of 2013 was assigned to the appropriate IMPLAN industry sector, defined according to the North American Industry Classification System (NAICS).
Selected IMPLAN output multipliers used for estimating economic impacts of the FDOT highway beautification programs by district and industry sectors are shown in Table 2. Each multiplier represents the sum of direct, indirect, and induced effects. Multipliers for output, value-added, labor income, other property income, and indirect business taxes are denominated in dollars per dollar output, while multipliers for employment are denominated in full-time and part-time jobs per million dollars output. Total output multipliers typically range from 2 to 3, meaning that for each one-dollar change in spending or final demand, a total of $2 to $3 in industry sales are generated in the regional economy. Employment multipliers range as high as 40 (jobs per million dollars of new spending). The employment, value-added, labor income, other property income, and indirect business tax multipliers are not reported in this document but are available upon request from the authors.
The FDOT expenditure profiles were used to allocate cost data to the relevant IMPLAN sectors for the economic impact analysis.
Results
Table 3 shows the total expenditures for highway beautification from 2008 to 2013, by district and IMPLAN industry sector. Overall, District 4 had the highest expenditures of $42.7 million, followed by District 6 at $28.7 million, and the FTE at $28.6 million, from 2008 to 2013. Nearly 68 percent of the highway beautification expenditures in all districts were determined to belong to IMPLAN sector 6 (greenhouse, nursery, and floriculture production). Sector 201 (fabricated pipe and pipe fitting manufacturing) (IMPLAN), which supplies irrigation materials for landscape construction, was the next largest expenditure category with 15 percent of the total.
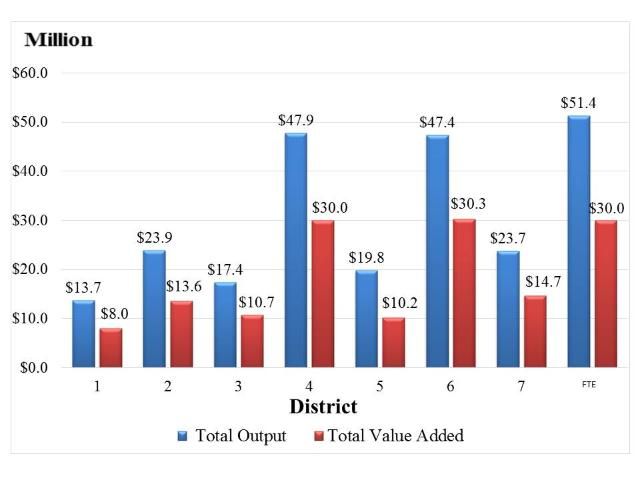
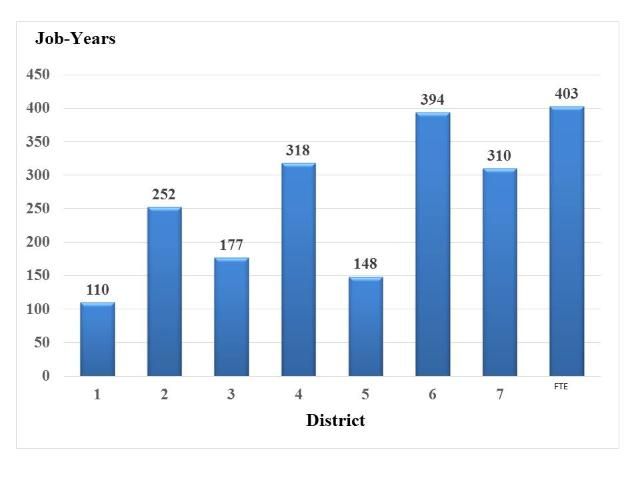
Total economic impacts for highway beautification in Florida from 2008 to mid-2013 are summarized in Table 4, and Figures 2 and 3. Highway beautification activities generated 2,112 full-time and part-time job-years, $245.2 million in output or revenue impacts, $147.6 million in value-added contribution to GDP, $110.0 million in labor income impacts, $32.6 million in other property income impacts, and $5.0 million in indirect business taxes impacts.


Among the FDOT districts, beautification expenditures in the FTE district generated the highest economic impacts of $51.4 million in output impacts, 403 full-time and part-time jobs, $30 million in value added, followed by Districts 4 and 6 in southeast Florida. Districts 4 and 6, and the FTE combined, accounted for 60 percent of the total output impacts, 62 percent of the total value-added impacts, and 53 percent of employment impacts of highway beautification expenditures.
The economic impacts were also expressed on a per-dollar initial investment basis. The impact per dollar of investment was $1.53 in output, $0.92 in value added, $0.62 in labor income, and $0.03 in state and local taxes, while the employment impact was 13.2 jobs per million dollars of investment.
The average annual economic impacts of highway beautification expenditures in Florida during 2008–2013 amounted to $46 million in output impacts and $28 million in value-added impacts.
It is concluded that funding for highway beautification in Florida generates significant economic impacts in the state, and provides a positive return on public investment.
References
FDOT. 2014. Florida Department of Transportation, Landscape Report, Fiscal Year 2008 to May 2013. Florida Department of Transportation, Tallahassee, FL.
IMPLAN Group, Inc. 2012. IMPLAN social accounting and impact analysis software (version 3), and 2011 regional data file for Florida. IMPLAN, Huntersville, NC. Web resources available at www.implan.com.
Miernyk, W.H. 1965. The elements of input-output analysis. Available on the web book of regional science: https://researchrepository.wvu.edu/rri-web-book/6/.
Miller, R.E. and P.D. Blair. 2009. Input-Output Analysis: Foundations and Extensions, Second Edition. Cambridge: Cambridge University Press.