Introduction
Nurseries are a vital part of Florida's citrus industry, providing growers with trees for replanting and expanding citrus groves. As part of the response to citrus greening and canker disease in the industry, nursery-aimed regulations were set in place to try to guarantee the production of trees "free of virus or other graft transmittable diseases" in plant nurseries (Rulemaking Authority 570.07(23), 581.031(1), (3), (8) FS. Law Implemented 570.07(2), (13), 581.031(1), (14), (17), (23), 581.1843(3), (4) FS. History–New 12-26-06, Amended 2-25-15). The Citrus Nursery Stock Certification Program, launched in 2007, has thus changed the production conditions of the sector. This program stipulates, among other requirements, that nurseries must grow new citrus trees in structures approved by the Florida Department of Agriculture and Consumer Services (FDACS) and use only certified budwood (for the complete regulations visit the following website: https://www.flrules.org/gateway/RuleNo.asp?title=CITRUS%20NURSERY%20STOCK%20CERTIFICATION%20%20PROGRAM&ID=5B-62.001). Only a few nurseries used greenhouses before the program was implemented, so the new regulations resulted in an important shift for producers from traditional open field groves to greenhouses (Rouse et al. 2007).

Credit: UF/IFAS Mid-Florida Research and Education Center
Growing citrus plants in greenhouses presents opportunities and challenges for producers. From an economic perspective, the additional capital investment, budget, and financial planning for greenhouse production systems are different from open-field production systems. At the same time, greenhouses offer production options that could result in quicker growing time, greater productivity, and higher profits (Gruber et al. 2013). Given the relatively new production challenges, the UF/IFAS Mid-Florida Research and Education Center (UF/IFAS MREC) in Apopka performed an experiment to test the profitability of different inputs in citrus-producing greenhouse nurseries.
Experimental Setting and Analysis
The experiment was conducted in the greenhouse research facilities at UF/IFAS MREC, which was built and equipped with support of the Florida Nursery, Growers, and Landscape Association (FNGLA) and a grant from the USDA Specialty Crop Block Grant Program, administered through FDACS. Thirty experimental unit benches, each measuring 4 by 7.5 feet, were prepared inside the greenhouse to test different treatments related to irrigation technology, plant spacing, and cultural practices. Three benches were included in each treatment.
- Irrigation technology: Refers to the equipment used to deliver irrigation water to the citrus trees in the experimental greenhouse. The main factors that vary across irrigation technologies are the volume of water used to reach the roots (e.g., overhead irrigation uses more water than drip irrigation because of the tree leaves); the costs of the equipment; the possibilities of using a more constant flow; and the infrastructure requirements of each irrigation system (i.e., drip irrigation requires tubes to be connected to individual tree pots). The four irrigation technologies considered were overhead (most commonly used in the industry), flood, aquamat, and drip.
- Spacing: Refers to the distance between trees growing on the benches. Relatively abundant spacing between trees allows more sunlight and airflow for each individual tree, which contributes to growth. However, the tradeoff is that it produces fewer trees per bench. Six spacing levels were considered: full bench (no spacing between trees), modified full bench (to accommodate dripper supply lines for drip irrigation), checkers (50% of bench occupied with a distribution similar to a checkerboard), Apopka spacing (75% bench occupation), 2–1 spacing (leaving an empty row every 2 rows), and experimental spacing (based on light penetration).
- Cultural practices: Refers to labor used to rotate the trees' positions between the center and bench borders. The rationale behind this practice is that the trees located on the exterior of the bench receive more light; therefore, the rotation improves the distribution of light between trees. To investigate the difference, some treatments included this rotation while others did not.
Different combinations of the aforementioned factors were used to construct the 10 experimental treatments, which are summarized in Table 1.
All tree seedlings were grown from seed in 48-cell conical cell trays for 4 months, using Kuharske Carrizo variety as the rootstock. Later, they were transplanted to larger pots (4 by 13.5 inches) and distributed among the benches, with a maximum of 228 trees per bench, depending on the treatment, and budded with Valencia orange varieties. Factors that remained constant across treatments and are in line with the industry's existing practices include pot size and type, medium/substrate, and fertilizer. Pot size was 4x4x13.5 inches tall, which is considered the most common in the citrus nursery industry (Stueve & Sons model CP413CH). The substrate was 60% Canadian peat moss with 40% perlite from SunGro (2P mix), while the fertilizer was Everest 16-4-8 at an application rate of 18 grams per pot. Once budded, the different treatments were applied to the trees. Data were then gathered during the remainder of the experiment. Data collection included water usage, labor requirements, investment needs, and tree growth progress. Trees were considered fully grown when they reached a height of 30 inches and a trunk caliber of 3/8 of an inch. A bench was considered "market ready" when 80% of the trees achieved these dimensions.
An enterprise budget model was used to compare the potential profits that could be obtained by the industry representatives if they replicated the experimental treatments considered in the project. The model used a combination of primary information from the experimental setting and secondary information from industry standards data (used as previously mentioned) to construct budgets that reflect the experimental results and represent unique variables related to growers' situations.
In the analysis, the business model assumed growers bought citrus seedlings that were then budded and grown until they reached commercial/marketable size. This model was used because the experimental treatments were applied to grown seedlings and, therefore, the results are mainly relevant for this stage of the production cycle.
Differences in Treatments
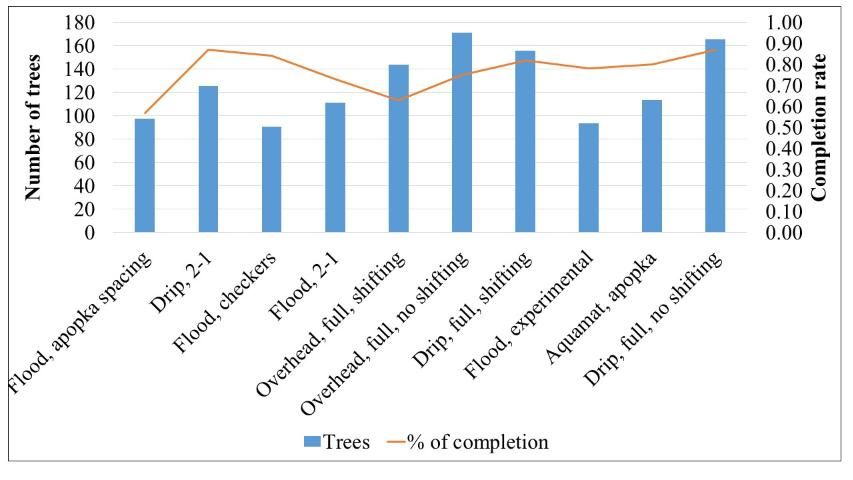
The results show important differences in the cost structure and productivity of the 10 experimental treatments. The variable that had the biggest impact on profit was the treatment yields. Here, yield represents the number of trees that reach commercial/saleable size in the 10 months between budding and final measurements.
Figure 2 shows that the most productive treatment had 170 saleable trees per bench, while the least productive treatment had less than 100 saleable trees per bench. The variability in number of marketable trees (which are sold and become the income of the company) is the main factor influencing profit. It is important to note that several treatments did not reach the minimal requirement of the percentage of trees necessary to be considered complete (80% of the trees/bench). The treatments that did not reach the 80% rate of trees with commercial size were flood Apopka, flood 2–1, overhead shifting, overhead fixed, and flood experimental; however, the last two cases were very close to the desired percentage, with rates of 75% and 78%, respectively. Although these treatments are considered in the analysis, their results do not reflect a typical, profitable production cycle.

Credit: UF/IFAS
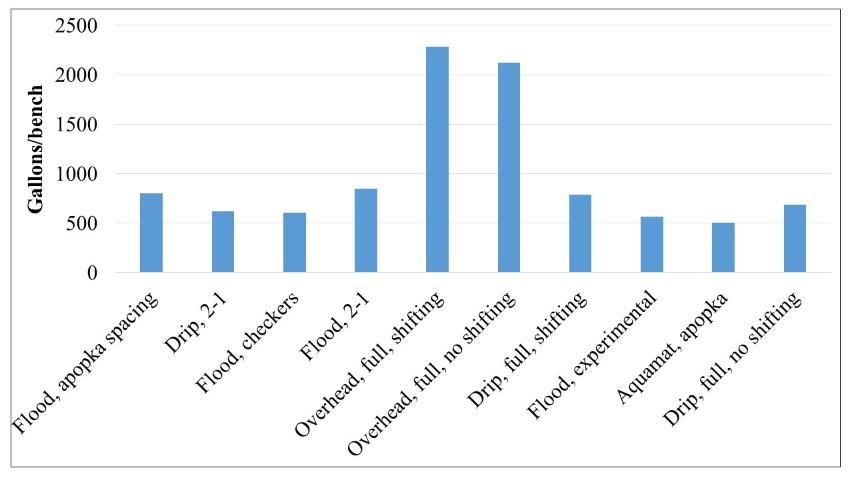
Another variable that presented very clear differences between the treatments was water use (Figure 3). This difference was in line with other studies such as Haydu et al. (2003) and with industry practices. Although the contrast between the irrigation treatments that use the most water and those that use the least is very important (e.g., 2283 gallons per bench for the most intensive and 503 gallons per bench for the least intensive), in reality, the impact of this usage on production cost was minimal. The reason water use had a relatively low impact on overall production costs is that the cost of water is equal to the cost of electricity to pump the water if the grower is using an onsite well. Thus, the cost of water is currently very small (the cost of 1 Kwh is around 10 cents in Florida for industrial purposes, and a thousand gallons may be pumped with this amount of energy). However, it is important to keep the cost of water use in consideration because of the likelihood that water-use costs will increase in the future as water availability changes and electrical costs rise.

Credit: UF/IFAS
Profitability Comparison of Treatments
The profit that could be obtained by an individual or a company operating a greenhouse with the characteristics in the experiment was calculated with a financial analysis. The analysis used the current market price of citrus trees ($9.00 per tree) and a cost structure representative of the industry. Two investment scenarios were calculated for each treatment: (1) a full-investment scenario that assumes that a grower will build a new greenhouse that has a structure comparable to the greenhouse used in the experiment and finance it with a bank loan and (2) a no-investment scenario, in which the assumption is that the grower already owns a greenhouse ready for production and therefore requires no additional financing. Results for each treatment are presented in Table 2.
The amount of money (i.e., net profit) resulting from the different treatments varies greatly. Although all treatments have aspects in common (e.g., greenhouse cost and fully utilized), they have important differences. The most important difference was the number of trees per bench that reached commercial size and were consequently sold. The variability of yield, which has values atypically low, can lead to negative cash flows as seen in several treatments. Clear differences also occur between the two considered scenarios. The no-investment case has lower costs due to the lack of debt payment, and therefore the profit is consistently larger when compared to the full-investment scenario. Regarding the treatments' impact on profitability, the two most profitable treatments share three characteristics: drip irrigation, benches full of trees (no unnecessary spacing), and high yields. The profit margin values were closely related to the actual profit in terms of distribution and variability. Finally, some of the assumptions of the model imply a reduced-cost structure that might not be standard in the industry. The assumptions that reduced the cost the most were the absence of management and marketing costs where the owner of the greenhouse assumed these responsibilities irrespective of the study treatment.
Discussion
The production of citrus trees in greenhouses transforms the production possibilities available to growers that used to adhere to open-field systems. The most important strategy to maximize producer profits is through producing high yields. Furthermore, minimizing some of the production costs also improves the economic feasibility of certain treatments. The greenhouse experimental setting shows that different production methods such as irrigation techniques, tree spacing, and cultural practices (e.g., tree shifting) have direct effects over the cost of production and tree yield, consequently affecting producer profit.
The most profitable experimental treatments used drip irrigation and full occupation of benches. This result is mainly explained by the high number of trees planted (190) and the percentage that achieved commercial size (85% on average), resulting in large sales volume/revenue. Additionally, drip irrigation uses less water compared to overhead irrigation (around 700 gallons/bench in comparison to over 2000 gallons/bench), which reduces costs.
The least profitable treatments were those that had very low yields, with 57% being the worst and none reaching 80%. Some of these treatments also had spacing that required fewer trees to be planted, which (in combination with the lower yields) resulted in low income. These treatments had different irrigation, spacing, and cultural practices, so no clear recommendations emerged regarding their use. It is important to point out that although these production methods/treatments had poor results in this experiment, this could be due to the limited sample size (only three benches per treatment) or other unidentified factors. Therefore, additional research should replicate and validate these results.
Although labor was found to be an important factor for production costs, the cultural practices tested in the experiment (i.e., shifting the trees' positions in the bench) did not significantly affect total cost. The treatments that included this cultural practice had mixed results in terms of labor intensity. That is, shifting resulted in both higher and lower labor costs. The same can be said about the effect of this practice upon yield, where both positive and negative effects were found.
The analysis highlights several important points that are useful for the whole citrus-tree-producing sector:
- Greenhouse construction/remodeling is a long-term capital investment decision that has very important implications for future profit. A tradeoff exists between the cost and quality of buildings and (likely) productivity. Also, growers with existing structures have a competitive advantage, but newcomers can still be profitable, as shown in the analysis.
- Yield has always been a key factor of agribusiness success. The production conditions of greenhouses, with less space and intensive growing, will exacerbate the importance of this variable. Given that growers are making larger investments and have less space to grow, the number of trees and the speed with which they achieve commercial size will be determinants in maximizing sales. Determining the best practices to produce high yields will result in higher profits for nurseries.
- When yields are similar among different production alternatives, then reducing costs will be the decisive factor that can lead to higher profits. Labor is a large component of variable costs, and keeping it low is important in greenhouse operations. The effect of some labor practices on yield, such as shifting trees, is unclear and should be further studied.
References
Gruber, B., B. Boman, K. Hancock, P. Kumar, and J. Britt. 2013. "Fertilizer and irrigation effects on the growth of potted citrus nursery trees." Citrus Industry Online. Retrieved from https://crec.ifas.ufl.edu/media/crecifasufledu/extension/extension-publications/2013/2013_September_Potted.pdf
Haydu, J. J., R. C. Beeson, and J. Caron. 2003. "Economics of five irrigation technologies for container-grown Viburnum odoratissimum." IV International Symposium on Irrigation of Horticultural Crops, 664, 309–315.
Rouse, B., M. Kesinger, and N. Jameson. 2007. "Citrus nursery issues: Protective structures, budwood and tree availability." Citrus Industry Online. Retrieved from https://crec.ifas.ufl.edu/media/crecifasufledu/extension/extension-publications/2007/Oct-2007-citrus-nursery-issues.pdf