Introduction
Wrapping up the Savvy Survey Series, this fact sheet is the last of three publications that outline procedures to follow after implementing a survey. With the surveys in, data collected, and analyses conducted, the next logical step deals with communicating the results. Through communication, ideas and thoughts are shared with others in a manner that will be easily understood. In Extension, some common communication channels include the annual Report of Accomplishment (ROA), grant project reports, abstracts, and oral presentations.
Audiences
A wide range of people may be interested in seeing the results of the work being done by any given Extension program. These various audiences include stakeholders such as cooperating partners, Extension directors and administrators, other Extension professionals, and even the general public. Each of these audiences has different backgrounds and information needs that impact how the information may be presented. Yet, regardless of the audience, some components of a report (e.g., the purpose of the survey, how the data were collected, salient findings, key limitations, and implications of the survey) are necessary to be effective and should be discussed in most forms of communication channels.
Internal Audiences
Individuals are categorized as part of the "internal audience" if they work closely with the program detailed in the report, fund or supervise the program, or are Extension agents themselves. This audience usually receives a written technical report that has been designed to capture all the pertinent components of the program that help illuminate the findings from the survey. The reports for internal audiences often include the following topics:
-
Background information on the program
-
A description of the survey content
-
Purpose of the survey
-
The stakeholder sponsoring or requesting the survey
-
Purpose (needs assessment or evaluation)
-
Type of survey (developed, found in research, or purchased)
-
Data collection procedures
-
Outline the data collection schedule
-
Specification of the survey methodology
-
Description of sampling strategies
-
Reliability and validity of survey
-
Report of survey results/findings
-
Delineation of the data analysis plan
-
Results of the descriptive analyses
-
Results of inferential analyses
-
Conclusions and recommendations
-
A brief description of key findings
-
Discussion of the findings
-
Suggestions for improving the program
While text makes up the core of the report, graphics can be included to provide clarity. With internal audiences, the graphics can be relatively complex because readers either are aware of the research methodology within the report or have ample time or incentive to examine the details. A general rule of thumb when reporting to various audiences is to communicate the results to the appropriate internal audiences prior to any external audience. However, internal reporting can be conducted in stages (e.g., partial findings first) if external reporting is pressing.
External Audiences
The "external audience" includes individuals in the general public who may not have the expertise or experience working with programs, working with surveys, or even interpreting findings. Again, it is advantageous to communicate with the various external audiences as soon as you can, but only after having communicated the results to the appropriate internal audiences. Such an effort will keep the regional or District Extension Director (DED) or other administrators from finding out about the successes and/or failures of a program on the 6 o'clock news rather than from the program implementation team. The report for external audiences often includes the following topics:
-
Background information on the program
-
A description of the survey content
-
Purpose of the survey
-
The stakeholder sponsoring or requesting the survey
-
Purpose: needs assessment for program development or evaluation of a program
-
Type of survey (developed, found in research, or purchased)
-
Data collection procedures
-
Specification of the survey methodology
-
Description of sampling strategies
-
Report of survey results/findings
-
Results of the descriptive analyses
-
Results of inferential analyses
-
Visual graphics of the results (e.g., bar charts or tables)
-
Conclusions and recommendations
-
A brief discussion of key findings
-
Suggestions for improving the program

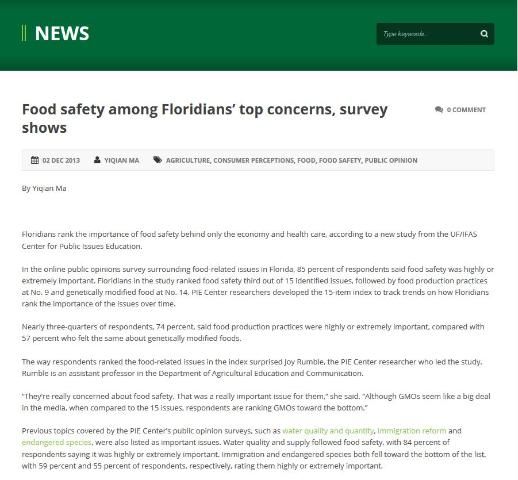
With the external audience, written reports are not as detailed, as demonstrated in Figure 1. Rather, the reports are shorter and specify the most important findings. External audiences often appreciate the use of visual models (i.e., the bar graphs, pie charts, histograms, and tables explained in Savvy Survey #16: Data Analysis and Survey Results) to assist with a proper understanding of the findings. The report may even be a fact sheet, short article, or press release that covers the main points of a program's progress or key results of a survey. Such a report can also serve as an opportunity to display the program's logic while demonstrating how the findings document short-term, medium-term, and long-term outcomes.
With external audiences, it is also possible to report findings through an oral report or presentation. An oral presentation guides listeners through only the most relevant and interesting findings (often within a short period of time). It is best to concentrate only on the most useful information rather than on insignificant findings. A wise presenter pulls out critical portions of information, often stating that additional details are available in the associated written report (Salant and Dillman, 1994). Furthermore, the presenter can tailor the presentation to different audiences such as state legislators, local residents, local officials, and other audiences. It is the responsibility of the presenter to determine the purpose of the survey and use it to select the appropriate findings to report. When presenting to any audience, it is important for the presenter to discuss all limitations of the survey and the results to enhance the trustworthiness of the study and the findings.
Dissemination Channels
Survey results can be presented in multiple ways. One method is through the written word. Written communication channels tend to be more formal in nature and may include:
-
Reports, memos, proposals, business letters
-
Advertisements
-
Editorials
-
Letters to the editor
-
Articles—newspaper, magazine, journal
However, there are some exceptions to the formality often associated with written communication channels. Less formal channels, which mainly occur online, include:
-
Emails
-
IM/Text messages
-
Social media posts
Written communication channels are able to meet the information needs of several audiences, such as a county commissioner, summer intern, or Extension agent who wants to replicate the survey five years from now (Salant and Dillman, 1994). On the other hand, oral communications tend to be more informal. These channels include:
-
Conversations
-
News conferences
-
PSAs
A notable exception to this statement is a formal speech or presentation.
Enhancing the Story
Regardless of the channel selected for presenting the information, it is possible to make both written and oral channels of communication more easily understood by a wider audience through the use of visual tools. One practical way to demonstrate survey findings is by using graphics in the report. Bar graphs, histograms, pie charts, and other graphics are powerful communication tools. These visuals can offer an excellent method to condense large amounts of numerical survey data and emphasize the important findings (Salant and Dillman, 1994), making the information easier to understand.
Charts and graphs help the audience visualize the information (see Savvy Survey Series #16, Data Analysis and Survey Results, for more information on charts and graphs). If a presenter decides to use a PowerPoint slideshow as a visual aid during a verbal presentation, it is important to understand the concept of sizing images. The size of a graphical image used in a written report may be unreadable by an audience once moved to a PowerPoint (e.g., text is too small or the picture is pixelated). When transferring graph images to PowerPoint, the presenter should check them to see if they are clearly readable. It would be useful to have several stakeholders or colleagues review the graph images for readability.
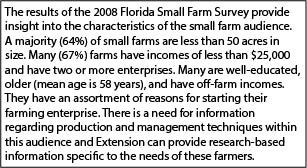
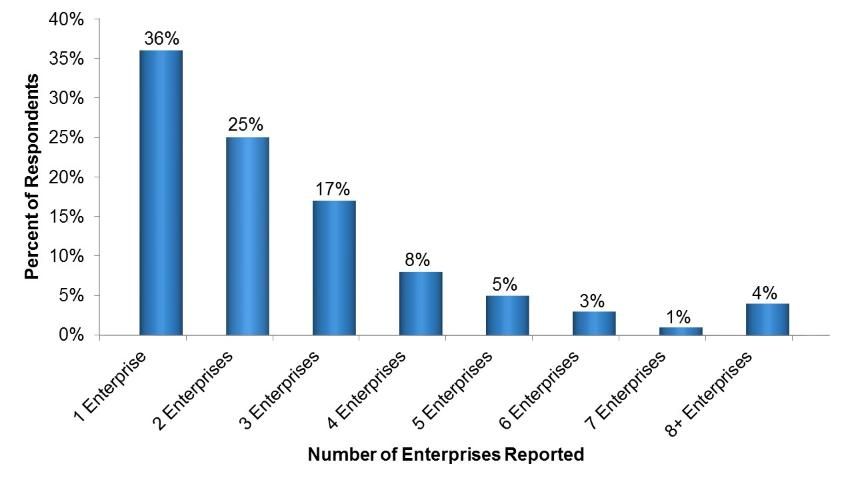
The following example demonstrates the use of visuals (e.g., charts, graphs, figures, etc.) to support written text. County faculty who work with clients in the small farm audience need to understand the diversity of these groups (or this group). Summaries from the 2008 Florida Small Farm Survey can be used to formulate situational statements for a plan of work (Figure 2a). One method of enhancing the situation statement in order for readers to see the need for programming is by creating charts or graphs. Visuals allow for the information to be translated in a way many readers can comprehend, as illustrated by Figure 2b. Meanwhile, it is also recommended that several stakeholders or cooperating partners read a draft of the yearly report and provide their interpretations of the findings.

Credit: Adapted from Gaul et al. (2009)

Extension Annual Report of Accomplishment
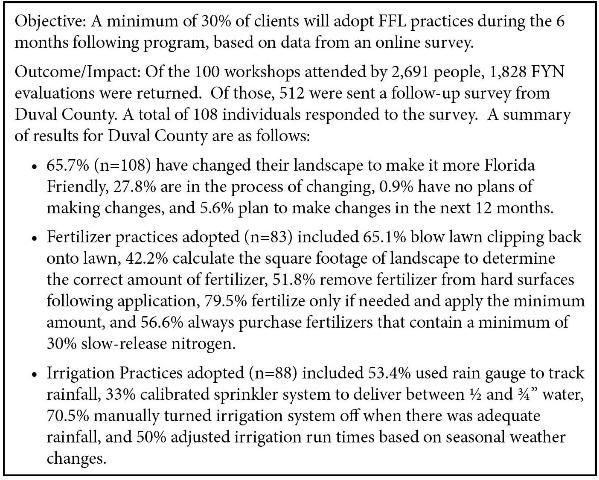
Within Extension, the annual Report of Accomplishment (ROA) is a highly formal document that can be used to inform internal audiences of many aspects of an extension program. It is often used in the performance evaluation of Extension professionals and serves as a building block for faculty who must prepare a promotion dossier. This report captures the successes of programs as well as participation and other outputs. Typically, the report consists of narratives about each program that has been implemented. While this information can be based on the observations of Extension agents, specialists, and participants, a survey can provide added detailed about a program. For example, survey results can more substantially demonstrate either the need for a program or the impact of a program. Additionally, survey results can be aligned with the program's logic model to check for consistency in implementation and outcomes. In Florida, specific guidelines for completing the annual ROA are available on the Office of District Extension Directors website. Figure 3 illustrates the use of survey data to document the outcome of a county faculty member's annual report. It is noteworthy that the outcome information includes a description of client participation in the program, the number surveyed, and number responding. The example also reports the number of responses that correspond with the percentages adopting each behavior. Finally, there is ample evidence to document that the objective has been met.

Credit: Adapted from: DelValle (2013)
In Summary
Survey results can help strengthen the impact of a yearly report. For internal audiences, a detailed report covering the specifics of the survey results is appropriate. Meanwhile, with external audiences, utilizing a brief report of the key points from the survey results can be very useful. These key points can be presented in either a written form (fact sheet) or a verbal form (oral presentation). It is important to assess which audience will have to interpret the findings and to tailor the report to that specific audience.
When reporting survey findings, it is also important to keep in mind that the results are not perfectly accurate. In other words, all survey results have some degree of error and will differ from the actual population values (only a little in most surveys, but a lot in a few). Sample surveys only produce estimates of what the respondents think and/or do. By making this clear to the audience, credibility increases, and it helps the audience correctly interpret the results (Salant and Dillman, 1994). Presenting this information in a transparent way clarifies the extent to which the findings can be generalized from the sample.
References
DelValle T. B. (2013). County faculty annual 2013 ROA and 2014 POW. Jacksonville, FL: Unpublished report.
Gaul, S. A., R. C. Hochmuth, G. D. Israel, and D. Treadwell. (2009). Characteristics of small farm operators in Florida: Economics, demographics, and preferred information channels and sources. Gainesville: University of Florida Institute of Food and Agricultural Sciences. https://edis.ifas.ufl.edu/wc088
Salant, P. and D. A. Dillman. (1994). How to conduct your own survey: Leading professionals give you proven techniques for getting reliable results. New York: John Wiley & Sons, Inc.