Introduction
This document is intended primarily for Florida sugarcane growers but may also be useful to researchers and others interested in sugarcane nutrition. It presents revised potassium (K) fertilizer recommendations for sugarcane grown on Florida organic soils along with supporting information.
Potassium is a primary plant nutrient that is required in large amounts by sugarcane (Saccharum spp.). It is a major expense for sugarcane growers in Florida. About 74% of the 400,000 acres of Florida sugarcane is grown on Histosols (organic soils) in the Everglades Agricultural Area (EAA). Potassium is not a component of organic matter and virgin Histosols contain very low concentrations of K, so release of K through mineralization of organic matter in these soils is not an adequate K source for plant growth. Although organic soils in the EAA have high cation exchange capacity (typically 65–100 cmol/kg), these soils do not have appreciable clay content within the root zone except for the Torry muck soil series near Lake Okeechobee (McCray et al. 2019). This can limit the capacity of these soils to retain reserve soil K. The Torry muck soils are defined as having at least 35% mineral content, which is primarily clay minerals that were deposited in historic overflows from Lake Okeechobee. Potassium is weakly held on soil cation exchange sites, so there is potential for K movement with high rainfall; however, rapid leaching should not occur in these soils.
Functions of K in plants include regulation of water uptake, sugar translocation, maintenance of cell turgidity, and starch formation. Potassium is the most abundant positively charged ion in sugarcane cell sap, which indicates the large K requirement of the crop. Estimates of K removed by sugarcane harvest on Florida organic soils have ranged from 3.3 to 6.6 lb K/ton cane (Andreis 1975; Coale et al. 1993), which correspond to approximately 4–8 lb K2O/ton cane. Luxury consumption can occur with potassium and is defined as nutrient uptake in excess of what is required for optimum plant growth. A high proportion (68%) of crop K uptake has been determined to occur during the grand growth period (June 1–October 15) in Florida with the maximum plant K uptake during June and July (Coale et al. 1993).
UF/IFAS potassium fertilizer recommendations for sugarcane grown on organic soils are based on preplant soil extraction with 0.5 M acetic acid and range from 0 to 250 lb K2O/acre depending on soil test value. For Florida organic soils, K is routinely banded in the furrow at planting or used as a sidedress application that can be applied once for each crop. Previous K recommendations were based on research from the 1970s and earlier (Gascho and Kidder 1979; Le Grand, Burdine, and Thomas 1961). Since the development of the previous recommendations, there have been many changes in sugarcane varieties. Organic soils have become shallower with subsidence, resulting in higher pH as calcium carbonate is mixed into the topsoil through tillage and movement of irrigation water. Evaluating potassium recommendations on these soils became necessary in light of these changes. A study examining sugarcane yield response to K fertilizer was conducted at six locations with a total of 14 crop years (number of locations x number of crops at each location). Sugarcane K fertilizer recommendations for organic soils were revised based on the results of that study.
Sugarcane Yield Response to Potassium Fertilizer
A study examining sugarcane yield response to K fertilizer was conducted at six locations from 2009 to 2014 (Table 1: Sites 1–6) (McCray, Ji, and Powell 2017; McCray and Powell 2016). Site 7 was the location of a previous experiment conducted from 1996 to 1999 that was used to evaluate the responses from the more recent study. Initial soil test K values ranged from 27 to 193 lb K/acre at these locations, providing for a range of probability of yield response to K fertilizer from high to low, respectively. These soil test values were determined by extraction with 0.5 M acetic acid and are expressed as lb/acre in this publication and recommendations provided to growers. Keep in mind that soil test results are index values that are useful only in relationships determined in yield response trials and for recommendations based on those yield responses. Table 1 also lists the soil test values expressed as g/m3, and g/m3 can be converted to lb/acre by multiplying by 1.36 for organic soils in the EAA.
For the combined dataset for Sites 1–6, site, crop year (plant cane, first ratoon, or second ratoon), and K rate each significantly influenced tons cane/acre (TCA), tons sugar/acre (TSA), sucrose concentration expressed as lb sugar/ton cane, stalk weight, and stalk population (stalks/ft row) (Table 2). Sugarcane yield response to K fertilizer varied with location and initial soil test K. In five of the 14 crop years, TSA showed a positive response to K fertilizer application. Positive yield responses to K fertilizer were determined to be attributable to increases in sugarcane tonnage or biomass and not to increased sucrose concentration. However, during four of the 14 crop years, there were significant negative linear effects of K rate on lb sugar/ton cane. The plant cane crop at Site 6 showed the greatest reduction in sucrose concentration: there was a 7% lower value for lb sugar/ton cane at the highest K rate compared to the zero rate. In trials conducted from 1968 to 1972, Gascho and Kidder (1979) measured up to 11% reduction in sucrose concentration with increasing K fertilizer rate on EAA Histosols, but that level of reduction was at a K rate of 480 lb K2O/acre compared to the zero rate. Generally, reductions in sucrose concentration with K fertilization have only been found in Florida with applications above the recommended rates.
In the experiment at Site 7, crop and K rate each significantly affected TCA and TSA (Table 3). Crop year also had a significant influence on lb sugar/ton cane. As with Sites 1–6, increases in TSA with K fertilizer application were due to increases in sugarcane tonnage and not sucrose concentration.
Relation between Soil Test Potassium and Sugarcane Yield
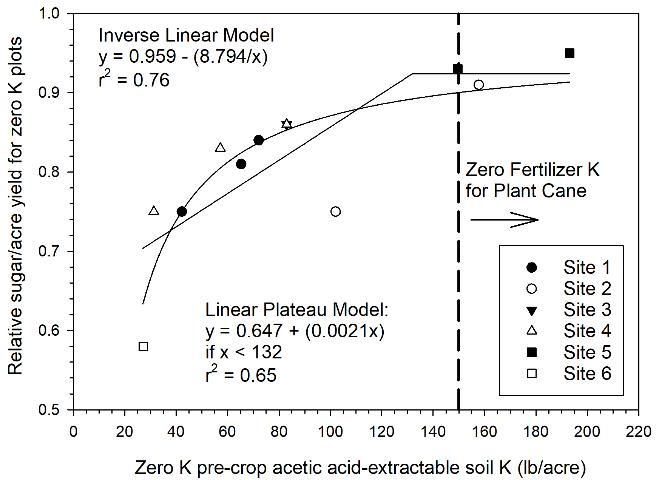
Regression models were used to relate sugarcane yield response to soil test K and to K fertilizer rate. In Figure 1, relative sugar yield (based on TSA) is related to pre-crop acetic acid–extractable soil K for zero K plots (plots with no K fertilizer applied). Relative sugar yield was determined for the zero K treatments for each crop year at each site by dividing TSA for the zero K treatments by the corresponding highest TSA value for all treatments. Relative yield between 0.9 and 1.0 for the zero K treatments indicate that there was little yield response to K fertilizer, and lower relative yield for the zero K treatments was associated with stronger yield response to K fertilizer. Also, relative yield allows comparison of yield response across different years and locations.

Credit: McCray, Ji, and Powell (2017)
Regression models indicated that as soil test K value increased, response to K fertilizer decreased. The linear plateau model reached a yield plateau at 132 lb K/acre and the inverse linear model achieved 98% of maximum model relative yield at 139 lb K/acre. These values are within 12% of the previous soil test limit of 150 lb K/acre at or above which no K fertilizer is recommended for the plant cane crop. In practical terms, this is considered a confirmation of the previous K fertilizer limit for plant cane recommendations.
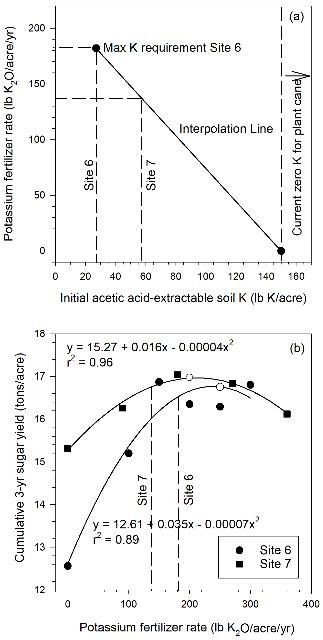
The limit for K fertilizer application for plant cane (zero fertilizer K at 150 lb K/acre soil test) and the maximum K fertilizer requirement at Site 6 (182 lb K2O/acre fertilizer rate at 27 lb K/acre soil test) are illustrated as the two endpoints in Figure 2a. These points are connected by an interpolation line. Using this interpolation line indicates a crop fertilizer requirement of 137 lb K2O/acre for the initial soil test value of 57 lb K/acre at Site 7. Quadratic models were used to relate cumulative three-year sugar yields to annual K fertilizer rate at Sites 6 and 7 (Figure 2b). The maximum K requirement for Site 6 (182 lb K2O/acre) corresponds to 98.6% of the maximum quadratic model sugar yield. The 137 lb K2O/acre rate determined from the interpolation line (Figure 2b) corresponds to 98.8% of the maximum quadratic model sugar yield for Site 7. This demonstrates that using the interpolation line to determine annual crop K requirement for a different location and different soil test concentration results in a similar relative sugar yield. Additionally, three-year sugar yields produced at the indicated K fertilizer rates were more than 98% of the maximum model predictions for each site and are considered near optimum. Results from Site 7 confirm that results from Sites 1–6 can serve as a guideline for revising K fertilizer recommendations.

Credit: McCray, Ji, and Powell (2017)
Revised Potassium Fertilizer Recommendations
Results of the K rate study were used to revise K fertilizer recommendations for sugarcane on organic soils (Table 4). The interpolation line developed in Figure 2a was used as a guideline for revising recommendations with some allowance made for field variability in soil test values. An example is the soil test value of 27 lb K/acre that had an estimated K fertilizer requirement of 182 lb K2O/acre at Site 6. Rather than assigning a recommendation of 200 lb K2O/acre for a soil test of 27 lb K/acre and 250 lb K2O/acre for soil test values below 27 lb K/acre, the revised recommendations assign 250 lb K2O/acre for soil test values up to 39 lb K/acre and 200 lb K2O/acre for soil test values between 40 and 59. This allows for both variability in soil test values across a field and situations of high sugarcane production and high crop removal of K. In Figure 2, the open circles on each quadratic response curve represent where the new recommendations are for the initial soil test values of Sites 6 and 7.
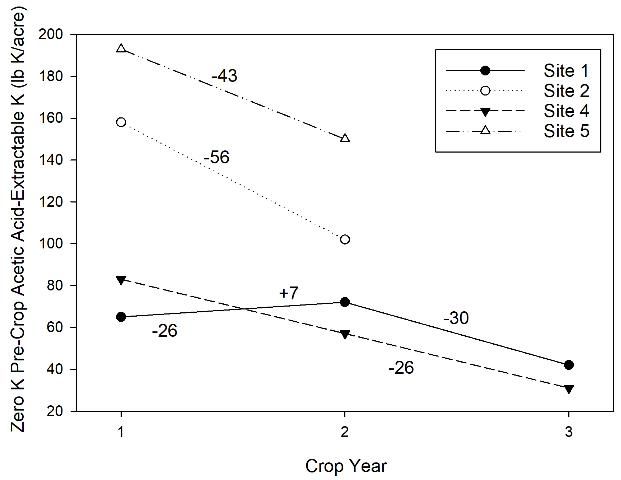
As with the previous recommendations, the new K fertilizer recommendations for plant cane and ratoon crops are based on a preplant soil test. This is due to the problems with obtaining a representative soil sample after banding fertilizer in previous crops. Decreases in soil test values over time with no K fertilizer application (Figure 3) were used to allow for decrease in soil test each crop year. This information was used to adjust the limit of K recommendations for first ratoon from 180 to 200 lb K/acre for the soil test. For second ratoon crops, the soil test limit for K fertilizer was maintained at 300 with soil test values between 240 and 299 receiving a recommendation of 100 lb K2O/acre. For third ratoon and older crops, all fields regardless of soil test value receive a recommendation of 150 lb K2O/acre to maintain adequate K for the crop. This is also done due to the difficulty of predicting soil K values three years after the preplant soil test. Acreage of third ratoon and older sugarcane is typically less than 10% of total sugarcane acreage in Florida, but these fields are only kept in production if sugarcane yields are profitable. Therefore, maintaining adequate fertilization is important.

Credit: McCray, Ji, and Powell (2017)
As in the current study, previous studies did not determine responses in TSA up to the 250 lb K2O/acre rate (Gascho and Kidder 1979). The 250 lb K2O/acre rate was included in part to build up soil test K for fields with low soil test values. The approach of building up soil test K values is difficult in Florida, even in organic soils, due to high rainfall and the potential for K movement in these soils. Soil test values can be increased to some degree, but the revised recommendations are designed primarily to supply needed nutrients for each crop to achieve optimum economic returns. With that in mind, the 200 lb K2O/acre rate was added so there would be a smoother transition of K rates through the range of soil test values. This provides a complete range of 100–250 lb K2O/acre in 50 lb K2O/acre increments. The 250 lb K2O/acre rate is still included for extremely low soil test values, and the 100 lb K2O/acre rate is considered the lowest practical application rate. The revised recommendations provide for an estimated average of 2% less K fertilizer applied across all crop ages for sugarcane on organic soils compared to the previous recommendations. Most of the fertilizer savings is in the plant cane crop with slightly more K fertilizer applied to first ratoon on average than in previous recommendations.
References
Andreis, H. J. 1975. "Macro and micro nutrient content of millable Florida sugar cane." Sugar Journal 37(8): 10–12.
Coale, F. J., C. A. Sanchez, F. T. Izuno, and A. B. Bottcher. 1993. "Nutrient accumulation and removal by sugarcane grown on Everglades Histosols." Agronomy Journal 85: 310–315. doi:10.2134/agronj1993.00021962008500020028x.
Gascho, G. J. and G. Kidder. 1979. Responses to Phosphorus and Potassium and Fertilizer Recommendations for Sugarcane in South Florida. Bulletin 809. Gainesville: Florida Cooperative Extension Service.
Le Grand, F., H. W. Burdine, and F. H. Thomas. 1961. "Phosphorus and potassium requirements for growing sugarcane on organic soils in south Florida." Sugar Journal 24(1): 22–26.
McCray, J. M., S. Ji, and G. Powell. 2017. "Sugarcane yield response to potassium fertilization as related to extractable soil potassium on Florida Histosols." Agronomy Journal 109: 2243–2252. doi:10.2134/agronj2016.11.0630.
McCray, J. M. and G. Powell. 2016. "Sugarcane yield response to potassium on a Florida Histosol." Journal of American Society of Sugar Cane Technologists 36: 9–18.
McCray, J. M., H. S. Sandhu, R. W. Rice, and D. C. Odero. 2019. Nutrient Requirements for Sugarcane Production on Florida Muck Soils. SS-AGR-226. Gainesville: University of Florida Institute of Food and Agricultural Sciences. https://edis.ifas.ufl.edu/sc026
Sugarcane cultivar, soil series, planting date, soil organic matter (OM) content, soil pH, and initial acetic acid–extractable soil K (0–6 inches) for all sites of the potassium rate study.
Results of statistical analysis for combined data set of all available crops at Sites 1-6 for tons cane/acre (TCA), tons sugar/acre (TSA), lb sugar/ton cane, stalk weight, and stalks/ft row.
Results of statistical analysis for Site 7 for tons cane/acre (TCA), tons sugar/acre (TSA), and lb sugar/ton cane.