Market Opportunities for Florida Farmed Oysters
Abstract
The oyster aquaculture industry has grown quickly in recent years. With the recent expansion in the industry, producers have adopted new farming techniques to target specific attributes that increase oysters’ value and allow them to be sold in the high-value, half-shell market. Understanding which attributes can increase value is important for oyster growers; however, a lack of economic data makes it difficult for growers to effectively market premium oysters. This publication summarizes key findings from a recent study that used restaurant menus to obtain economic data about raw, half-shell oysters. Major findings indicate that brand is an oyster attribute that provides value and that marketing oysters with information on two or more attributes can also result in higher prices. Additionally, locally sourced oysters are often sold at cheaper prices, which provides an opportunity for growers from outside regions to enter new markets with their oysters being sold as “premium” products. The findings within this publication are especially useful to Florida oyster growers as attempts to expand Florida’s oyster aquaculture industry continue.
Introduction
Oyster aquaculture has grown recently (Botta et al. 2020). Producers, including those in Florida, have adopted new farming techniques to target specific attributes such as taste, size, and appearance that are often valued by consumers. These new techniques have helped oyster producers enter the growing high-value half-shell market. Additionally, production and environmental differences can create product varieties that can be marketed. For example, an eastern oyster (Crassostrea virginica) cultured in Cedar Key, Florida, may have different attributes, including appearance and taste, than one grown in Apalachicola Bay, Florida. It is important for producers to understand which attributes can increase value. This publication summarizes the findings of a study that quantified which attributes provided oysters with the highest value (Botta et al. 2022). This information is useful to restaurants, chefs, regulatory personnel, and oyster growers, as well as to Extension agents who provide information to growers.
Florida’s Oyster Aquaculture Industry
Florida is home to a diverse and extensive aquaculture industry. In 2018, there were 325 reported aquaculture farms with total production valued at 71.6 million USD. This ranks Florida second in the United States behind Louisiana in number of farms and ninth in sales value (USDA 2019). While Florida is largely known for its ornamental fish industry, bivalve aquaculture also plays a substantial role in the state. The shellfish aquaculture industry was valued at 15.5 million USD in 2018 and is ranked the second most valuable aquaculture industry behind ornamental fish in the state of Florida (FDACS 2020). This industry is dominated by hard clams (Mercenaria mercenaria), but production also includes eastern oysters and Sunray Venus clams (Macrocallista nimbosa). Between 2010 and 2020, the number of shellfish leases has increased by approximately 36% (FDACS, personal communication, January 3, 2022). Much of this growth can be attributed to oyster production. In 2015, there were 15 leases dedicated to oyster production, but this increased to 130 leases by 2020. Additionally, leases that allow for both clam and/or oyster farming increased from 65 leases in 2015 to 187 leases in 2020. This growth was facilitated by new regulations in 2015 that permitted the use of the water column for oyster production in Florida (Florida Aquaculture Policy Act 2015).
New oyster farming techniques have improved producer control of product quality and the aesthetic characteristics that contribute to the oysters’ value (Petrolia et al. 2017). Improvement of oyster attributes can result through genetic selection but also through environmental conditions and culture practices (Walton et al. 2013; de Melo et al. 2019). For instance, off-bottom farming allows oysters to grow in higher-salinity water with more water movement, lower risk of predation, and improved control of fouling. All of these result in more consistent and regularly sized shells, and therefore a higher-quality product (Mizuta and Wikfors 2019). Oyster farming also increases flexibility in farm locations and proximity to markets compared to wild oyster harvesting, and previous studies indicate locality as an important determinant of consumer willingness-to-pay (Chen et al. 2017; Petrolia et al. 2017). These new techniques have given oyster growers increased control over the production process, something critical for the most successfully cultured species (Asche 2008).
The Value of Oysters and Their Attributes
Researchers collected information on raw, half-shell oysters, including price per piece and attributes from restaurant menus across the United States (Botta et al. 2022). Oysters on the West Coast had the highest prices on average ($3.71), followed by oysters from an unspecified location ($3.41), East Coast oysters ($3.34), and finally Gulf Coast oysters ($2.69) (Figure 1). Oyster prices also vary depending on where they are sold. Oysters sold at restaurants in the Pacific region yielded the highest oyster price on average ($3.61), followed by the Midwest ($3.47), the Northeast ($3.34), and finally the South ($2.92) (Figure 2). It is of particular interest to note that the Midwest, where there is no oyster production, has neither the highest nor the lowest average oyster price. This strongly suggests that East Coast and West Coast industries operate under efficient logistics (i.e., distribution and shipping) and further supports the notion that there is significant market segmentation. The South is where the majority of the US wild harvest occurs, and competition with wild harvested oysters drive down prices in this region (Botta et al. 2020).
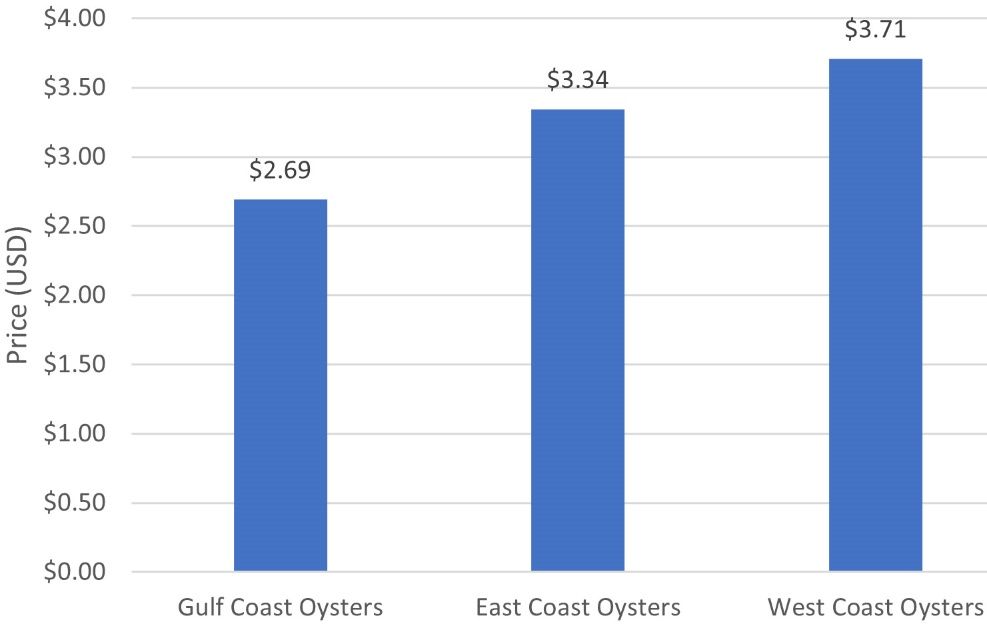
Credit: UF/IFAS
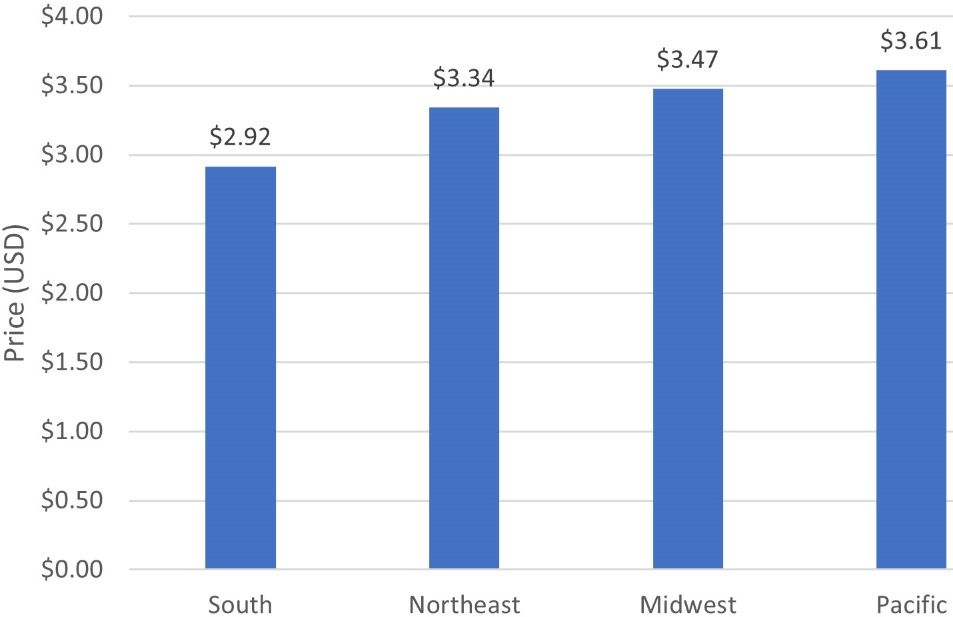
Credit: UF/IFAS
East Coast oysters are the most prevalent and most common in all regions except the Pacific, where West Coast oysters are the most common (Figure 3). In the South, East Coast oysters (52%) were more prevalent than West Coast oysters (21%). However, it is interesting that the South is the primary market for Gulf Coast oysters. Researchers found no Gulf Coast oysters being sold in the Northeast or Pacific regions, while only one restaurant in the Midwest sold Gulf Coast oysters. This result, in part, reflects the nascent state of oyster farming in the Gulf of Mexico, as well as a myriad of other factors, such as the collapse of the oyster populations in Apalachicola Bay, Florida.
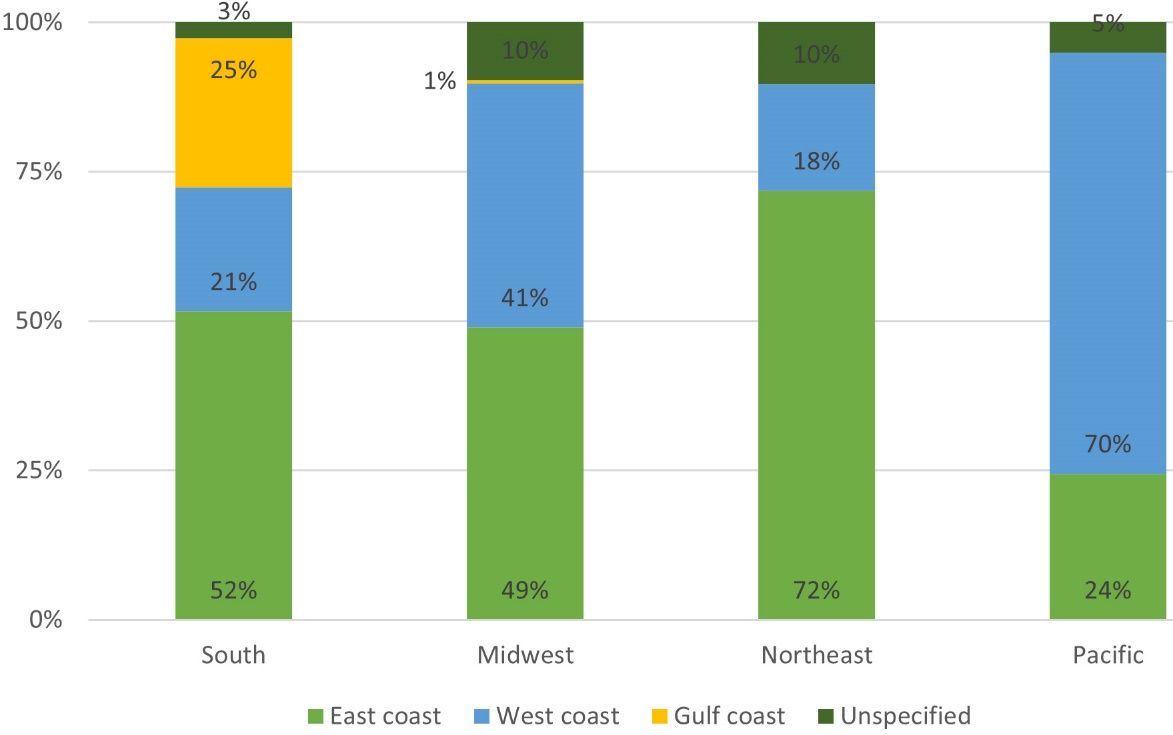
Credit: UF/IFAS
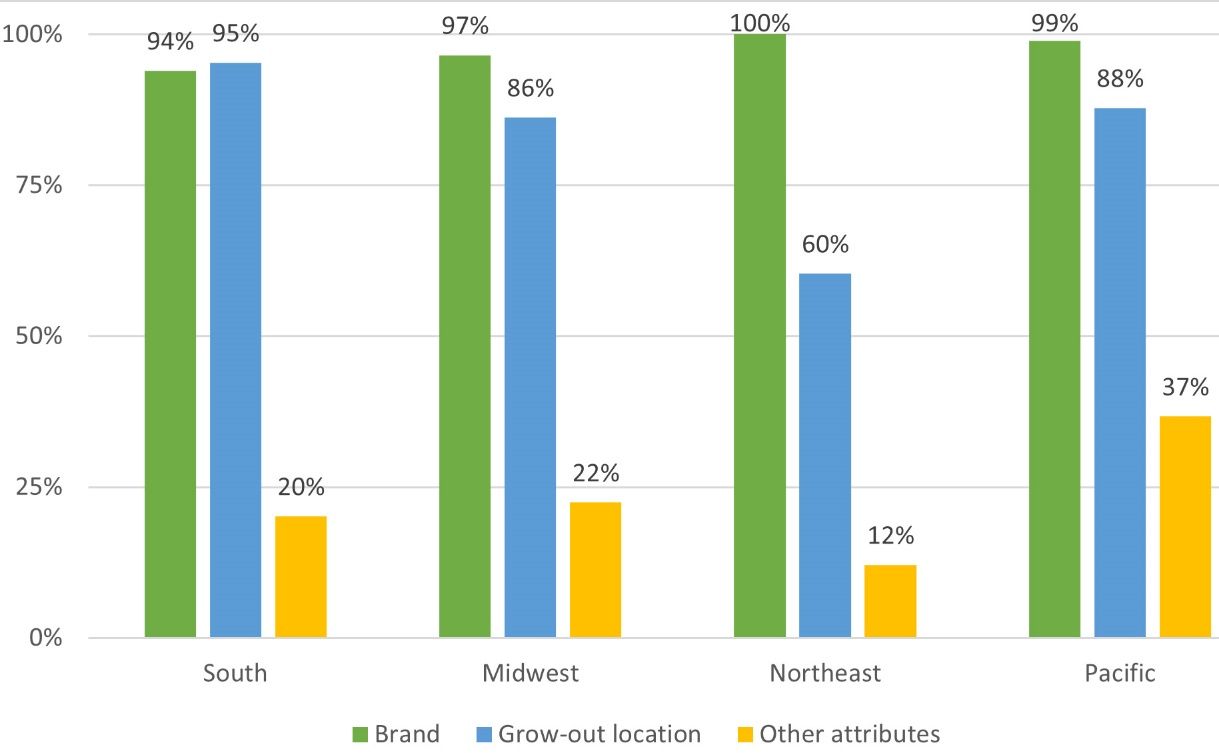
Researchers also examined five specific attributes: brand, production location, culture method, size, and taste. Oysters were then classified as being sold with no attributes, one attribute, or two or more attributes. In general, restaurants in the Pacific region, followed by the South, provided more information on oyster attributes than other regions. Oysters that menus described with two or more attributes were sold at higher prices. The share of oysters sold with no attributes, one attribute, or two or more attributes can be seen in Figure 4. Most oysters were sold either with no attributes or with two or more attributes. So a large number of restaurants have highly developed communication strategies, and, conversely, a large number of restaurants provide little or no menu information when selling oysters on the half-shell. In other words, most restaurants either know a lot and say a lot about the oysters on their menus—Figure 4 shows that those restaurants tend to be the ones in coastal, oyster-producing regions—or they know and say nothing about oysters—Figure 4 reveals that those tend to be the restaurants in landlocked regions. Producers supplying the restaurants in places where oysters are not produced should consider providing attributes that can be used to describe the product on menus. Additionally, Figure 5 illustrates that brand and production location were the most commonly provided attributes.
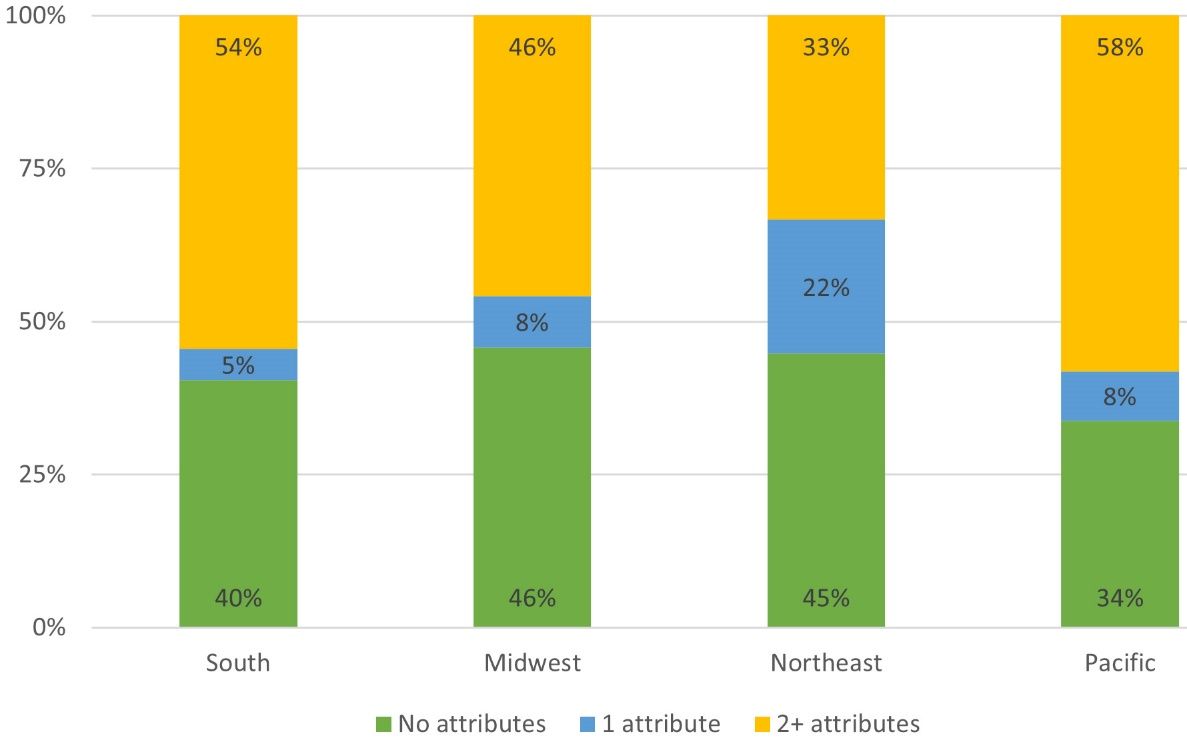
Credit: UF/IFAS
Credit: UF/IFAS
There was a relationship between specific attributes and raw oyster prices at US restaurants. The presence of a brand increased an oyster’s price by 18%. Providing two or more attributes for an oyster on a menu increased its price by 21%. The production location also influences oysters’ value. West Coast oysters were found to fetch between a 67% and 69% price premium compared to oysters that were sold with no specified origin, while East Coast oysters were found to fetch between a 47% and 48% price premium when compared to oysters with no specified origin. Most importantly, there does not appear to be a premium for local oysters. Often, consumers are found to prefer locally produced goods, which leads to price premiums (Kecinski et al. 2017). However, in this case, East Coast oysters sold in the Northeast receive a price discount of 31%, while West Coast oysters sold in the Pacific region receive a price discount of 47%. There was no effect found for local Gulf Coast oysters sold in the South, but this is likely due to the fact that Gulf Coast oysters are not sold in the Northeast and Pacific regions.
Interviews with restaurant owners and chefs in the Northeast indicated that local oyster supplies were limited in the winter and spring months due to limited growth associated with colder water temperatures. These patterns suggest an opportunity for Gulf Coast oyster producers, including those in Florida, to seasonally supplement these markets, although supply challenges must also be addressed. Gulf Coast growers have struggled with seed supply and often cannot supply oysters consistently and at quantities preferred by restaurants and wholesalers. Grower cooperatives, or groups of growers working collectively in production, may provide a possible path to achieve the scale and supply consistency that individual growers could not otherwise achieve. Additionally, cooperatives could support collective downstream activities such as branding and marketing (Walsh 2020). Currently, there are few branded oysters in the Gulf of Mexico relative to other US regions and even fewer in Florida (e.g., Pelican Reef Oysters in Cedar Key), even though brand is an important attribute that provides value. Given that many Florida growers are small-scale and lack access to capital, grower cooperatives could serve to help spread out the costs and time demands of brand development. This could ultimately be useful for entering markets in other regions (e.g., Pacific or Northeast) and receiving price premiums relative to the local oysters. While producers must make significant efforts to address supply constraints and shipping logistics, effective marketing may allow these producers to differentiate their oysters from other Gulf Coast oysters and enter high-profile markets.
Conclusions
Oysters have a wide variety of attributes that vary nationally, regionally, and locally while contributing to oyster value. Brand is an attribute that provides value and marketing, and including information on two or more attributes can also result in higher prices. Thus, there is an opportunity to fetch a premium for providing an oyster brand alongside some other information about the oyster. This is a useful finding for producers, distributors, and restaurants, alike. If producers can effectively brand their oysters in a way to make them memorable and attractive to consumers, they can charge a premium for their product.
Gulf Coast oysters were priced lower than those grown elsewhere in the United States. Although the sample size of Gulf Coast oysters in this study was much smaller than East Coast and West Coast oysters, this is an indication that Gulf Coast oysters are a regional product consumed almost exclusively in the South. Because of this, Gulf Coast oysters are unable to fetch the same price premiums as other oysters that are in high-profile markets seen in large cities (e.g., San Francisco, Seattle, New York). Interestingly, there was no premium for “local” oysters. These findings imply that shipping costs and efficient production logistics are highly influential factors when determining oyster prices.
The lack of Gulf Coast oysters seen outside of restaurants in the South may be attributed to production issues. There is no single “fix” for these issues, but it is possible that grower cooperatives may help individuals pool resources and power to increase supply and consistency of their product. Additionally, it may help regions develop branding that can add value to the product, since very few Florida oysters make it through the wholesaler and distribution channels while retaining their branding. These changes should help Florida oyster growers increase the value of their product and their share of the US oyster industry.
References
Asche, F. 2008. Farming the Sea. Marine Resource Economics 23:527–547. https://doi.org/10.1086/mre.23.4.42629678
Botta, R., F. Asche, J. S. Borsum, and E. V. Camp. 2020. “A Review of Global Oyster Aquaculture Production and Consumption.” Marine Policy 117. https://doi.org/10.1016/j.marpol.2020.103952
Botta, R., T. Garlock, J. L. Anderson, F. Asche, and A. Ropicki. 2022. “Market Opportunities for Florida’s Emerging Oyster Aquaculture Industry.” Report submitted to UF/IFAS SEEDIT Program.
Chen, J. Q., M. C. Haws, and Q. S. W. Fong. 2017. “Locally Grown Oysters in Hawai ‘i : Chef Preference and Local Premium?” Journal of the World Aquaculture Society 48:972–980. https://doi.org/10.1111/jwas.12430
Dame, R., L. Sturmer, C. Adams, R. Weldon, and K. A. Grogan. 2019. “Financial Risk in Off-bottom Oyster Culture along Florida’s West Coast:” FE1070, 9/2019. EDIS, 2019(5): 10–10. https://doi.org/10.32473/edis-fe1070-2020
de Melo, C. M. R., K. Divilov, B. Schoolfield, and C. Langdon. 2019. “Selection of Group and Individual Traits of Pacific oysters (Crassostrea gigas) on the West Coast, US.” Aquaculture 512:734389. https://doi.org/10.1016/j.aquaculture.2019.734389
Florida Aquaculture Policy Act, Fla. Stat. § 597. 2015. https://www.flsenate.gov/Laws/Statutes/2015/Chapter597/All
Florida Department of Agriculture and Consumer Services. 2020. Florida Aquaculture Industry Overview.
Kecinski, M., K. D. Messer, L. Knapp, and Y. Shirazi. 2017. “Consumer Preferences for Oyster Attributes: Field Experiments on Brand, Locality, and Growing Method.” Agricultural and Resource Economics Review 46:315–337. https://doi.org/10.1017/age.2017.21
Mizuta, D. D., and G. H. Wikfors. 2019. “Seeking the Perfect Oyster Shell.” Reviews in Aquaculture 11 (3): 586–602. https://doi.org/10.1111/raq.12247
Petrolia, D. R., W. C. Walton, and L. Yehouenou. 2017. “Is there a market for branded Gulf of Mexico Oysters?” Journal of Agricultural and Applied Economics. 49:45–65. https://doi.org/10.1017/aae.2016.30
USDA, 2019. 2018 Census of Aquaculture. 2017 Census Agric. 3, AC-17-SS-2.
Walsh, P. 2020. Cultivating Cooperatives: Benefits and Challenges of Co-Ops and Recommendations for Maine’s Emerging Aquaculture Industries. Graduate Program in Ocean Food Systems, University of New England, Maine, USA.
Walton, W. C., F. S. Rikard, G. I. Chaplin, J. E. Davis, C. R. Arias, and J. E. Supan. 2013. “Effects of Ploidy and Gear on the Performance of Cultured Oysters, Crassostrea virginica: Survival, Growth, Shape, Condition Index and Vibrio Abundances.” Aquaculture 414–415:260–266. https://doi.org/10.1016/j.aquaculture.2013.07.032

