Floridian Households’ Perceptions of Florida-Friendly Landscapes
Introduction and Project Overview
This report is the second in a series from the Sustainable Residential Landscape Project. The Sustainable Residential Landscape Project encompasses several studies with the purpose of investigating Floridians’ perceptions of landscapes, factors that could influence their adoption of more sustainable landscape options (i.e., Florida-Friendly Landscapes), and means of promoting more sustainable landscaping options. The project was funded by the UF/IFAS Center for Landscape Conservation and Ecology (CLCE).
From 2000 to 2010, urban areas in the United States increased by 12.1% to cover 3% of the country’s landmass (contiguous United States) (US Census Bureau 2015). Eighty percent of the total US population lives in urban areas (Nowak et al. 2010). Multiple studies have demonstrated that landscapes and other green areas (e.g., parks) improve quality of life and provide many economic, health, and environmental benefits to homeowners and other community members (Hall and Dickson 2011; Hall and Knuth 2019a; Hall and Knuth 2019b). Sustainable residential landscapes are one means of providing these benefits but with reduced inputs (e.g., fertilizer, irrigation, pest controls, labor requirements, etc.). Reduced landscape inputs are desirable from an economic and environmental standpoint in that they cost less to maintain and reduce the likelihood of pollution (e.g., water pollution due to excess fertilizer runoff or leaching) (Suh et al. 2017). Furthermore, research suggests that homeowners are interested in plants that require fewer inputs (Yue, Hugie, and Watkins 2012), indicating there may be demand for landscapes offering similar options. Before offering these options, it is important to understand public acceptance of sustainable landscape practices. Specifically, this report summarizes Floridian homeowners’ perceptions of Florida-Friendly Landscapes, which aim to reduce inputs and costs while improving environmental health (see https://ffl.ifas.ufl.edu).
Project Objectives
- Determine homeowners’ perceptions of Florida-Friendly Landscapes and how those might influence their behavior;
- Assess homeowners’ purchase/installation likelihood of more sustainable landscape options such as Florida-Friendly Landscapes;
- Determine primary purchase/installation barriers for Florida-Friendly Landscapes; and
- Identify key promotional strategies that could encourage the purchase/installation of Florida-Friendly Landscapes.
To address the project objectives, an online survey was administered to 610 Florida homeowners in 2016. Only people who live in a single-family house with an irrigated landscape were asked to participate. The survey consisted of several sections that contained questions related to the project objectives. As an incentive, respondents received online reward points after completing the survey.
A series of reports summarizes data from the study to provide green industry stakeholders a snapshot of their market. This report summarizes homeowners’ perceptions of Florida-Friendly Landscapes and how individual perceptions influence landscaping behaviors. The results are of particular interest to the landscape industry, Extension agents, and other individuals interested in aiding homeowners with residential landscape management.
Who participated in the study?
- Sample size: 610 participants
- Average age: 51 years old
- Gender: 59% female
- Education: 51% have a 4-year college degree or higher
- 2015 household income:
- 20% have an income less than $40,000
- 54% have an income between $40,000–$99,999
- 26% have an income greater than $99,999
- Household size: 65% of households consist of 2 adults
- Children in household: 68% have 0 children living in their home
- Landscape maintenance responsibilities:
- 60% maintain their own landscape
- 40% hire a landscaping company
- Geographical location: All participants live in Florida but in different regions (Figure 1)
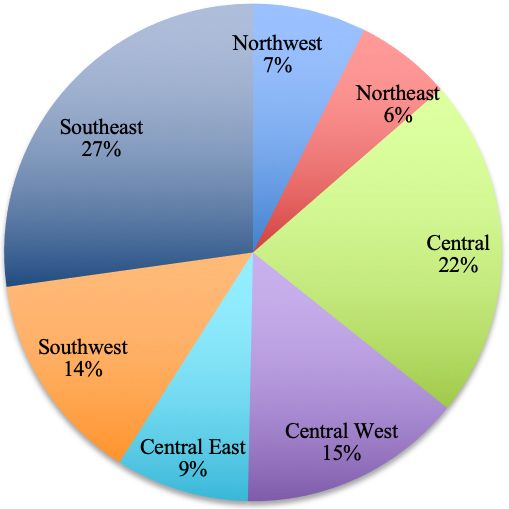
Figure 1. Floridian participants’ regions of residence. UF/IFAS
Results
The results of this portion of the study focus on landscape perceptions, Florida-Friendly Landscape perceptions, consumer knowledge, purchase likelihood and barriers, and promotional opportunities.
Landscape Perceptions
Consumers are diverse in their perceptions of products. This section summarizes participants’ levels of agreement with different landscape-related statements. Respondents indicate they are primarily concerned about landscape appearance (Figure 2). They are also unaware of fertilizer restrictions, Florida-Friendly Landscape appearance, and whether their neighbors over-irrigate. They agree less with statements about their neighbors having a Florida-Friendly Landscape and being unaware of local irrigation restrictions.
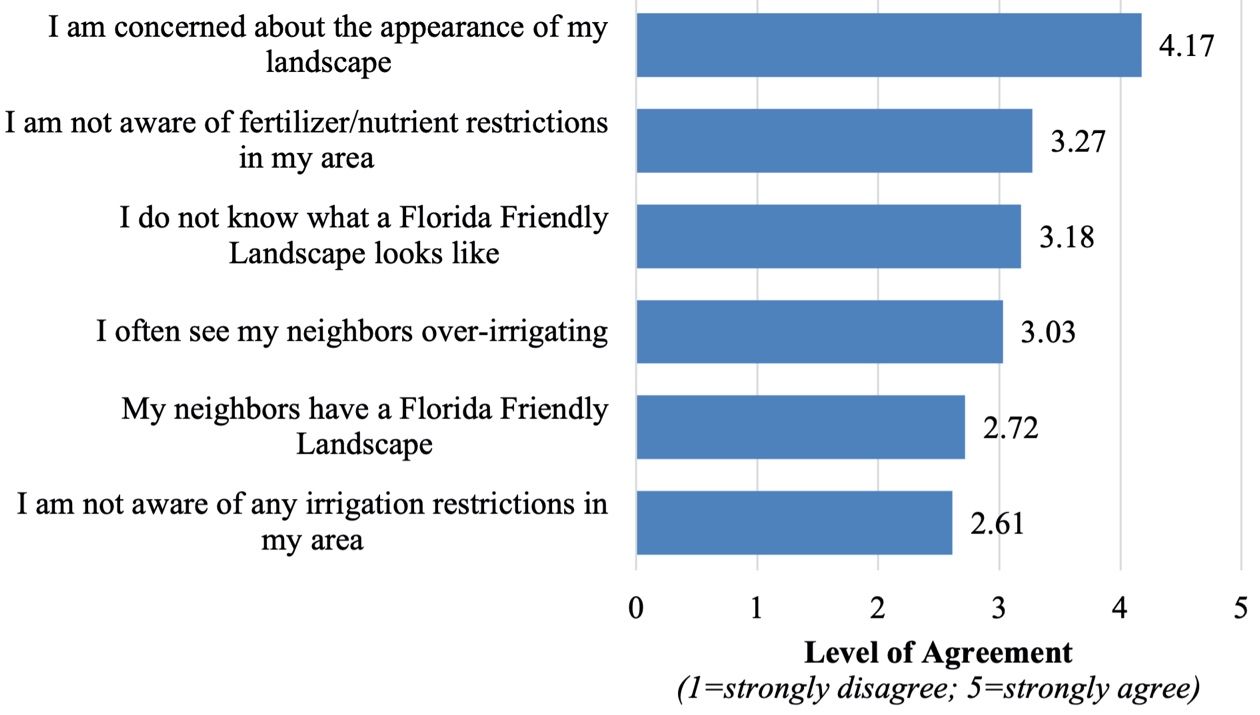
Figure 2. Participants’ level of agreement with statements about landscaping. Credits: UF/IFAS
Prior to the study, nearly 57.5% of the sample were aware of Florida-Friendly Landscapes while only 23% were aware of the Florida Water Star certification program and 22.6% were aware of the Florida Yards & Neighborhoods Program (Figure 3).
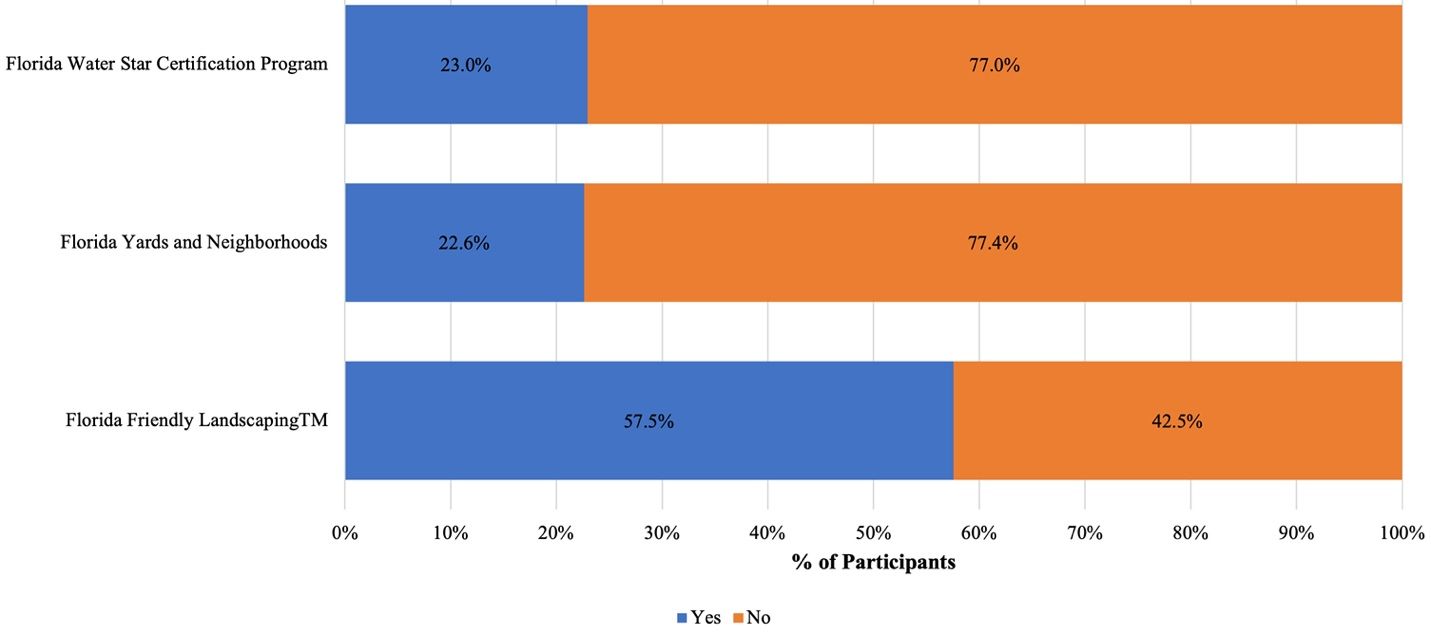
Figure 3. Participants’ awareness of environmentally friendly landscape programs in Florida. Credits: UF/IFAS
Perceptions of Florida-Friendly Landscapes
Participants rated 14 landscape-related characteristics of Florida-Friendly Landscapes when compared to conventional landscapes using a 7-point Likert scale (1=conventional landscapes are much better; 4=equal/no difference; 7=Florida-Friendly Landscapes are much better). Ratings for each statement are available in Table 1. Overall, Florida-Friendly Landscapes are perceived as more environmentally friendly than conventional landscapes when considering the environment as a whole, with potential wildlife benefits. Participants perceive Florida-Friendly Landscapes as requiring fewer inputs such as maintenance, irrigation, and fertilizer than conventional landscapes. Florida-Friendly Landscapes are rated higher than conventional landscapes for disease resistance, natural appearance, and right place. Conventional landscapes are more comparable to Florida-Friendly Landscapes for susceptibility to insect pests, aesthetics, formal appearance, price, property value improvement, and availability. Similar statements were grouped together to form variables. On average, Florida-Friendly Landscapes are rated better than conventional landscapes for all of the variables, with the environment variable receiving the highest rating, followed by low input, logistics, pests, aesthetics, and economic factors.
Table 1. Perceptions of conventional landscape and Florida-Friendly Landscape characteristics.
Note: Participants provided ratings for each statement indicating if it was more characteristic of a conventional landscape or a Florida-Friendly Landscape (1=conventional landscapes are much better; 4=no difference/equal; 7=Florida-Friendly Landscapes are much better).
General Knowledge
Participants indicated their level of knowledge about a variety of landscape-related topics (Figure 4). In general, participants are most knowledgeable about water conservation practices, followed by turf/plant care, local landscape regulations, and Florida-Friendly Landscapes. They are less knowledgeable about landscaping for wildlife/pollinators and soil information.
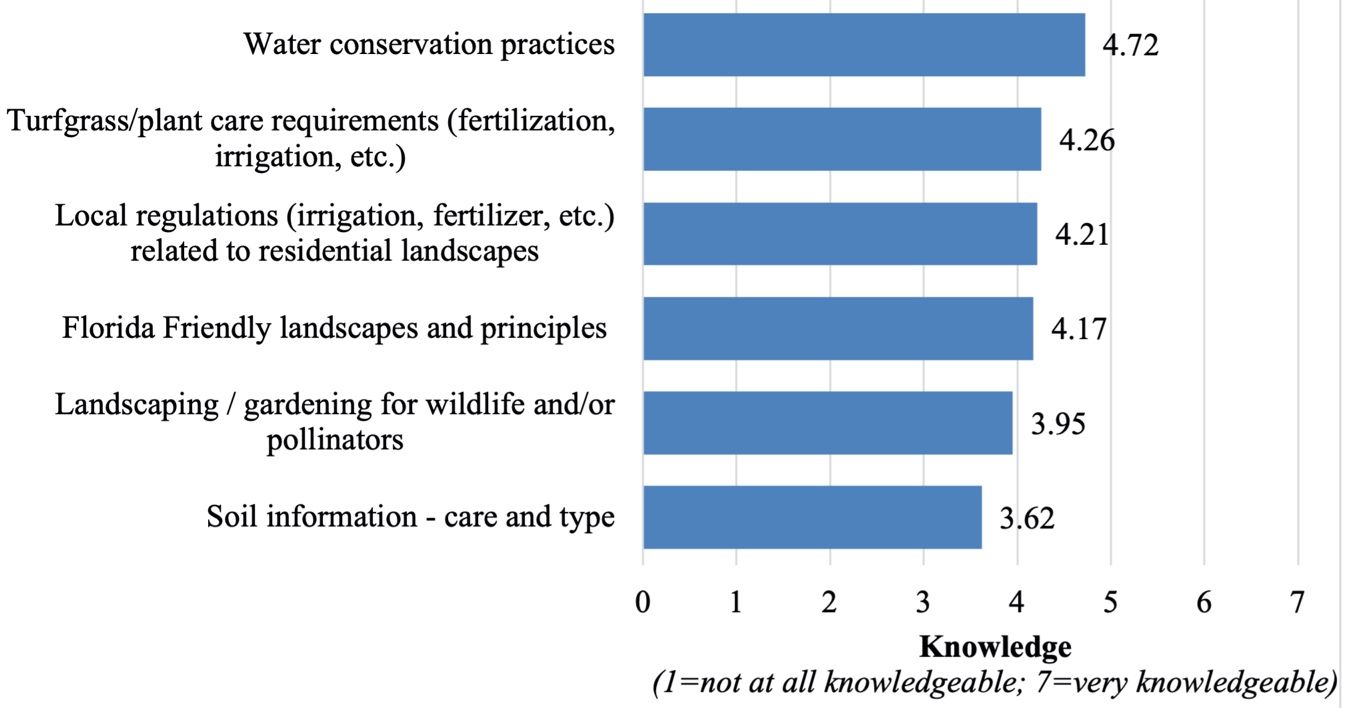
Figure 4. Homeowners’ level of knowledge for different landscape-related topics. Credits: UF/IFAS
Environmentally Friendly Landscape Purchase Likelihood
Participants were given two environmentally friendly landscape options and asked to indicate their likelihood of purchasing and installing one of the landscapes in the next five years (Figure 5). The two types of landscapes included a Waterwise Florida Landscape and a Florida-Friendly Landscape. For the Waterwise Florida Landscape, 39% of the sample are undecided, while 27% are unlikely (as indicated by selecting one of the unlikely ratings), and 24% indicate they would likely install or purchase in the next five years (as indicated by selecting one of the likely ratings).
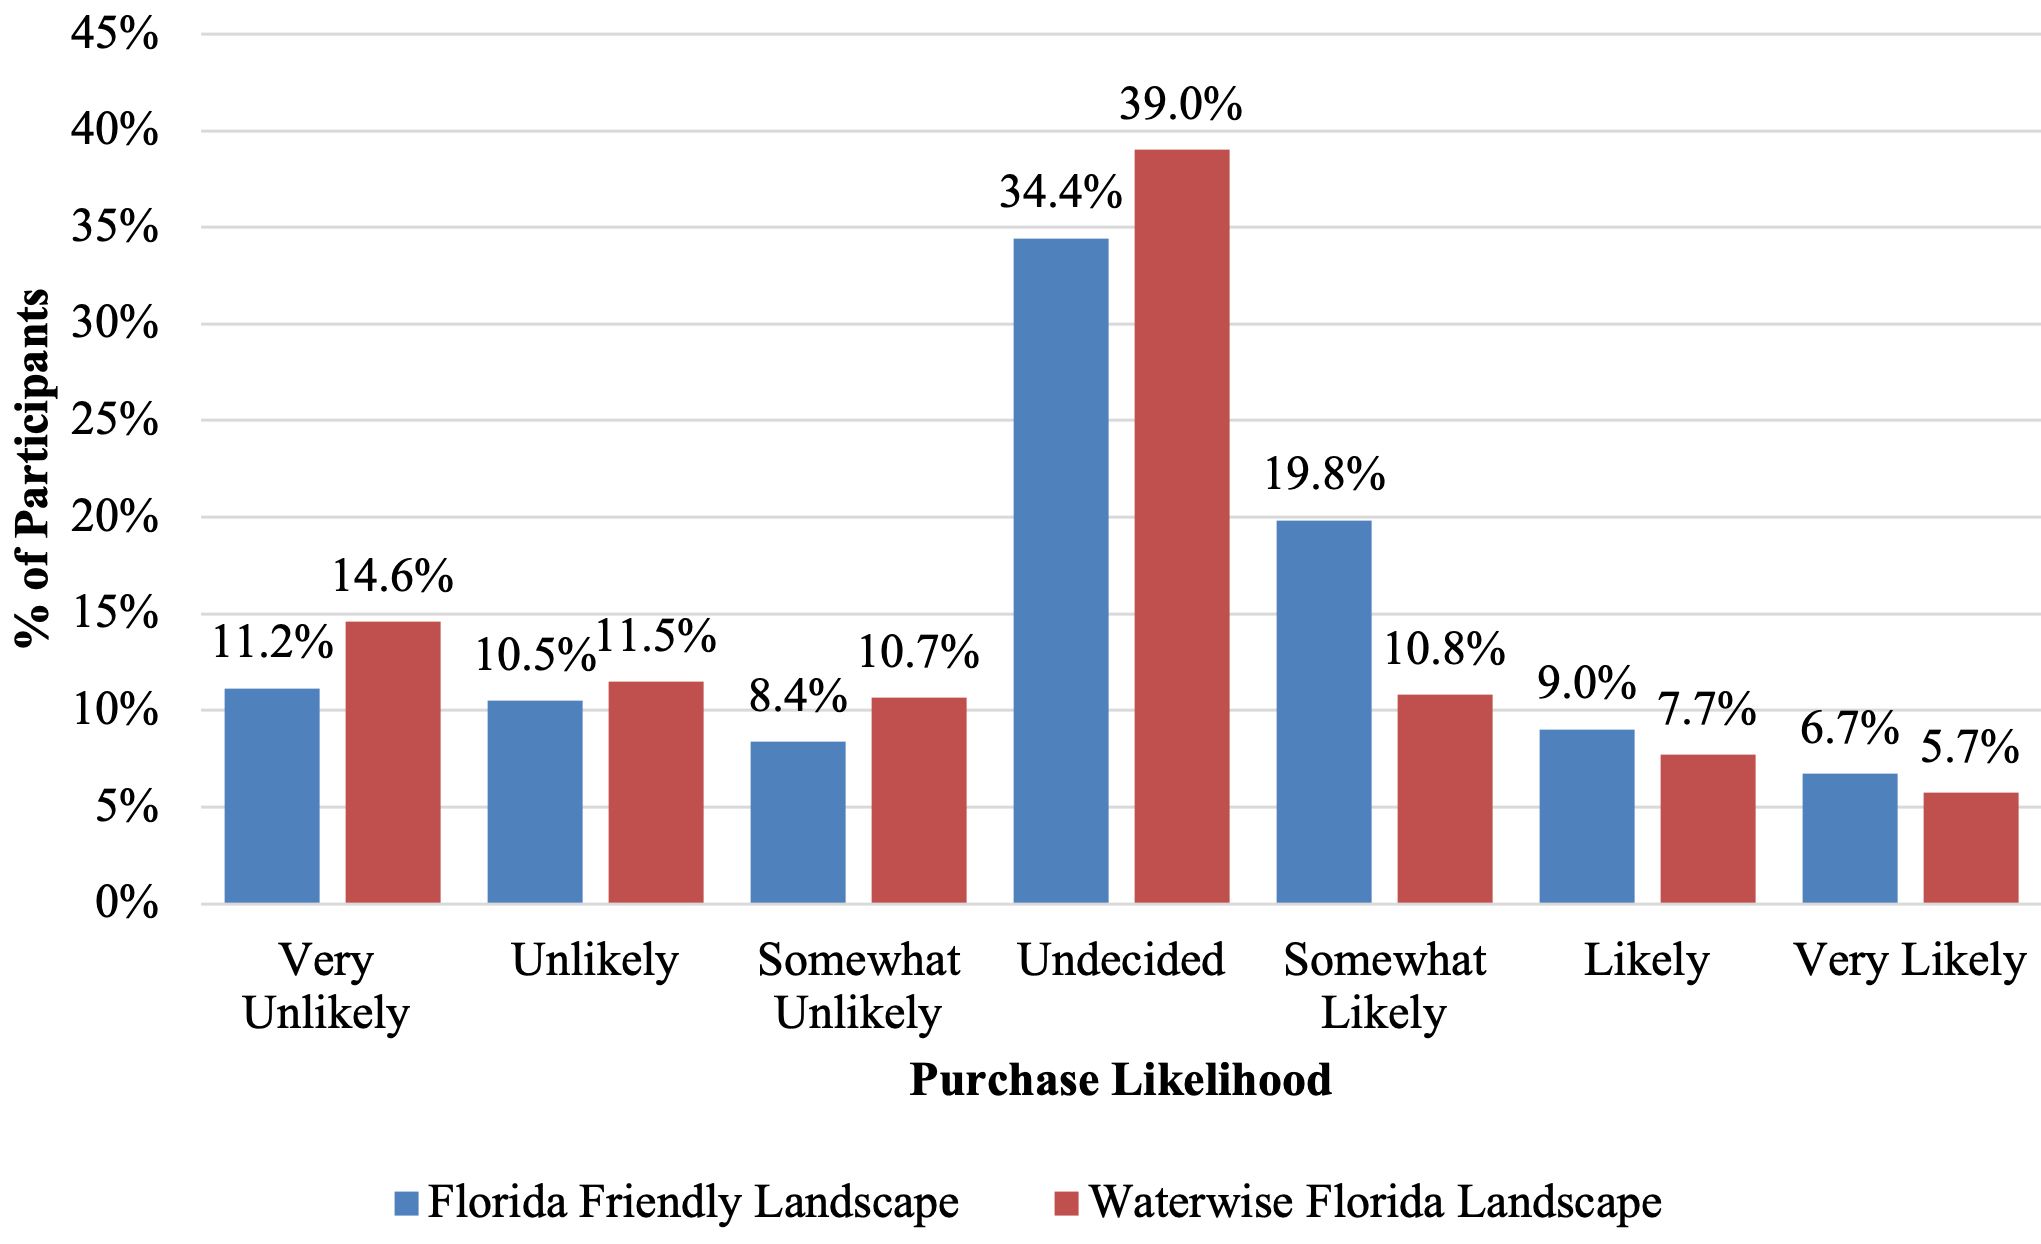
Figure 5. Respondents’ likelihood of purchasing/installing environmentally friendly landscapes in the next five years. Credits: UF/IFAS
Responses regarding purchasing and installing a Florida-Friendly Landscape in the next five years are similar to the responses for the Waterwise program. The largest portion of respondents (34%) indicate they are undecided, while 36% are somewhat likely to purchase/install a Florida-Friendly Landscape and 30% indicate they are at least somewhat unlikely to purchase/install a Florida-Friendly Landscape. The participants who indicate they are undecided or unlikely to install a Florida-Friendly Landscape were provided a list of potential barriers and asked to indicate which influenced their answers (Figure 6). Needing more information about Florida-Friendly Landscapes (selected by 53% of the subsample) and satisfaction with the existing landscape (52%) were the two main reasons. Thirteen percent indicate that Florida-Friendly Landscapes are expensive, while 7% state their HOA does not support Florida-Friendly Landscapes or that they already have a Florida-Friendly Landscape. Very few participants viewed Florida-Friendly Landscapes as marketing gimmicks, visually unattractive options, or landscapes with insufficient financial/environmental benefits.
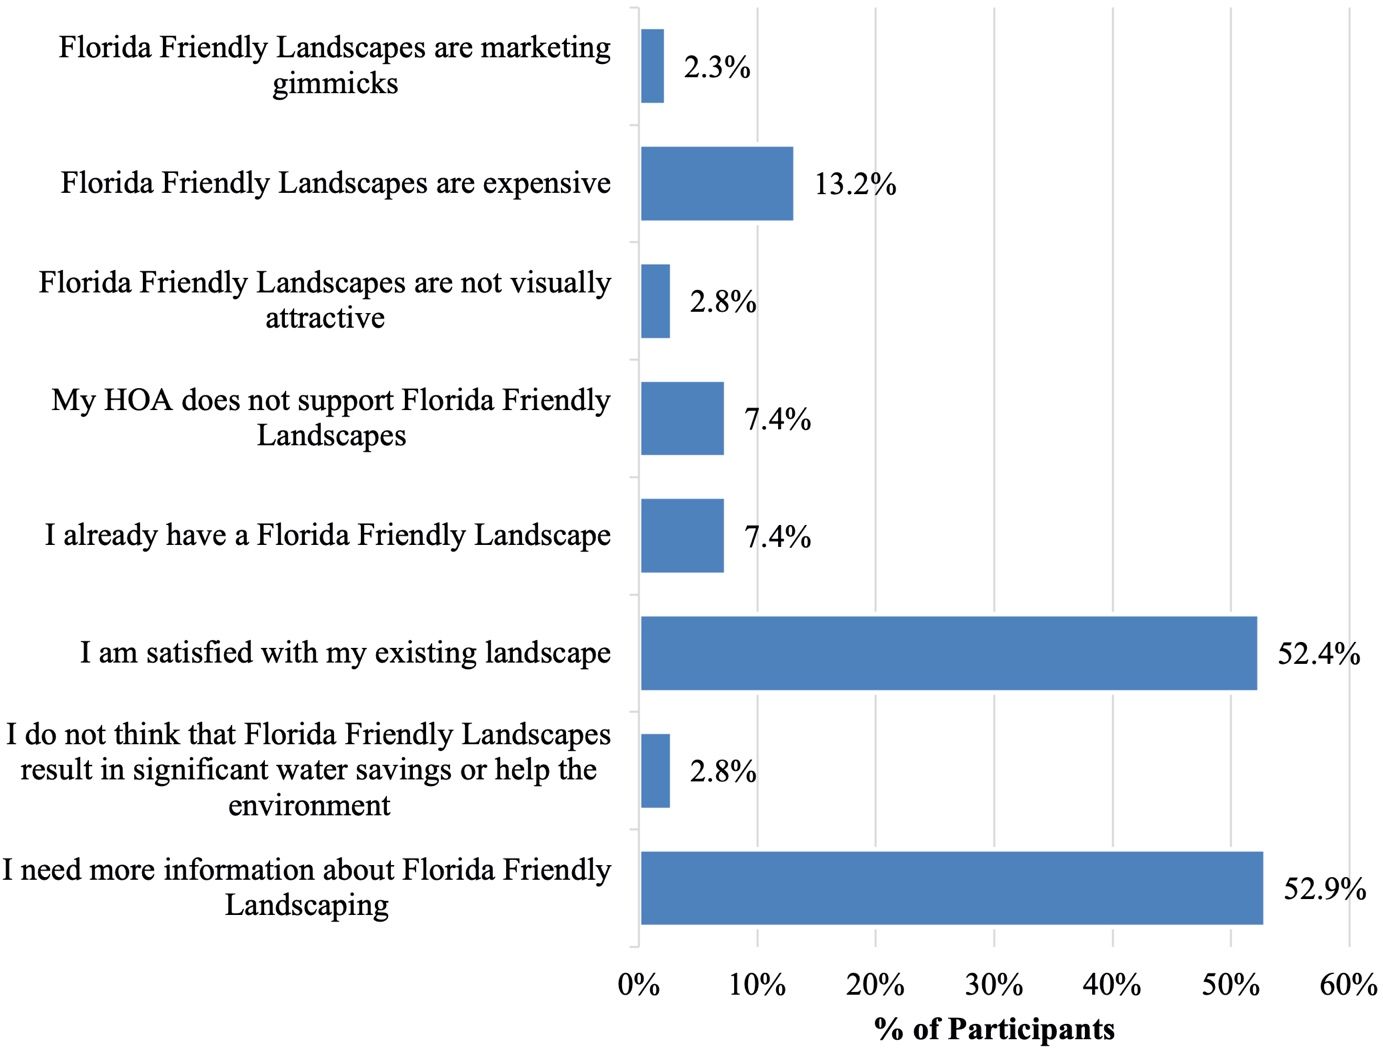
Figure 6. Respondents’ reasons for not purchasing/installing a Florida-Friendly Landscape in the next five years. Credits: UF/IFAS
Note: Only participants who were “unlikely” or “undecided” on whether they would purchase/install a Florida-Friendly Landscape in the next five years answered this question (n=393). Participants could “select all that apply,” meaning the percentages do not add up to 100%.
Ways to Encourage Installation of Florida-Friendly Landscapes
Participants suggested different strategies to encourage more homeowners to install Florida-Friendly Landscapes (Figure 7). The top strategies involve reducing the financial burden of installing a different landscape. Specifically, the top strategy is providing rebates, followed by tax deductions, reducing expenses, and more information on the financial benefits of Florida-Friendly Landscapes. The next highest-rated strategies include improved availability of Florida-Friendly Landscape plants and easier identification of Florida-Friendly plants in retail outlets. Participants indicate that they would respond favorably to more information about Florida-Friendly Landscape benefits and environmental impacts. Landscape ordinances reducing irrigation and turfgrass area could also positively impact Florida-Friendly Landscape installation but not as much as the previously discussed strategies. In general, participants indicated there is a need to reduce initial investment and a need to clearly mark Florida-Friendly plants in retail centers. Supporting evidence demonstrates that 54% of the respondents have never noticed in-store promotions emphasizing Florida-Friendly plants (Figure 8).
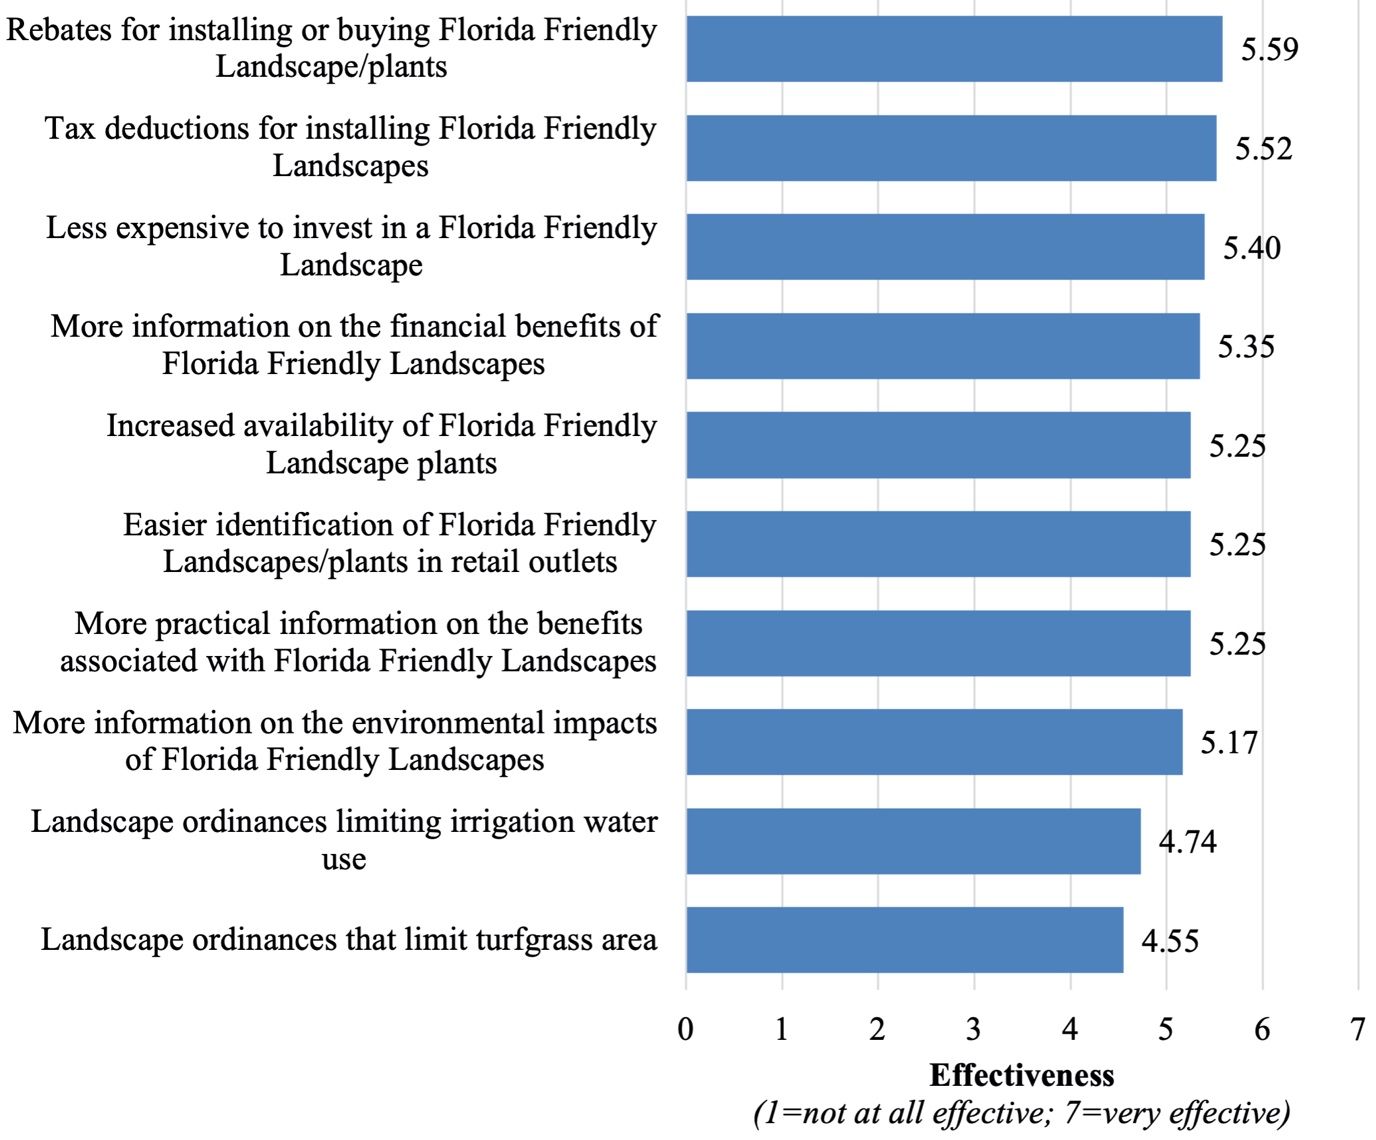
Figure 7. Factors to improve installation rates of Florida-Friendly Landscapes. Credits: UF/IFAS
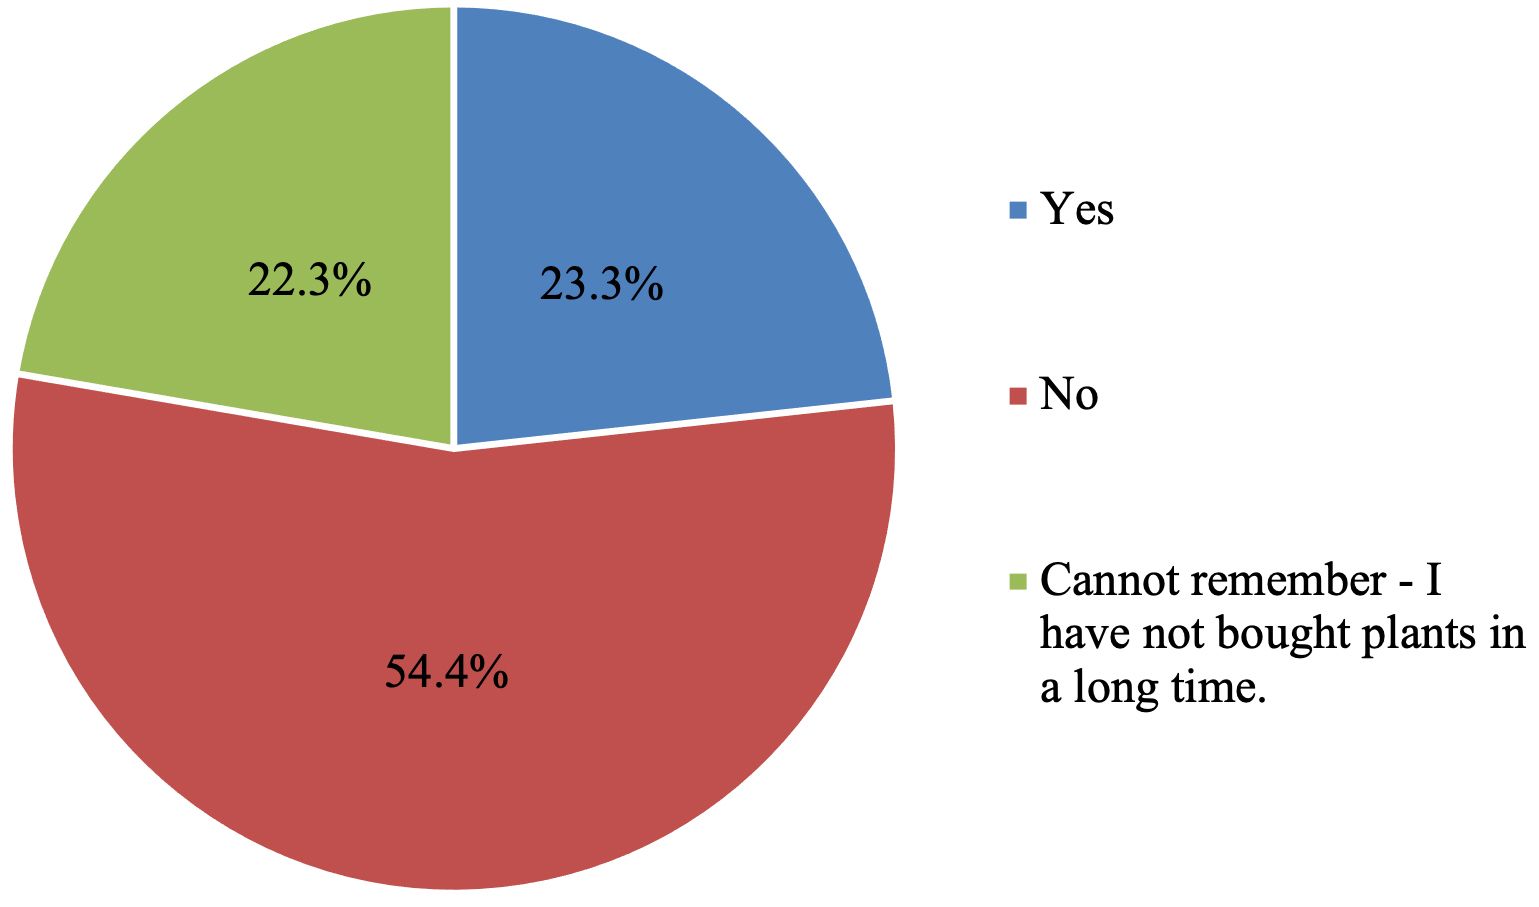
Figure 8. Percentages of participants who have noticed in-store promotions indicating that plants are Florida Friendly. Credits: UF/IFAS
Key Implications
- Landscape aesthetics are important to homeowners.
- Before the study, 58% of the sample were aware of Florida-Friendly Landscapes.
- Floridian consumers associate Florida-Friendly Landscapes with being more environmentally friendly and requiring fewer inputs than conventional landscapes.
- Homeowners are knowledgeable about water conservation practices, turf/plant care, and local landscape regulations.
- Consumers need more information about Florida-Friendly Landscapes to motivate them to install.
- Financial incentives are the primary means to encourage Floridians to install Florida-Friendly Landscapes.
- In-store promotions indicating plants and landscaping products that are classified as “Florida Friendly” would encourage consumers to select plants that align with FFL principles.
This report summarizes Floridian homeowners’ perceptions of sustainable landscapes, purchase intent, and factors that can influence their landscape purchasing decisions. Results are important to the landscaping industry, homeowner associations (HOAs), local regulators, and others interested in encouraging the installation of more environmentally friendly landscapes. Providing financial incentives (e.g., rebates, tax breaks, etc.) to decrease the expense of purchasing/installing Florida-Friendly Landscapes may encourage more homeowners to install environmentally friendly options. The last report of this series addresses financial incentives and how they impact Floridian homeowners’ preferences for more sustainable landscapes.
References
Hall, C. R., and M. W. Dickson. 2011. “Economic, Environmental, and Health/Well-Being Benefits Associated with Green Industry Products and Services: A Review.” Journal of Environmental Horticulture 29(2): 96–103.
Hall, C. R., and M. J. Knuth. 2019a. “An Update of the Literature Supporting the Well-Being Benefits of Plants: A Review of the Emotional and Mental Health Benefits of Plants.” Journal of Environmental Horticulture 37(1): 30–38.
Hall, C. R., and M. J. Knuth. 2019b. “An Update of the Literature Supporting the Well-Being Benefits of Plants: Part 2: Physiological Health Benefits.” Journal of Environmental Horticulture 37(2): 63–73.
Nowak, D. J., S. M. Stein, P. B. Randler, E. J. Greenfield, S. J. Comas, M. A. Carr, and R. J. Alig. 2010. Sustaining America’s Urban Trees and Forests. United States Department of Agriculture, Forest Service, General Technical Report NRS-62.
Suh, D. H., H. Khachatryan, A. Rihn, and M. Dukes. 2017. “Relating Knowledge and Perceptions of Sustainable Water Management to Preferences for Smart Irrigation Technology.” Sustainability 9(4): 1–21.
U.S. Census Bureau. 2015. “2010 Census Urban and Rural Classification and Urban Area Criteria.” Accessed on July 16, 2018. https://www.census.gov/programs-surveys/geography/guidance/geo-areas/urban-rural/2010-urban-rural.html
Yue, C., K. Hugie, and E. Watkins. 2012. “Are Consumers Willing to Pay More for Low-Input Turfgrasses on Residential Lawns? Evidence from Choice Experiments.” Journal of Agricultural and Applied Economics 44(4): 549–560.


