Florida Pest Management Industry Economic Contributions Report
Introduction
This report summarizes the economic contributions of Florida’s pest management industry in 2020. The target audience of the report includes pest management industry stakeholders who will be able to use this information in communicating the relevance and economic impact of the Florida pest management industry. According to the U.S. Bureau of Labor Statistics (US-BLS), the Florida pest management industry is one of the nation’s leading pest control and extermination service industries, with a total employment of 18,728, accounting for more than 14 percent of the industry’s establishments in 2021. It should be noted, however, that the US-BLS figures are considerably lower than the employment figures from other sources although the data collection methods of the other sources are not clearly described. So the following analysis should be considered as a conservative estimate of the pest management industry’s economic contributions.
The main services provided by the Florida pest management industry include and are not limited to insect extermination and control, bedbug extermination, mosquito control, termite extermination and control, and rodent control and extermination. During the past decade, the market share concentration of the Florida pest management industry has increased due to consolidation within the industry. However, the general concentration within the industry stays relatively low, and the majority of the operators are midsize and small, and strategically located near densely populated areas.
Employment in the pest control industry in Florida somewhat fluctuated between 2000 and 2010, ranging from 12,653 to 13,794 jobs. However, the positive trend has been steady since the end of the Great Recession (2007–2010) (Figure 1). Compared to the pre-recession conditions (13,763 jobs), the employment in the industry increased by 31 percent to over 17,000 jobs by 2020. As shown in Figure 2, the trend in total wages followed a similar pattern, increasing from $472 million in 2007 (pre-recession) to $811 million in 2020. Compared to 2007, the number of establishments in Florida increased by 27 percent (Figure 3). In summary, this industry is in the growth stage of its life cycle, with relevant indicators such as an increasing number of companies and establishments, growing employment, and expanding revenue.
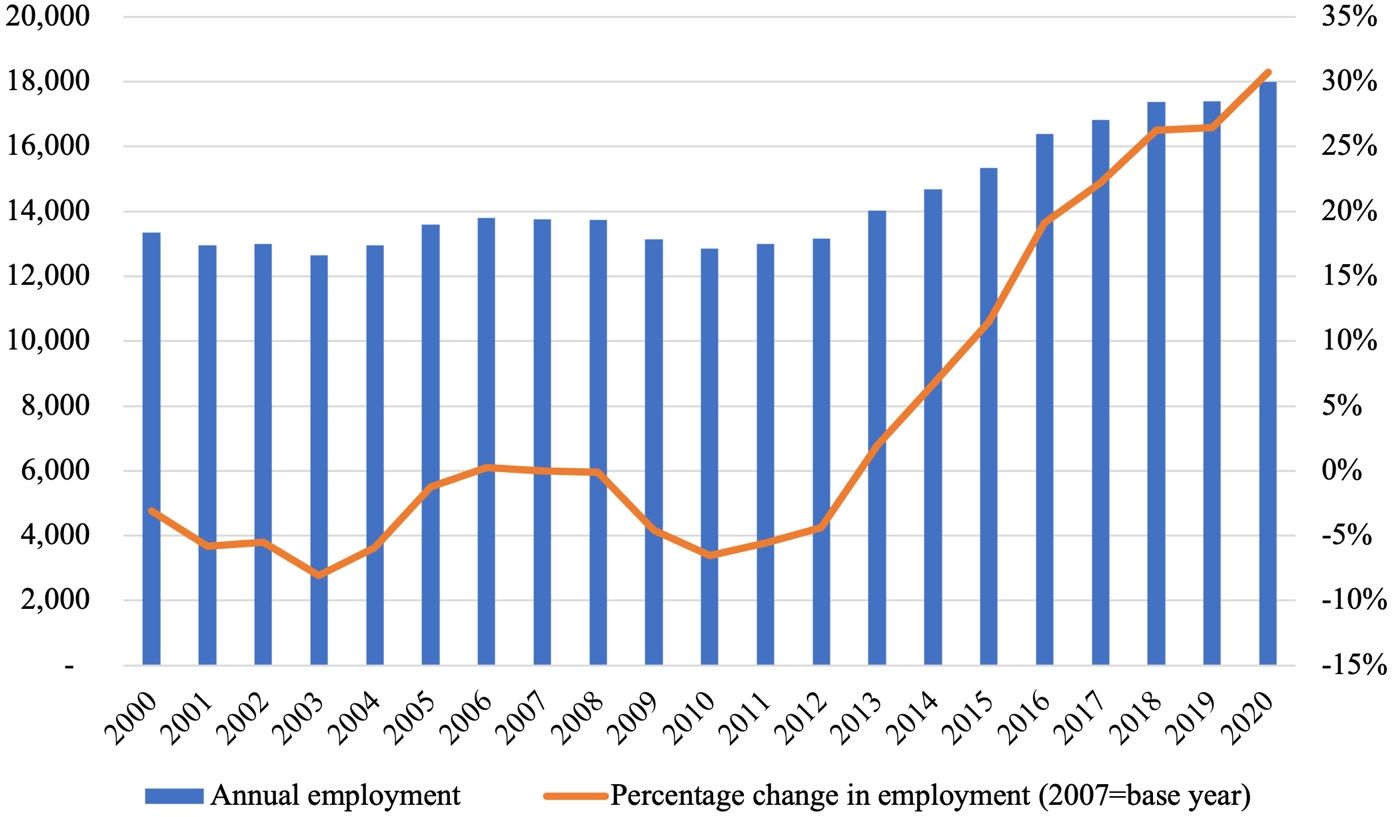
Credit: U.S. Bureau of Labor Statistics, Quarterly Census of Employment and Wages
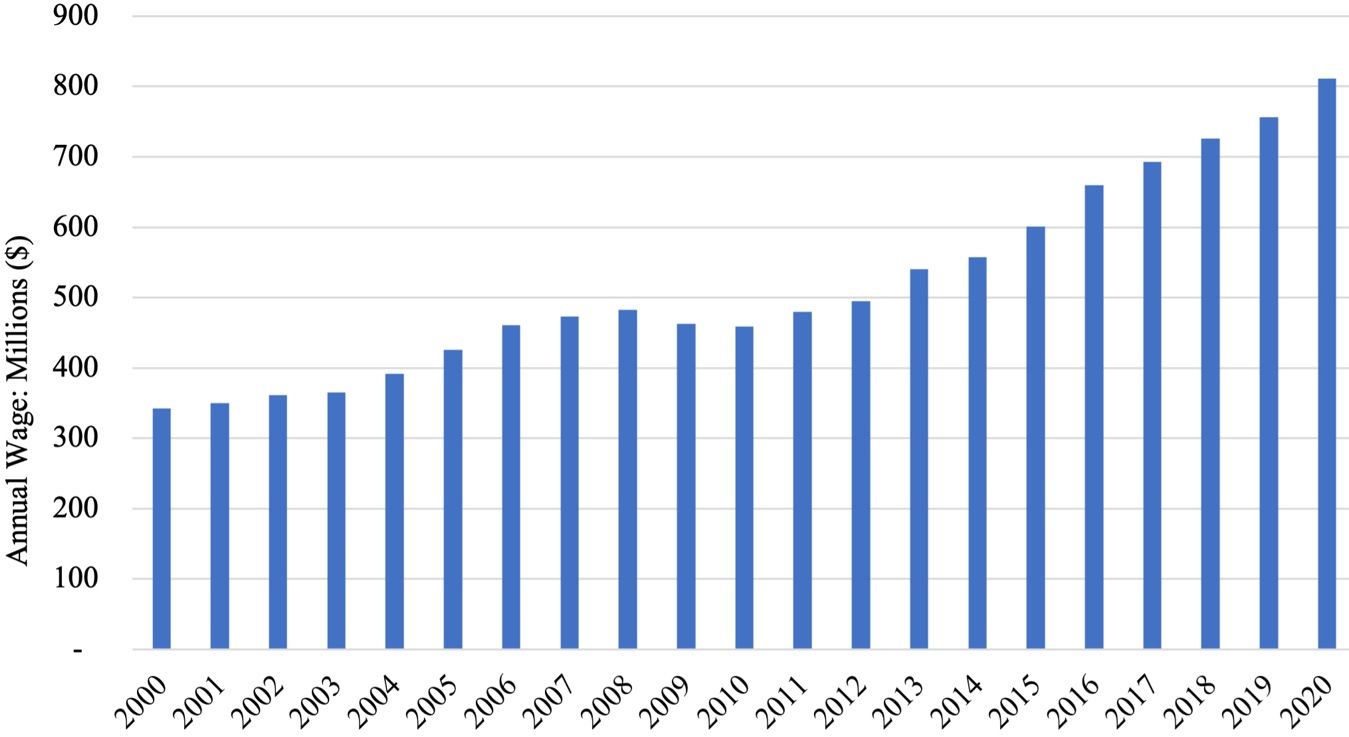
Credit: U.S. Bureau of Labor Statistics, Quarterly Census of Employment and Wages
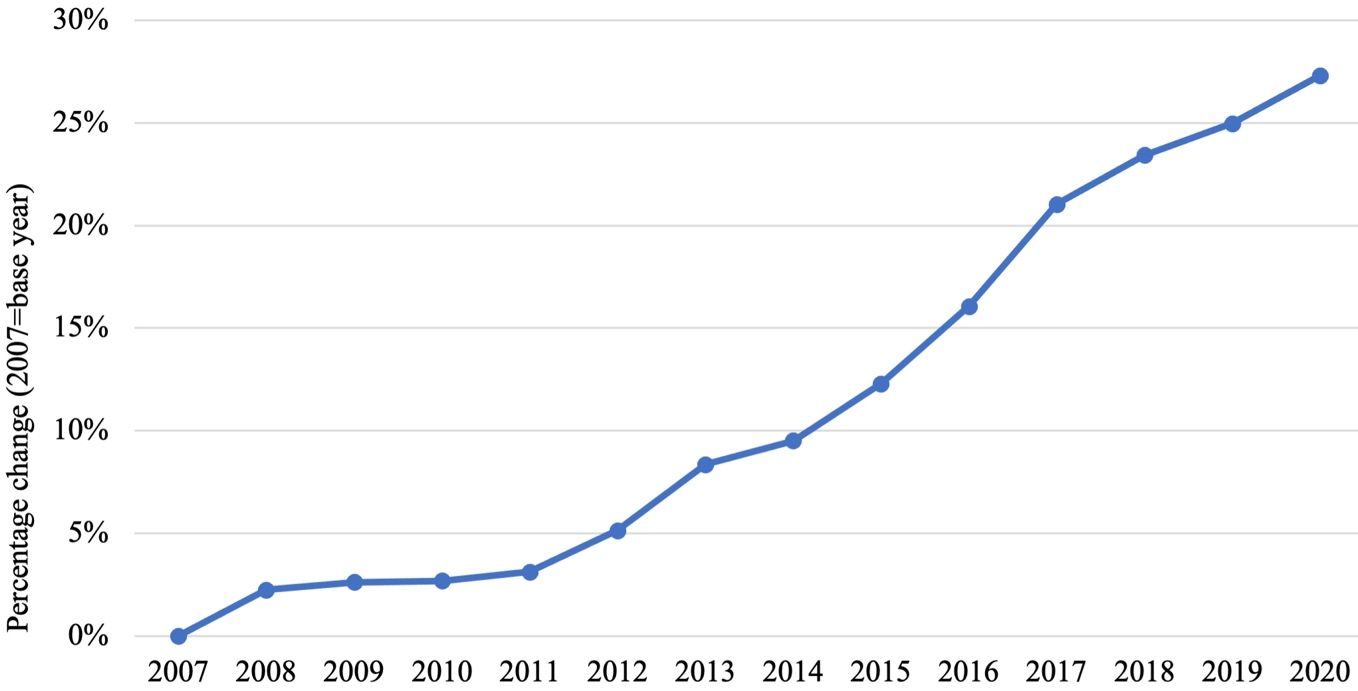
Credit: U.S. Bureau of Labor Statistics, Quarterly Census of Employment and Wages
To estimate economic contributions of the Florida pest management industry for the most recent fiscal year, survey questionnaires were sent to over 3,500 pest control firms. A total of 764 firms responded to the survey, resulting in a 22 percent response rate. The majority of the participating firms (80.6%) reported primary involvement in pest control services and 543 (72%) indicated that they were involved in pest control services exclusively. An economic contribution analysis was then conducted using the IMPLAN© regional economic modeling system and associated databases (Implan Group, LLC 2020).
In this report, the methodology for economic contribution analysis is first summarized. Secondly, the industry survey summary statistics are provided. Next, the overall economic contributions of the Florida pest management industry by major industry group and by county are reported. Lastly, this report includes an appendix of technical terminology used throughout the report.
Methodology for Reginal Economic Contribution Analysis
An economic contribution analysis for the Florida pest management industry was conducted using the IMPLAN© regional economic modeling system and associated databases (Implan Group, LLC 2020). Regional economic models describe the specific mix of industries and institutions that make up a regional economy, including the transactions that occur between industries, employees, households, and governments. The models account for industrial output; employment; value added; commodity production and consumption; personal income; household and institutional spending; domestic and foreign trade; wholesale, retail, and transportation margins; business inventories; capital investment; taxes; and transfer payments such as welfare and retirement pensions. Economic multipliers (direct, indirect, and induced effects) were used to estimate the total amount of activity supported throughout an economy resulting from one or more specific activities, or, as in this case, from the activity within a specific sector. The IMPLAN© software automatically imputed employee compensation and proprietor income associated with the industry output value entered based on the average output per metric of interest ratio for the Services to Buildings sector (IMPLAN sector 476).
This analysis of the Florida pest management industry follows the current best practices for determining the total value of economic activity that is required of all Florida industries in support of Florida pest management industry-related expenditures, or, more precisely, the total economic contributions of the Florida pest management industry. Economic multipliers are useful for estimating the total amount of activity supported throughout an economy resulting from one or more specific activities, or, as in this case, from the activity within a specific sector. There are three components of multipliers: direct, indirect, and induced effects. Direct effects represent the level of economic activity within the industry in question, indirect effects represent economic activity supported through inter-industry transactions or the purchase of input goods and services, and induced effects represent activity resulting from local spending of income by employee and proprietor households. In this context, direct economic contributions represent the estimated level of economic activity associated with the pest management industry. Direct economic contributions were determined by both the survey conducted as part of this project and the IMPLAN© database for the State of Florida. Indirect economic contributions represent the economic activity supported throughout multiple rounds of supply chain spending as the pest management industry and other indirectly supported industries purchase input goods and services to satisfy demand for their products or services. Induced economic contributions represent the economic activity associated with the local spending of income by employee and proprietor households employed by the pest management industry and other indirectly supported industries. Total economic contributions are simply the sum of direct, indirect, and induced economic contributions. Direct, indirect, induced, and total economic contributions can be measured by several metrics, including employment (fulltime and part-time jobs, excluding H2-A certified employees), labor income (wages, salaries, benefits, business owner income), value added, industry output (sales revenues) and business taxes paid. Value added is equivalent to Gross State Product (GSP) or Gross Domestic Product (GDP) at the national level and is generally considered a better measure of economic activity because it nets out the value of inter-industry purchases. A glossary of basic definitions of the technical terms used in this report are provided in the appendix.
Industry Survey Summary Statistics
The following section discusses summary statistics of the 2021 Florida Pest Management Industry Survey. Survey questionnaires were sent to over 3,500 pest control firms and a total of 764 firms responded to the survey, resulting in a 22 percent response rate. The final sample size was 752 firms after removing 12 firms commenting that the survey did not apply to their businesses. As shown in Table 1, the majority of participating firms (80.6%) reported involvement in pest control services and 543 (72%) indicated involvement with pest control services only. Thirty-four firms (4.5%) selected allied services, and 104 firms (13.8%) selected the “other business” category (Figure 4). Firms responding to the survey spread across 51 Florida counties (Table 2). Forty-six firms (6.96% of the sample) were in Palm Beach County, followed by 44 firms in Hillsborough County (6.67%), 40 firms in Broward and Lee counties (6.1% each), 39 firms in Pinellas County (5.9%), and 36 firms in Duval and Orange counties (5.45% each).
Table 1. Number of respondents to the 2021 Florida Pest Management Industry Survey.
Table 2. Number of firms by county that participated in the 2021 Florida Pest Management Industry Survey
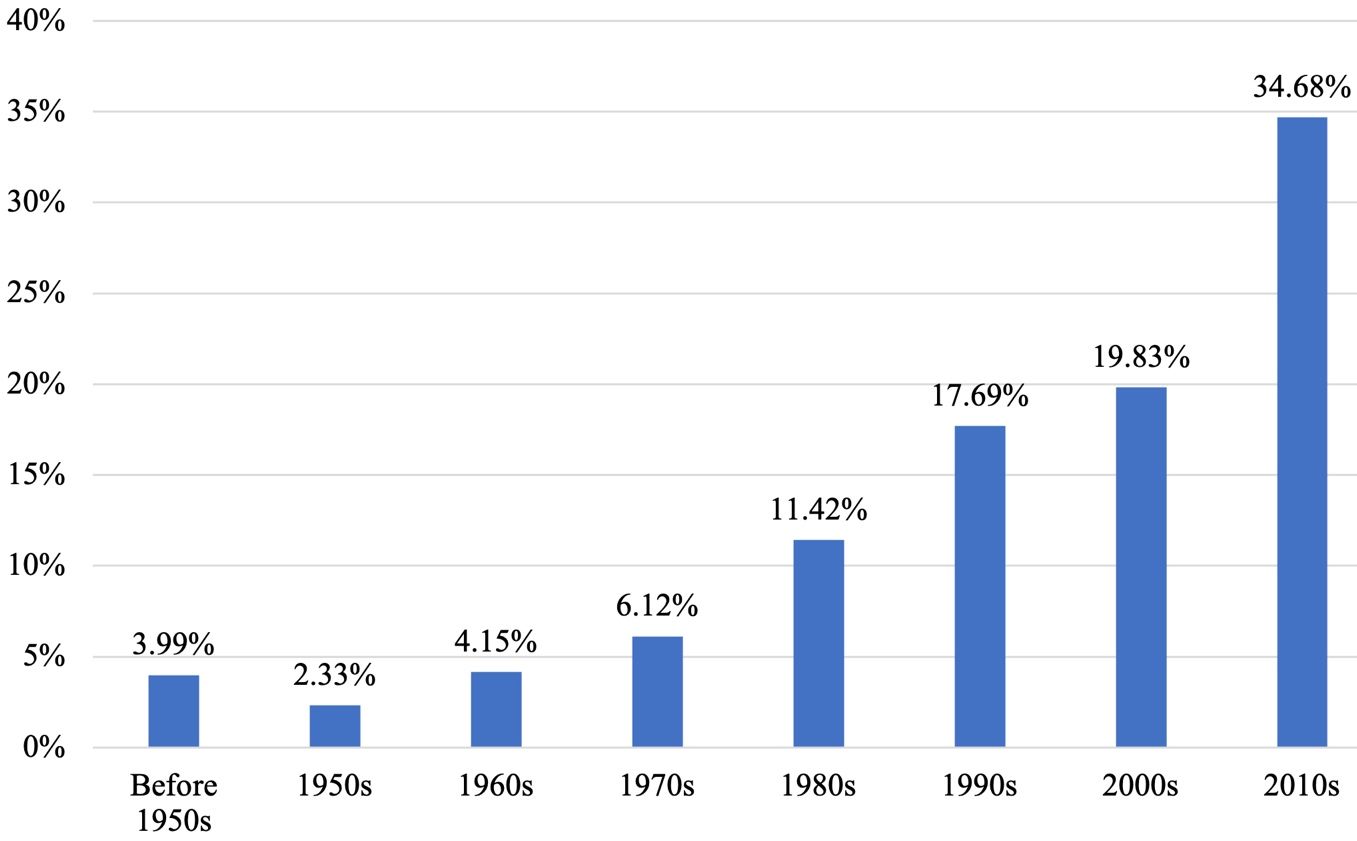
The average age of surveyed firms was approximately 24 years, with the majority of the firms being established since the 1980s. Particularly, roughly 18 percent of the firms were established in the 1990s, 20 percent of the firms were established in the 2000s, and 35 percent of the firms were established after the 2007–2009 economic recession, indicating a fast growth of the pest management industry in the last decade (Figure 4). Information was collected about the market segments to which the surveyed firms provided services. As shown in Table 3, roughly 73 percent of the pest management services were provided to residential homes, and 23 percent were provided to commercial establishments.
Credit:
Table 3. Service market segments in the 2021 Florida Pest Management Industry Survey.
Summary of Economic Contributions
Inputs to IMPLAN© for analysis of the Florida pest management industry, informed by both the survey conducted as part of this project and the IMPLAN© database for the State of Florida, are summarized in Table 4. Total direct output or sales revenue in the pest management industry used in the analysis was $1.325 billion, and direct employment was 17,665 jobs. The imputed values of employee compensation and proprietor income were $438.63 million and $71.24 million, respectively. The software also applied industry-specific deflators to express output in 2020 values. State-level results were allocated to individual Florida counties in proportion to direct employment in the pest management component of the Services to Buildings sector based on IMPLAN software.
Table 4. IMPLAN© events for economic contribution analysis of the pest management industry in Florida, 2020.
Economic multipliers estimate the economic activity that occurs in other sectors of the economy through the industry supply chain (indirect effects) and re-spending by employee households and governments (induced effects). The estimated total economic contributions were 26,637 fulltime and part-time jobs, $958.7 million in labor income (wages, salaries, benefits, proprietor income), $1.437 billion in value added or Gross Domestic Product (GDP), and $2.718 billion in industry output or revenues, including all direct, indirect, and induced regional multiplier effects (Table 5).
Table 5. Summary of economic contributions of pest management industry in Florida, 2020.
Overall economic contributions of the Florida pest management industry by major industry groups defined according to the North American Industry Classification System (NAICS) are shown in Table 6. The largest industry groups in terms of employment contributions were administrative and waste services (19,257 jobs); retail trade (953 jobs); health and social services (893 jobs); other services (817 jobs); and professional, scientific, and tech services (793 jobs); as well as several other industries with over 500 jobs supported including accommodation and food services, real estate and rental, finance and insurance, and transportation and warehousing. In terms of value-added contributions, the largest industry group was administrative and waste services with $572 million; followed by professional, scientific, and tech services ($58 million); and health and social services ($55 million). It is expected that administrative and waste services is among the largest economic contributors because pest management services are a component of this group.
Table 6. Economic contributions by major industry group for the Florida pest management industry in the State of Florida, 2020.
State/local and federal tax contributions of the Florida pest management industry in 2020 are shown in Table 7. Note that this is a more comprehensive accounting of all personal taxes as well as the business taxes on production and imports at the state/local and federal levels. Total tax contributions amounted to $295.83 million, including state/local tax contributions of $77.99 million and federal tax contributions of $217.84 million. The largest state/local tax items were sales tax ($37.22 million) and property tax ($25.36 million), while the largest federal tax items were personal income tax ($92.37 million), and social insurance or “social security” payroll tax, including both the employee contribution ($58.08 million) and employer contribution ($48.85 million).
Table 7. State/local and federal tax contributions supported by the Florida pest management industry in the State of Florida in 2020.
A summary of the economic contributions of the Florida pest management industry by county is provided in Table 8. The top ten counties in terms of total employment contributions were Miami-Dade (3,754 jobs), Broward (2,855 jobs), Orange (1,927 jobs), Palm Beach (1,794 jobs), Hillsborough (1,639 jobs), Duval (1,313 jobs), Pinellas (1,220 jobs), Lee (1,050 jobs), Collier (807 jobs), and Sarasota (675 jobs). The top ten counties in terms of total value-added contributions were Miami-Dade ($183 million), Broward ($154 million), Orange ($121 million), Palm Beach ($109 million), Hillsborough ($99 million), Duval ($82 million), Lee ($68 million), Pinellas ($67 million), Collier ($52 million), and Sarasota ($46 million). The location of these activities and the resulting county-level estimates are likely driven by the significant level of demand for pest management services in major urban areas.
Table 8. Summary of economic contributions of the pest management industry in Florida regions and counties in 2020.
Conclusion
This study used Internet surveys to collect data on industry sales, business expenses, employment, and marketing practices in 2020 from owners and managers in the Florida pest control industry. Total industry employment and sales data from secondary sources were also utilized for the economic contribution analysis. Regional input-output economic models were used to estimate the total economic contributions of the industry at the state and county levels. The Florida pest control industry has significant indirect and induced impacts on other sectors of the state’s economy due to the continuous demand from both residential and commercial clients. Following the population density, economic activity in the pest control sector in Florida tends to be concentrated in urbanized areas. Consequently, four out of the nine economic regions in Florida, including Miami-Fort Lauderdale, Orlando, Sarasota-Bradenton, and Tampa-St. Petersburg accounted for approximately 85% of the pest control industry’s economic contributions (specifically, in terms of total output and value-added contributions).
References
IMPLAN Group, LLC. IMPLAN© economic impact analysis and social accounting software, and regional economic data for the State of Florida. Huntersville, NC, 2020. http://www.implan.com/
U.S. Bureau of Labor Statistics (US-BLS). Quarterly Census of Employment and Wages, available at http://www.bls.gov/cew/data.htm.
Appendix: Glossary of Economic Impact Terms
Contributions (economic) are the gross changes in a region’s economy that can be attributed to a given industry, event, or policy.
Direct effects/impacts represent the revenues, value added, income, or jobs that result directly from an economic activity within a regional economy.
Employee compensation is comprised of wages, salaries, commissions, and benefits such as health and life insurance, retirement, and other forms of cash or non-cash compensation.
Employment is a measure of the number of jobs involved, including fulltime, part-time, and seasonal positions. It is not a measure of fulltime equivalents.
Exports are sales of goods to customers outside the producing region, which represent a net inflow of money to the region. This also applies to sales of services to customers visiting from other regions.
Final demand represents sales to final consumers, including households and governments, and exports from the region.
Gross Regional Product is a measure of total economic activity in a region, or total income generated by all goods and services. It represents the sum of total value added by all industries in that region, and is equivalent to Gross Domestic Product for the nation.
IMPLAN is a computer-based input-output modeling system that enables users to create regional economic models and multipliers for any region consisting of one or more counties or states in the United States.
Impact or total impact is the change in total regional economic activity (e.g., output or employment) resulting from a change in final demand, direct industry output, or direct employment, estimated based on regional economic multipliers.
Imports are purchases of goods and services originating outside the region of analysis.
Income is the money earned within the region from production and sales. Total income includes labor income such as wages, salaries, employee benefits, and business proprietor income, plus other property income.
Indirect effects or impacts occur when businesses use revenues originating from outside the region or study area to purchase inputs (goods and services) from local suppliers. This secondary or indirect business generates additional revenues, income, jobs, and taxes for the area economy.
Induced effects or impacts occur when new dollars, originating from outside the study area, are introduced into the local economy. Induced economic impacts occur as the households of business owners and employees spend their earnings from these enterprises to purchase consumer goods and services from other businesses within the region. This induced effect generates additional revenues, income, jobs, and taxes for the area economy.
Indirect business taxes are taxes paid to governments by individuals or businesses for property, excise, and sales taxes. These do not include income taxes.
Input-Output (I-O) model and Social Accounting Matrix (SAM) are representations of the transactions between industry sectors within a region. They capture what each sector purchases from every other sector in order to produce its output of goods or services. Using such a model, flows of economic activity associated with any change in spending may be traced backwards through the supply chain.
Intermediate sales are sales to other industrial sectors. The value of intermediate sales is netted-out of total value added.
Labor income refers to all forms of employment compensation, including employee wages and salaries, and proprietor income or profits.
Local revenues/expenditures represent simple transfers between individuals or businesses within a regional economy. These transactions do not generate economic spin-off or multiplier (indirect and induced) effects.
Margins represent the portion of the purchaser price accruing to the retailer, wholesaler, and producer/manufacturer in the supply chain. Typically, only the retail margins of many goods purchased by consumers accrue to the local region because the wholesaler, shipper, and manufacturer often lie outside the local area.
Market share concentration measures the extent to which market shares are concentrated between a small number of firms. It is often taken as a proxy for the intensity of competition.
Multipliers capture the total effects, both direct and secondary, in a given region, generally as a ratio of the total change in economic activity in the region relative to the direct change. Multipliers are derived from an I-O model of the regional economy. Multipliers may be expressed as ratios of sales, income, or employment, or as ratios of total income or employment changes relative to direct sales. Multipliers express the degree of interdependency between sectors in a region's economy and therefore vary considerably across regions and sectors.
- A sector-specific multiplier gives the total changes to the economy associated with a unit change in output or employment in a given sector (i.e., the direct economic effect) being evaluated.
- Indirect effects multipliers represent the changes in sales, income, or employment within the region in backward-linked industries supplying goods and services to businesses (e.g., increased sales in input supply firms resulting from more nursery industry sales).
- Induced effects multipliers represent the increased sales within the region from household spending of the income earned in the direct and supporting industries for housing, utilities, food, etc.
- An imputed multiplier is calculated as the ratio of the total impact divided by direct effect for any given measure (e.g., output, employment).
Other property income represents income received from investments, such as corporate dividends, royalties, property rentals, or interest on loans.
Output is the dollar value of a good or service produced or sold and is equivalent to sales revenues plus changes in business inventories.
Output-consumption ratio is the total industry output divided by the apparent consumption for any given commodity or industry and is a measure of the degree to which local demands are met by local production.
Producer prices are the prices paid for goods at the factory or point of production. For manufactured goods, the purchaser price equals the producer price plus a retail margin, a wholesale margin, and a transportation margin. For services, the producer and purchaser prices are equivalent.
Proprietor income is income received by non-incorporated private business owners or self-employed individuals.
Purchaser prices are the prices paid by the final consumer of a good or service.
Region defines the geographic area for which impacts are estimated, usually an aggregation of several counties defined on the basis of worker commuting patterns.
Sector is an individual industry or group of industries producing similar products or services, or with similar production processes. Sectors are classified according to the North American Industrial Classification System (NAICS).
Value added is a broad measure of income, representing the sum of employee compensation, proprietor income, other property income, indirect business taxes, and capital consumption (depreciation). Value added is a commonly used measure of the contribution of an industry to a regional economy because it avoids double counting of intermediate sales. Total value added across all industries is equivalent to Gross Regional Product.