This publication is part of a series titled Soil Phosphorus Storage Capacity (SPSC) for Phosphorus Risk Assessment and Management. The series is intended for use by soil scientists, environmental consultants, state agency personnel, Extension faculty, and others who are interested in management practices and policies that minimize the risk of phosphorus loss from soils.
Introduction
The purpose of this publication is to explain the role of soil in the long-term contribution of manure phosphorus (P) from agricultural lands to south Florida's Lake Okeechobee. This publication discusses both Spodosols (the soil series that comprises more than half of the soils in the Lake Okeechobee watershed) and the impact of manure from dairy farms (a major P source in the watershed). It also addresses the applicability of a recently developed procedure to evaluate a soil's potential to negatively impact water quality through P release from the soil (for more information, see the EDIS publication SL336/SS541 Understanding Soil Phosphorus Storage Capacity; https://edis.ifas.ufl.edu/ss541). The information in this publication is useful to soil scientists, environmental consultants, state agency personnel, Extension faculty, and others interested in the fate of dairy manure-derived P residing in soils in the Lake Okeechobee watershed.
Soils of the Lake Okeechobee Watershed
Some typical Spodosol soil series are Myakka (sandy, siliceous, hyperthermic Aeric Alaquod), Immokalee (sandy, siliceous, hyperthermic Arenic Alaquod), and Pomello (sandy, siliceous, hyperthermic Oxyaquic Alorthod). The major feature of a Spodosol is a spodic (Bh) horizon (Figure 1). The name of the soil series is determined in part by the depth to the spodic horizon. The upper boundary of the Bh horizon is 50–75 cm deep in a Myakka soil and 75–125 cm deep in Immokalee and Pomello soils.
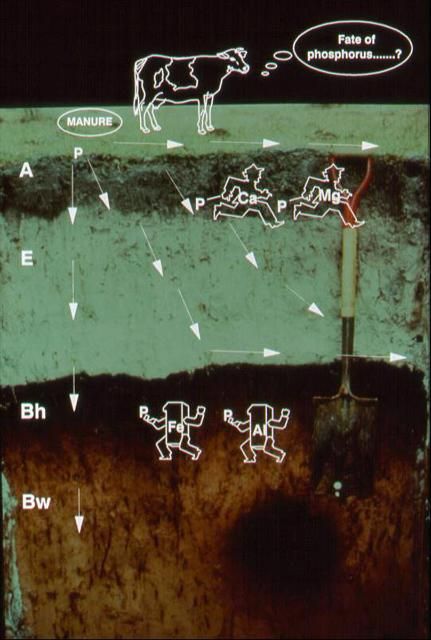
Florida Spodosols typically have an A horizon extending about 15–20 cm deep, followed by an E horizon with a thickness generally between 20 and 140 cm. The Bh horizon below the E horizon is dark-colored, where carbon, aluminum (Al), and iron (Fe) have accumulated (Soil Survey Staff 2003). A Bw horizon, commonly present beneath the Bh horizon, has little or no apparent accumulation of translocated material. Some Florida Spodosols also have Bt horizons (characterized by silicate clay accumulation) beneath the Bw horizon. Florida Spodosols are characterized by a fluctuating water table that typically reaches a seasonal high at a depth between 15 and 30 cm for the Myakka and Immokalee soils and between 60 and 105 cm for the Pomello soil.
How is depth to the spodic horizon important for understanding P loss from a soil?
When manure is added to the soil surface, the P released from the manure can move down the soil profile through the sandy A and E horizons, eventually reaching the Bh horizon (Figure 1). Manure contains P that is held by calcium and magnesium. Part of this P will be released over time when in contact with water (Nair et al. 1995). After release, P can be lost via surface or subsurface flow above the Bh horizon. As the depth to the spodic horizon increases, the chance of P loss from the soil via subsurface drainage increases, with a concomitant increase of P that subsequently reaches surface water. Once P reaches the Bh horizon, it is possible for the P to be held by Al and Fe. However, the Bh horizon has a finite capacity to hold P. Once this capacity is exhausted, P will move through the Bh horizon as well during seasonal periods of lower water tables.
Is there a tool to evaluate phosphorus release from P-impacted soils?
Phosphorus adsorption assessment using traditional Langmuir isotherms estimates the maximum P-retention capacity of a soil by measuring the amount of P a soil can hold when equilibrated with relatively high solution concentrations of P. However, P concentrations in a soil solution can approach a critical level with respect to environmental concerns well before the soil is completely saturated with P. This critical level, called the P saturation ratio (PSR), is discussed in EDIS publication SL335/SS539 An Indicator for Risk of Phosphorus Loss from Sandy Soils (https://edis.ifas.ufl.edu/ss539). The soil P storage capacity (SPSC) concept, based on a threshold PSR value, is described in detail in SL336/SS541 Understanding Soil Phosphorus Storage Capacity (https://edis.ifas.ufl.edu/ss541).
The SPSC indicates the potential of a soil to release P. The equations used to calculate SPSC are the following:
A and E horizons
SPSC = (0.1 – Soil PSRM1) * Mehlich 1-[(Fe/56) + (Al/27)] * 31 * 1.3 (mg/kg) Eq. 1
Bh horizons
SPSC = (0.08 – Soil PSRM1) * Mehlich 1-[(Fe/56) + (Al/27)] * 31 * 1.8 (mg/kg) Eq. 2
where soil PSRM1 (the P saturation ratio determined using Mehlich 1 parameters) is calculated as:
PSRM1 = (Mehlich 1-P/31) / [(Mehlich 1-Fe/56) + (Mehlich 1-Al/27)] Eq. 3
where P, Fe, and Al are determined in a Mehlich 1 solution.
The P, Fe, and Al in a Mehlich 1 solution can be obtained by sending a soil sample to any soil testing laboratory in the state.
How do we use SPSC to evaluate potential P contribution from a soil to Lake Okeechobee?
- Determine P, Fe, and Al in a Mehlich 1 solution.
- First calculate PSR, and then calculate SPSC for each soil horizon. SPSC can be calculated in kg P ha-1 (1 kg P ha-1 = 0.891 lbs P acre-1) if the depth of each horizon and the corresponding bulk density are known or can be reasonably approximated.
- SPSC can be summed across the various horizons to any desired depth to predict P loss from a given mass or volume of soil.
What is the long-term effect of manure-P additions on P loss from the soil?
The following scenarios that have resulted from manure P additions at dairy farms in the Lake Okeechobee watershed were evaluated using SPSC as the evaluation tool:
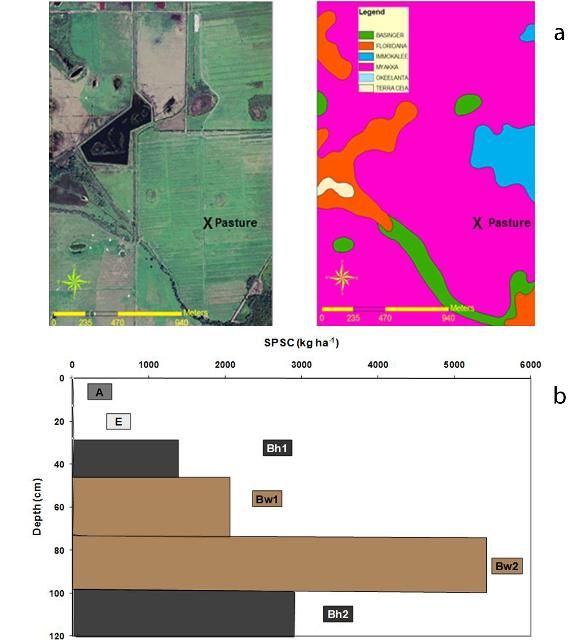
- Minimally P-impacted pasture on a Myakka soil (shallow spodic) (Figure 2).
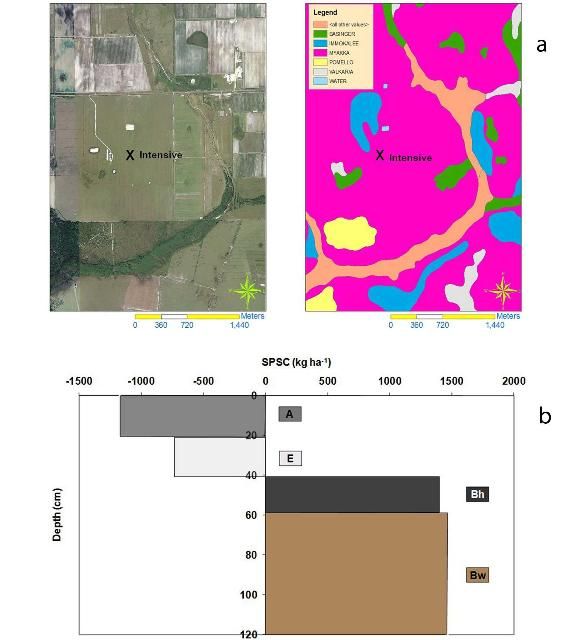
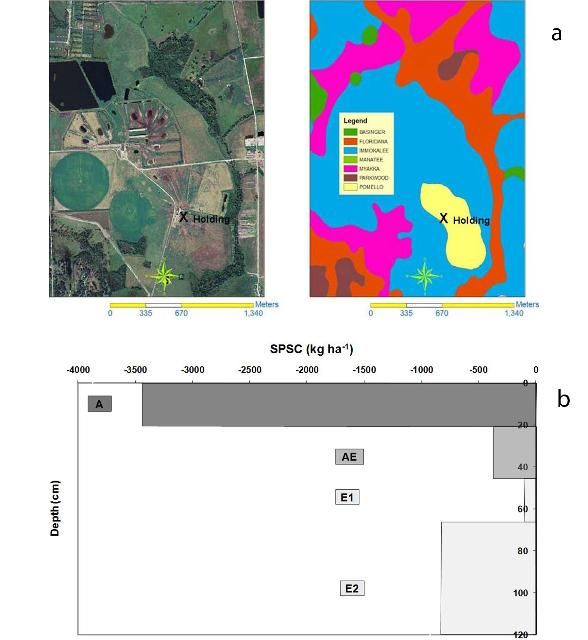
- P-impacted holding area on a Myakka soil (Figure 3).
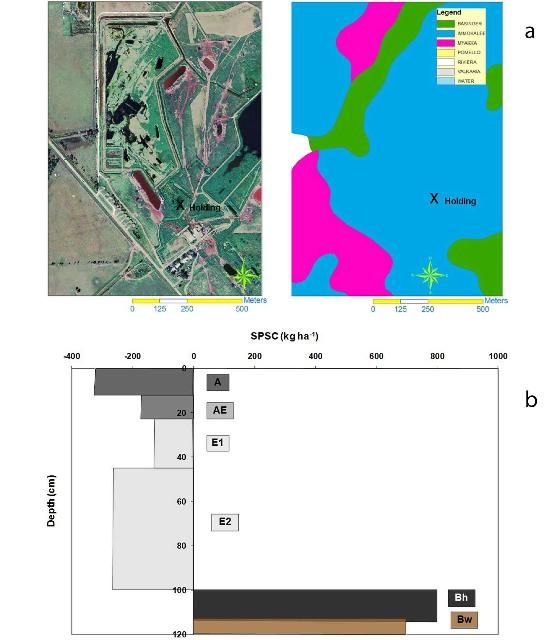
- P-impacted holding area on an Immokalee soil (deeper spodic than the Myakka) (Figure 4).
- P-impacted location on a Pomello soil with the spodic horizon occurring at lower depth than either the Myakka or the Immokalee (Figure 5).
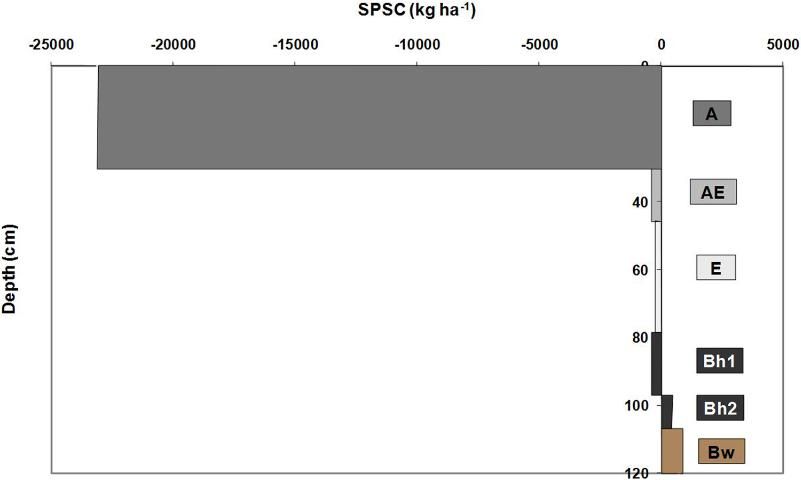
- Soils from abandoned dairies that were evaluated several years after abandonment (Figure 6).
For all soil profiles, SPSC was determined for the top 120 cm of soil.
What can we infer from the above observations?
- As the amount of manure deposited on a soil increases, the SPSC decreases, even when the additions are on the same soil type (Myakka; Figures 2a and 3a). For example, the SPSC for the A and E horizons of a minimally impacted pasture soil (Figure 2b) shows that the SPSC is close to zero, which suggests that these surface horizons will be a P loss risk if P is added beyond the crop requirement. The A and E horizons of heavily P-loaded soils (Figure 3b) have negative SPSC and therefore constitute a P loss risk. These dairies had been in operation for 8–9 years at the time of soil sampling.
- Dairies located on soils with a shallower spodic horizon (Figure 3a) had remaining storage capacity to a depth of 120 cm, even when the P loading was high. Although dairies located on soils with a deeper spodic horizon (Figures 4a and 4b) also had positive SPSC to 120 cm depth, the likelihood of P loss with subsurface drainage above the spodic horizon is higher than when a shallower Bh horizon exists.
- The Pomello soil (Figure 5) did not have a spodic horizon within the top 120 cm. It had negative SPSC throughout the profile down to 120 cm. Thus, P loss can continue both horizontally and vertically until it contacts a more P-retentive Bh horizon.
What happens to manure P after a dairy Is abandoned?
After a dairy is no longer active, manure P will continue to move both horizontally and vertically when in contact with water (Figure 6).
The P had moved down the soil profile, and even the top part of the Bh1 horizon had negative SPSC. We postulate that even without any new additions of manure, the SPSC of this soil in a few years will be negative down to 120 cm. Table 1 shows SPSC values to the 120 cm depth for five abandoned dairies.
What are the soil factors we need to consider for sustainable dairy farming?
- Within any given dairy, soil type often varies spatially (Figures 2a, 3a, 4a, and 5a). Therefore, activities within a given site should consider the soils where the activities are planned.
- It is preferable to keep the heavy manure-P application areas (e.g., the cattle holding or traffic areas) on a soil with a shallow spodic horizon compared to one with a deeper spodic unless the shallow spodic is in a very poorly drained position with very high runoff potential.
Notes on the SPSC Concept to Help Evaluate the P Release Potential of a Manure-impacted Site
- SPSC is additive when expressed on a volumetric basis (e.g., kg/ha/specified depth), so it is possible to obtain a cumulative value to any desired depth that could be used as a management tool.
- The SPSC value down to 120 cm in the above examples was an arbitrary depth selected for illustrative purposes; calculations of SPSC to any depth can be made.
- The capacity of retentive subsurface horizons (e.g., Bh, Bw, Bt) may not be accessed when they are below the water table. In effect, these horizons may be short-circuited if P is transported laterally above them.
- It is not likely that the location of the water table in a low P-impacted soil would have a significant effect on P release from the soil unless the soil continues to be loaded with P, at which time the surface horizons of the soil would be a P source (SPSC would become negative).
- SPSC is a tool that accounts for both previous P loading and the capacity of a soil to retain additional P. Therefore, it is not necessary to know the P application history or other site-specific factors like the age of the dairy, the length of time it has been in operation or when it was abandoned, the previous land use, etc.
- If positive, the absolute value of SPSC will indicate the amount of P that can be added before the soil becomes an environmental risk (i.e., prior to SPSC becoming zero).
References
Dari, B., V.D. Nair, J. Colee, W.G. Harris, and R. Mylavarapu. 2015. “Estimation of phosphorus isotherm parameters: a simple and cost-effective procedure.” Front. Environ. Sci. 3:70. doi: 10.3389/fenvs.2015.00070.
Dari, B., V.D. Nair, A.N. Sharpley, P. Kleinman, D. Franklin and W.G. Harris. 2018. “Consistency of the Threshold Phosphorus Saturation Ratio across a Wide Geographic Range of Acid Soils.” Agrosyst. Geosci. Environ. 1:180028 (2018) doi:10.2134/age2018.08.0028
Graetz, D.A., and V.D. Nair. 1995. "Fate of Phosphorus in Florida Spodosols Contaminated with Cattle Manure." Ecol. Eng. 5:163–81.
Nair, V.D. 2014. “Soil phosphorus saturation ratio for risk assessment in land use systems.” Front. Environ. Sci. 2:6. doi:10.3389/fenvs.2014.00006.
Nair, V.D., L.E. Sollenberger, W.G. Harris, A.N. Sharpley, A.M. Freitas, J.C.B Dubeux Jr., and A.N. Rodriguez. 2020. “Mining of soil legacy phosphorus without jeopardizing crop yield.” Agrosyst. Geosci. Environ. 2020;e20056. https://doi.org/10.1002/agg2.20056
Nair, V.D., W.G. Harris, and D. Chakraborty. 2010. An Indicator for Risk of Phosphorus Loss from Sandy Soils. SL333. Gainesville: University of Florida Institute of Food and Agricultural Sciences. https://edis.ifas.ufl.edu/ss539
Nair, V.D., W.G. Harris, D. Chakraborty, and M. Chrysostome. 2010. Understanding Soil Phosphorus Storage Capacity. SL336. Gainesville: University of Florida Institute of Food and Agricultural Sciences. https://edis.ifas.ufl.edu/ss541
Nair, V.D., D.A. Graetz, and K.M. Portier. 1995. "Forms of Phosphorus in Soil Profiles from Dairies of South Florida." Soil Sci. Soc. Am. J. 59:1244–49.
Soil Survey Staff. 2003. Keys to Soil Taxonomy. Ninth ed. USDA-NRCS.
Acknowledgments
This study was supported in part by a grant from the Florida Department of Agriculture and Consumer Services. We thank Don Graetz for sharing the archived soil samples, collected previously with partial support from the South Florida Water Management District. Thanks are due to Solomon Haile for generating the maps in this document. It is our pleasure to thank Ed Hanlon and Tom Obreza for their very valuable comments and suggestions on the draft version of this publication.