Introduction
Irrigation is used primarily to satisfy plant water needs that are not met by rainfall. South Florida receives, on average, around 56 inches of rainfall a year (Figure 1). However, rainfall is not equally distributed throughout the year, with two-thirds of the total rainfall occurring between May and October (Figure 2). As a result, south Florida has distinct “wet” and “dry” seasons, making irrigation critical to optimal plant growth and yield. The purpose of this fact sheet is to provide irrigation scheduling tips to growers of tropical fruit (e.g., avocado, mango, papaya, etc.) in south Florida. Information in this publication could also be of interest to Extension agents and students.
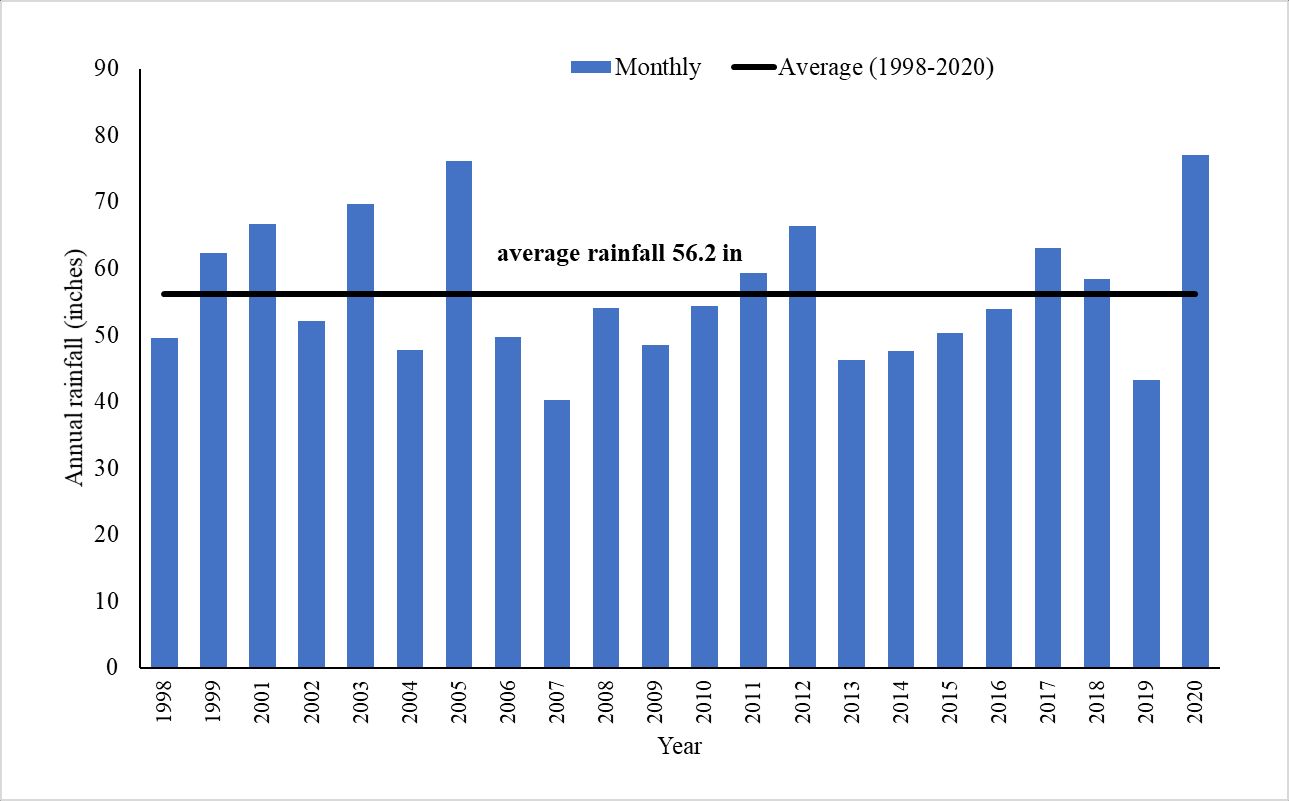
Credit: H. Bayabil, UF/IFAS
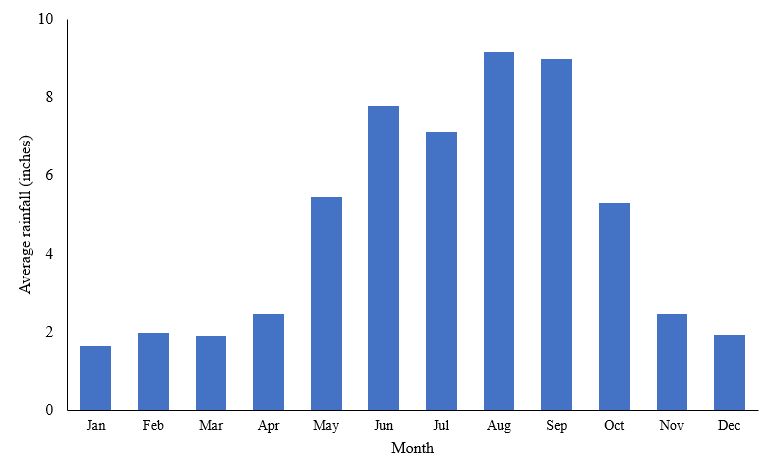
Credit: H. Bayabil, UF/IFAS
All irrigation scheduling methods should account for the soil’s water-holding capacity. Most tropical fruit trees in south Florida are grown on gravelly or sandy soils that have very low water-holding capacities. Soil water-holding capacity is defined as the amount of water that soil can hold against the force of gravity (for practical purposes, field capacity is essentially the same as soil water-holding capacity). In other words, it is the amount of water the soil can hold without any percolation losses. Thus, soils with a high water-holding capacity store more water for plant use than soils with a low water-holding capacity. Table 1 shows common soil water-holding capacities for soils of south Florida. When field-measured soil information is not available, the Web Soil Survey (WSS) provides soil data and information produced by the National Cooperative Soil Survey. Information regarding soil types can be found on the NRCS website at http://websoilsurvey.nrcs.usda.gov/app.
Rainfall characteristics and soil properties of south Florida are unique, and should therefore be included when determining an optimal irrigation schedule. An optimal irrigation schedule is defined as the irrigation schedule that ensures minimal water stress to tropical fruit trees and reduces water waste from percolation or runoff losses.
An optimal irrigation schedule should also consider tree species type. Fruit trees may or may not show visible symptoms of water stress. However, by the time symptoms of water stress are visible, it could already be too late to achieve complete recovery. On the other hand, some fruit trees (e.g., Tahiti limes, carambola, papaya, and banana) may show midday wilting because they cannot absorb water quickly enough during the hottest part of some days. This is usually temporary wilt, and the tree often recovers overnight.
The following section of this publication discusses available tools to determine an optimum irrigation schedule that takes into account the unique conditions in south Florida groves.
Irrigation Scheduling Approaches
Tensiometer
This device directly measures soil water potential or tension (Figure 3). Tensiometers must be properly installed within the root zone and require continuous maintenance to be effective (Figure 4). Readings from tensiometers are displayed in pressure units (tension) such as cbars (1 cbar = 0.01 bar; 1 bar = 14.5 psi). The tension at which water is held in the soil indicates the amount of energy plants need to overcome to access the water.
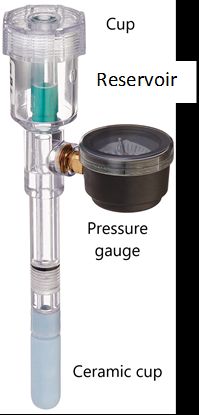
Credit: H. Bayabil, UF/IFAS
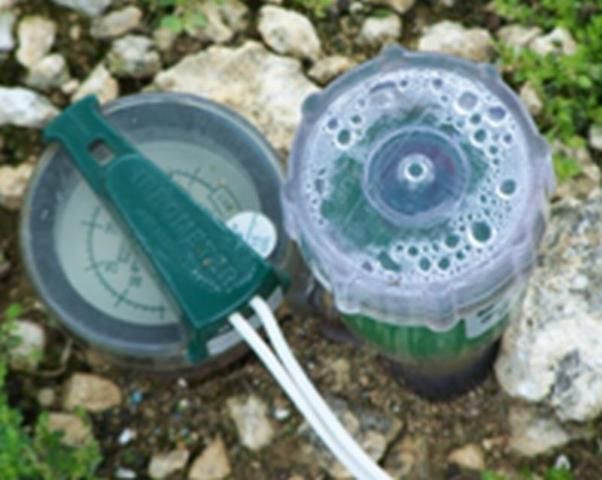
Credit: Kati Migliaccio, UF/IFAS
Different plants have different responses to ranges of soil water tension. However, the following guidelines can be used to interpret tensiometer readings for irrigation scheduling in gravelly or sandy soils.
- Tensiometer readings of 0–5 cbars: The soil is saturated or nearly saturated as a result of recent rain or irrigation. Irrigation should be discontinued to prevent water waste and nutrient leaching through percolation and/or runoff.
- Tensiometer readings of 10–20 cbars: The soil is drying, and irrigation should be applied. Irrigation should aim to bring the soil moisture level to water-holding capacity or to 0–5 cbars. Irrigation should be initiated at 10–15 cbars during flowering, fruit set, and development, but at other times it should be initiated at 15–20 cbars.
- Tensiometer readings of 30 cbars and greater: The plants are likely experiencing water stress and should be irrigated immediately. Delaying irrigation could result in yield reduction and wilting of plants.
Tensiometers can be purchased as stand-alone sensors, or they can be outfitted with magnetic switches that allow the device to trigger irrigation only when the soil tension exceeds the setpoint (Figure 4).
For additional information on tensiometers, see Ask IFAS publication ABE326, “Using Tensiometers for Vegetable Irrigation Scheduling in Miami-Dade County” (https://doi.org/10.32473/edis-tr015-2002).
Capacitance Probe
Many different companies sell capacitance-based probes that are designed to be used to measure volumetric soil water content (i.e., the volume of water in a given volume of soil). The suitability of these devices for irrigation scheduling varies, and devices should be selected properly. Capacitance probes could be sensitive to clay content and soil salinity level, etc. It is advisable to test and calibrate these probes for site-specific applications. Extension specialists can help with the selection of an appropriate capacitance probe. These instruments take advantage of the fact that the dielectric constant of pure water is 80, the dielectric constant of air is 1, and the dielectric constant of dry soil is in the range of 4–6. The dielectric constant describes the ability of a substance to hold an electrical charge. Therefore, soils that contain greater volumetric water contents will have a greater dielectric constant, which can be measured electronically using capacitance probes. The probe measures the electrical capacitance of the surrounding soil-air-water mixture and converts this reading into the percentage of water in the soil. Capacitance probes may consist of one sensor or multiple sensors. Figures 5 and 6 show an example of a multi-sensor (i.e., at different depths along the soil profile) capacitance probe.
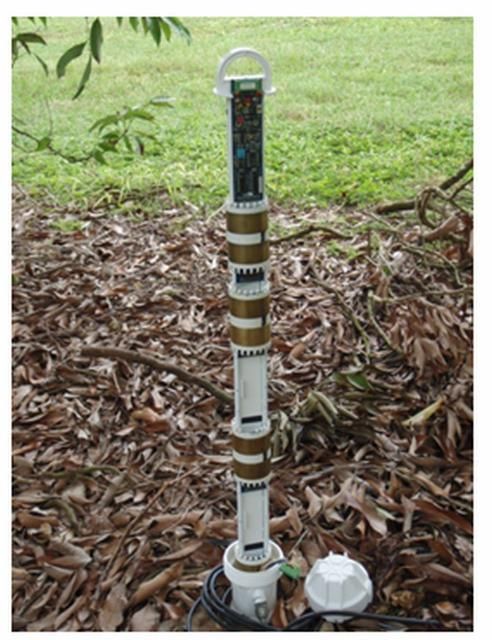
Credit: Luis Barquin
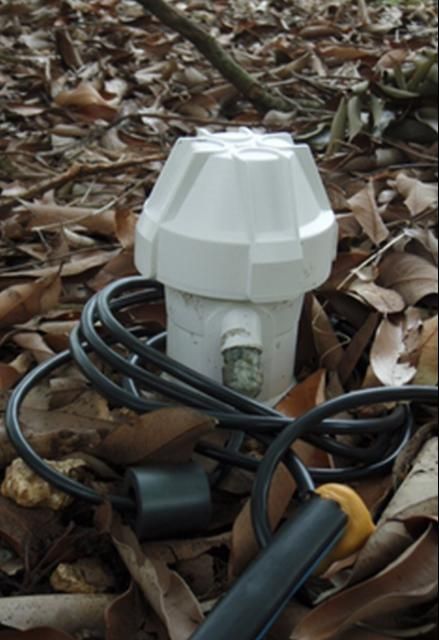
Credit: Luis Barquin
The probes provide a real-time assessment of soil water content. Thus, the data from a probe will only give information and characteristics about the area where the probe is installed. Data from one orchard should not necessarily be used to manage other orchards because soil and water characteristics may be substantially different among sites.
Evapotranspiration
Evapotranspiration (ET) refers to the evaporation and transpiration losses of water from the orchard. Water requirements of trees can be calculated by determining these losses using reference evapotranspiration (ETo) data (Table 2). Reference ET is a value calculated from multiple weather parameters such as temperature, wind, and solar radiation.
Actual crop evapotranspiration (ETc) is determined by multiplying the cropping coefficient (KC) by the reference ET (ETo) (Equation 1):
ETc = KC x ETo
The irrigation rate (IR) is then estimated by subtracting the amount of rainfall from ETc (Equation 2), where IR is irrigation and R is rainfall:
IR = ETc ‒ R
Daily ETo values are provided by the Florida Automated Weather Network (FAWN) for locations throughout Florida. This information is located on the FAWN website (http://fawn.ifas.ufl.edu/) in the "FAWN Tools" drop-down menu, under "Irrigation" and then "Evapotranspiration (ET)." The Kc values differ among crops and crop growth stages and should be diligently calculated and changed throughout the year. Current Kc values for tropical fruit crops under south Florida conditions have not been sufficiently researched. Local Extension specialists or agents can offer suggestions for Kc values within your geographical area.
Irrigation rates can easily be calculated using the ET method. This approach is described in Table 3. Note that this is just an example, and each location should be evaluated according to its specific crop, soil, and weather characteristics.
In addition to this hand-calculation method, more sophisticated ET irrigation technology is available, including real-time ET controllers and stand-alone ET controllers. With this technology, the controller receives this information, and real-time weather data are used to determine the irrigation schedule. These technologies have been used successfully in Homestead, Florida, for carambola (Kisekka et al. 2010) and avocado production. Several Ask IFAS publications outline these technologies and procedures, including “Evapotranspiration-Based Irrigation for Agriculture: Sources of Evapotranspiration Data for Irrigation Scheduling in Florida” (https://edis.ifas.ufl.edu/ae455), “Evapotranspiration-Based Irrigation for Agriculture: Crop Coefficients of Some Commercial Crops in Florida” (https://edis.ifas.ufl.edu/ae456), “Evapotranspiration-Based Irrigation Scheduling for Agriculture” (https://edis.ifas.ufl.edu/ae457), and “Implementing Evapotranspiration-Based Irrigation Scheduling for Agriculture” (https://edis.ifas.ufl.edu/ae458).
Soil Water-Holding Capacity/Depletion
Soil water-holding capacity is generally very low in the sandy or gravelly soils commonly found in south Florida (Table 1). With any irrigation schedule, irrigation water should bring the soil moisture only up to soil field capacity because volumes above this amount will be lost to percolation and/or runoff. In general, the amount of water available to the trees depends on the soil water-holding capacity, the area of water application, and the volume of the root zone.
Root zone depth can typically be determined by knowing the depth of the trench, if one exists, in the orchard. For an established orchard, roots will be found throughout the trenched area. Trenches are typically 24 inches deep and 16 inches wide. Additional roots form a "pancake-like" layer in the plowed soil, and most active roots are found in this area. The plowed soil is typically 5–6 inches deep. If irrigation is managed to consider the trenched depth, over-irrigation will occur on locations without trenching, and the fruit tree will not use a portion of the irrigation water. In addition, fertilizer in this area may be leached beyond the root zone, which wastes fertilizer and money.
Some irrigation systems do not cover the entire field but rather focus on areas where roots are located. The area receiving spray from this type of irrigation system is referred to as "wetted perimeter." The wetted perimeter can be measured by turning on the irrigation and using a measuring device to determine the diameter of the wetted area. It is important to remember that the height of the micro-jet or other sprinkler device influences the wetted perimeter. To determine the area from the diameter measured, use Equation 3, where A is the area and D is the diameter:
A= 3.14 (D/2)2
If the diameter is measured in units of feet, then the area (A) calculated is in units of square feet. This value can be used to convert irrigation delivery rates that are in volumes, such as gallons per hour (gph), into rates that are depth per time, such as in/hr. Irrigation rates can easily be measured in the field using a volumetrically marked container and a stopwatch. The irrigation would be initiated, and once the system was pressurized, a volume of water would be collected from an emitter and timed. This provides the user with an estimate of the water delivered. Another method would be to use a catch-can type of approach. For more information on this approach, see Ask IFAS publication FS98-2, “Field Evaluation of Container Nursery Irrigation Systems: Measuring Uniformity of Water Application of Sprinkler Systems” (https://edis.ifas.ufl.edu/publication/AE194). Table 4 provides an example for sandy soils, and Table 5 shows an example for gravelly soils. (Note: These are just examples, and each irrigation system should be evaluated in terms of its unique characteristics.)
To use the soil water-holding capacity/depletion method, it is critical to know the level of depletion before irrigating. This can be complicated due to the varying factors that influence soil-water content, including precipitation, evapotranspiration, capillary rise, runoff, and percolation. This method can lead to over-irrigation if these factors are not considered in the depletion calculation. One option is to use soil water-holding capacity in conjunction with other technology such as tensiometers.
Summary
Irrigation scheduling can be accomplished using different tools. Each tool has its benefits and weaknesses (Table 6). It is critical to use each tool as it is intended to ensure tropical fruit trees have the irrigation water they need.
References
Haman, D. Z., and T. H. Yeager. 2019. “Field Evaluation of Container Nursery Irrigation Systems: Measuring Uniformity of Water Application of Sprinkler Systems.” FS98-2. Gainesville: University of Florida Institute of Food and Agricultural Sciences. https://edis.ifas.ufl.edu/publication/AE194
Kisekka, I., K. W. Migliaccio, M. D. Dukes, B. Schaffer, and J. H. Crane. 2010. "Evapotranspiration-Based Irrigation Scheduling and Physiological Response in a Carambola (Averrhoa carambola L.) Orchard." Applied Engineering in Agriculture 26(3): 373–80.
Kisekka, I., K. W. Migliaccio, M. D. Dukes, B. Schaffer, J. H. Crane, K. Morgan, H. K. Bayabil, and S. M. Guzman. 2020. “Evapotranspiration-Based Irrigation for Agriculture: Sources of Evapotranspiration Data for Irrigation Scheduling in Florida.” AE455. Gainesville: University of Florida Institute of Food and Agricultural Sciences. https://edis.ifas.ufl.edu/ae455
Kisekka, I., K. W. Migliaccio, M. D. Dukes, J. H. Crane, B. Schaffer, S. M. Guzman, and H. K. Bayabil. 2020. “Evapotranspiration-Based Irrigation for Agriculture: Crop Coefficients of Some Commercial Crops in Florida.” AE456. Gainesville: University of Florida Institute of Food and Agricultural Sciences. https://edis.ifas.ufl.edu/ae456
Kisekka, I., K. W. Migliaccio, M. D. Dukes, B. Schaffer, J. H. Crane, H. K. Bayabil, and S. M. Guzman. 2020. “Evapotranspiration-Based Irrigation Scheduling for Agriculture.” AE457. Gainesville: University of Florida Institute of Food and Agricultural Sciences. https://edis.ifas.ufl.edu/ae457
Kisekka, I., K. W. Migliaccio, M. D. Dukes, J. H. Crane, B. Schaffer, S. M. Guzman, and H. K. Bayabil. 2020. “Implementing Evapotranspiration-Based Irrigation Scheduling for Agriculture.” AE458. Gainesville: University of Florida Institute of Food and Agricultural Sciences. https://edis.ifas.ufl.edu/ae458
Table 1. Soil water-holding capacities (inches of water per foot of soil depth) for various soil types.
Table 2. Monthly average ETo values (inches per day) based on 22 years of historical monthly observations at the UF/IFAS Tropical Research and Education Center, Homestead FAWN station. Data for 2000 are not available from FAWN and were not included.
Table 3. Calculation of irrigation using the ET data to analyze a one-week period of sprinkler irrigation during the month of May.
Table 4. Sample calculation of irrigation considering soil water-holding capacity in a sandy soil using micro-sprinkler irrigation.
Table 5. Sample calculation of irrigation considering soil water-holding capacity in a gravelly soil using sprinkler irrigation.
Table 6. List of irrigation tools and methods with advantages and disadvantages.