Using Secondary Data to Build Strong Extension Programs
Introduction
Developing an effective Extension program depends in no small way on having an accurate description of clients' situations, needs, and interests. Assessing client needs (and assets) through the use of both primary and secondary data provides the foundation for an effective Extension program. Primary data include any information you have collected and analyzed yourself through such means as focus groups, surveys, interviews, observations, and tests. Secondary data have already been collected, analyzed, and made available from other sources (White, 2010). Because collecting and analyzing primary data can be expensive and time consuming, it is important to use secondary data where possible.
Extension frequently uses secondary data. For example, when mapping agricultural land use for a report, you might use existing ground-referenced data or satellite sensory imagery. In developing the situation and rationale for a food safety program, you might collect information from the Center for Disease Control related to the number of people in a community who have reported suffering from food poisoning after eating in local restaurants.
Although government agencies are considered the principal source of secondary data, data may come from nongovernment organizations or individuals as well (White, 2010). Secondary data may be published or unpublished. In the past, secondary data have been mostly factual in nature, but increasing amounts of attitudinal data are also becoming available.
Secondary data can be useful as supplementary data for reference purposes, for comparisons and contrasts, and for adding additional levels of richness to other data. However, secondary data are frequently used as the only source of data in Extension, which is fine if they meet the need. For example, you might want to compare the demographics of your 4-H clubs to the state, county, and national demographics found in the US Census.
Advantages of Secondary Data
Secondary data use has many advantages. It is economical—gathering new data and analyzing them can be costly. Cost for labor, materials, purchased samples or panels of populations, and advertising can add up for what may appear to be a simple survey.
Secondary data are efficient—gathering new data can take a good deal of time and energy (Sorensen, 1996). In addition to creating the data collection instrument and identifying the population or sample selection, which takes a lot of thought and skill, gathering primary data can take anywhere from a few weeks to, in the case of a longitudinal study, years. Even after data are gathered, time must be spent compiling and analyzing them.
Disadvantages of Secondary Data
Secondary data have many advantages, but caution must be taken as secondary data can also be misused (Atkins & Brandolini, 2001; White, 2010). All secondary data should be closely examined before including them in your Extension program to be sure that the information is reliable, timely, and meets your specific needs.
The age of data can be a serious issue. Secondary data are frequently outdated. Data should be relatively new and situations surrounding the data should be similar. For example, using 10-year-old data on the number of hours per week an American family uses a computer would show very different results from the same data collected today.
Accuracy in secondary data should not be assumed (Sorensen, 1996). It is not unusual to find secondary data that have sometimes been manipulated from their original source. Manipulated data can be fraught with errors and inconsistencies. It is always best to use the original data when possible. Secondary data quite often come from un- reliable sources who have not conducted rigorous scientific studies. The federal government is most likely to conduct reliable studies that provide secondary data (White, 2010). The best way to be sure is to look closely at the data and data collection methods. Newspapers, magazines, and Internet sites (including Google) are known for conducting surveys that yield unreliable data because of the methods they use to gather the information. Putting questions on the web and asking those who use the Internet to answer them (commonly known as convenience samples) is unlikely to provide reliable data (Dillman, Smyth, & Christian, 2014). Because people who do not have access to the Internet can't respond, the results are likely to be biased.
It is essential to evaluate the source and accuracy of all data before quoting them as being accurate. The print media often quote information that is found in other printed sources, which can frequently be tracked back to a comment someone made that may not be based on fact. Following are some questions to ask when evaluating the quality of secondary data.
Evaluating the Quality of Secondary Data
Relevance
Are the data up to date? If the data are being used as supplemental data, are the data relevant to your own study? Are the units of measurement and population similar to your primary data units? Are the definitions and concepts that form the basis of the data the same? Is there a logical relationship between the secondary data and the primary data? And finally, are the objectives, scope, and nature of the primary and secondary data the same? It is often necessary to read the original research study and avoid using the data at face value.
Availability and Sufficiency
Do the secondary data exist? For example, data related to computer usage by the general public would be almost nonexistent 30 years ago. Are the data available for public use? Sometimes the data are only available within an organization, or there is a charge for the data. Are there enough data to make them a useful supplemental source? For example, if a study is done on 25 girls suffering from eating disorders, it might not be appropriate to generalize. It is more appropriate to generalize a study using a probability sample that includes 1,000 girls across the United States.
Validity and Reliability
Are the secondary data valid and reliable? Do the data represent what was supposed to be measured? How complete and accurate are the data? Have the data been altered? Sometimes we are not looking at the original data results but at numbers that have been manipulated in some way for another purpose. Because they are secondary data, it is important to always check to see that they were obtained from an original source and not from a source where the data might have been altered.
Locating Secondary or Supplemental Data
Lastly, due to the large amount of data available, locating the appropriate secondary data can be overwhelming and time consuming. Some specific locations for information are listed below:
- The UF/IFAS Program Development and Evaluation Center (PDEC) website (http://pdec.ifas.ufl.edu) includes a section on secondary information that is frequently updated.
- The Florida Extension statewide initiatives and priority work groups (http://pdec.ifas.ufl.edu/teams/u.pl) often list statistics and other secondary information that they feel might be useful and that have been reviewed for value and reliability by subject-matter specialists.
- The The Workload Impacts Toolkit (https://pdec.ifas.ufl.edu/workload/toolkit.shtml) also has a page for gathering secondary information.
- The UF/IFAS Food and Resource Economics Department's Economic Impact Analysis Program provides a great deal of up-to-date secondary data (http://fred.ifas.ufl.edu/extension/economic-impact-analysis-program/).
- The University of Florida Smathers Libraries offer re- search assistance and access to thousands of journals and unpublished UF theses and dissertations. UF/IFAS has a dedicated librarian who has organized a website called Databases by Extension Goals (http://guides.uflib.ufl.edu/extensiongoals), which is customized for Extension faculty.
- MyFlorida.com (http://www.myflorida.com) is the official portal of the state and has many links to state and national statistics on a wide range of topics. Use the search engine to find state government data and other resources for your specified question or topic.
- The USDA Agricultural Statistics Service (http://www. nass.usda.gov/) has very timely and comprehensive information, including Quick Stats that can be queried by commodity and the Census of Agriculture (conducted every 5 years).
- The US Census Bureau (http://www.census.gov/) has a QuickFacts tool to easily access data from the decennial census, the annual American Community Survey, and several other sources. Data are available for state, county, and cities or towns with a population of 5,000 or more on a wide variety of demographic, social, and economic indicators.
- The national 4-H (https://4-h.org) organization collects data on youth enrollment and volunteer support each year. All states report to the national headquarters using a standard report (called the ES-237).
- When calculating the value of volunteer hours, use the data from Independent Sector (http://www.independent- sector.org). Use the Florida dollar value for POW/ROA reports and the national rate when reporting to other state, regional, or national entities.
- The Labor Market Statistics Center (https://floridajobs.org/workforce-statistics/data-center/statistical-programs) has data from several state and federal sources, including the quarterly census of employee wages (QCEW), current employment statistics (CES), local area unemployment statistics (LAUS), occupational employment statistics and wages (OES), and employment projections (EP).
Finally, when you find a good source of information, make a note of it for future use. You never know when it will come in handy, and this will save you time and energy.
Not sure where to start?
- Use the "Ask a Librarian" chat tool (http://www.uflib.ufl. edu/ask/).
- Look at the resources posted by your priority work group (http://pdec.ifas.ufl.edu/teams/u.pl).
- Ask your program leader or UF/IFAS Extension director to identify someone who works in a similar area or who has knowledge of databases.
- Review the publications online at EDIS (ufl.eduufl.edu) or UF/IFAS Extension website (https://sfyl.ifas.ufl.edu) to find out which secondary data are used by your peers.
- Contact someone in the PDEC office at 352-392-0386 for assistance if you are having problems locating what you need.
How to Use Secondary Data
The first step in using secondary data is to identify the key indicators most relevant to you. A key indicator is a piece of data that provides information about a group of clients or potential clients. Key indicators can be used to describe the size of a group or the number (or percentage) in the group with a specific condition. For example, the number of farmers in a county reported in the Census of Agriculture is an indicator of the target audience for faculty working with agricultural programs. The percentage of farmers in a county who have gross sales below $100,000 provides information about the economic well-being of that group.
One way to select key indicators is to focus on measures that are commonly used by subject-matter specialists in your area. Variables that are used in published research that you read also should be considered. Finally, your judgment and experience will lead you to select relevant measures.
The second step is to interpret the data. The meaning of the data can be clarified by making comparisons. One type of comparison is across time for the same unit. For example, comparing the number of home foreclosures over the past ten or twenty years, or before and after major events like the Great Recession or Covid-19 pandemic, can indicate the size of a client group that might need financial management education and whether this need is increasing or decreasing. Another type of comparison is between units. Comparing the number of foreclosures in your county with those in a neighboring county or one with a similar population size can serve as a basis for determining a need.
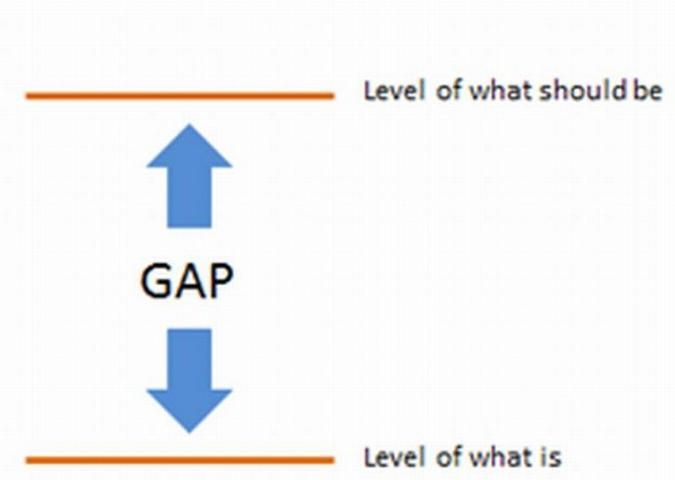
The comparison process leads to the third step: applying the Gap Model. The Gap Model restates the comparison in terms of "what is" and "what should be" (Israel, 1993). The latter is based on the data used for comparison and helps to determine the realistic potential for program objectives. The difference between the current condition (what is) and the potential (what should be) is the size of the gap (Figure 1). Applying existing secondary data to the "what is" section of the model provides a better picture of "what should be," helping to identify more clearly what still remains as a need. "Thus, the need can be clearly quantified, that is, the numerical value of the gap between the ideal or preferred condition and the current situation can be described" (Israel, 1993 p. 3) and acted on accordingly.
Conclusion
Using secondary data in an Extension program can add richness and depth to the logic model that acts as a roadmap for the Extension program. Secondary data can improve the clarity of the problem and the situation surrounding the issues, and they can also provide additional information to reinforce primary data used to show the outcome and impact of Extension programs.
References
Atkins, A. B. & Brandolini, A. (2001). Promise and pitfall in the use of "secondary" data-sets: Income inequity in OECD countries as a case study. Journal of Economic Literature, 39(3), 771–779. https://doi.org/10.1257/jel.39.3.771
Dillman, D. A., Smyth, J. D., & Christian, L. M. (2014). Internet, phone, mail, and mixed-mode surveys: The tailored design method (4th ed.). Hoboken, NJ: John Wiley & Sons.
Israel, G. D. (1993). Problem/audience identification for county Extension program planning. PEOD13, 7 pp. Gainesville: UF/IFAS.
Sorenson, H. T., Sabroe, S., & Olsen, J. (1996). A framework for evaluation of secondary data sources for epidemiological research. International Journal of Epidemiology, 25(2), 435–442. https://doi.org/10.1093/ije/25.2.435
White, P. (2010). Making use of secondary data. In N. Clifford, S. French, & G. Valentine (Eds.), Key methods in geography (pp. 61–76). Thousand Oaks, CA: Sage.
