Introduction
Mapping or visualizing locational information helps understand the spatial variations and relationships among events; objects (e.g., land, water, and buildings); and their features; such as topography (e.g., elevation, height, and depth); soil; and land cover. Geographic information and geospatial data (i.e., about the geographic location of things on the Earth's surface) are vital in many practical fields, including precision agriculture, natural resources management, flood zone mapping and management, and environmental assessment. Moreover, geospatial data can help identify priority areas for Extension and research programs and help us understand the geographic characteristics of an area of interest. The geospatial data are prepared and provided in multiple formats (e.g., vector, grid or raster, and tabular data) depending on the types of data (e.g., points, lines, polygons, images, and attributes). The data can be obtained from different sources (e.g., agencies and institutes that create and/or process the data) and collections (e.g., a set of geospatial data collected from diverse sources under a subject or theme). Many different tools can help view, manipulate, and investigate geospatial data. A geographic information system (GIS) is a piece of computer software specifically developed to create, store, manipulate, analyze, and visualize geospatial data. Depending on geospatial data's intended use, there can be many different ways to obtain and manage the data. The rapid development of sensing, computing, and software technologies has increased availability of a wide variety of geospatial data. Such advances will make the use of geospatial data more common. When developing Extension programs, especially those related to demography, landscape, and climate at a large spatial scale, it is often necessary to have knowledge of the sources and kinds of geospatial data and tools that can handle the data. This publication introduces publicly available geospatial data, including elevation, land use, soil, satellite imagery, and other thematic maps and GIS software commonly used in spatial analysis. This article is designed to help Extension agents, Extension specialists, and concerned residents identify common geospatial data and tools and ways to access them.
Geospatial Data Types
There are two major types of geospatial data: vector and grid (or raster) (Figures 1 and 2). The vector data represent spatial objects, such as buildings, roads, and areas, with points, lines, and polygons on a coordinate plane (Figure 1). Each object, such as a point, line (or line segment), and polygon, has unique features and qualities (e.g., height, weight, size, density, and color) that make it distinguishable from others. The grid format is commonly used to represent seamlessly varying variables on a coordinate plane (Figure 2). A digital photo is a typical example of grid data, and it consists of an array of pixels with different values of brightness and red-green-blue (RGB) colors.
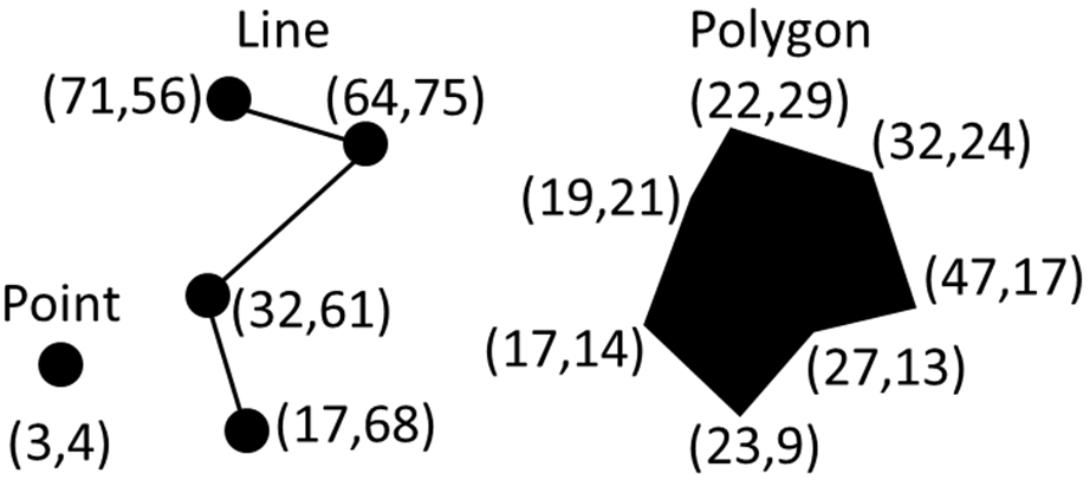
Credit: Young Gu Her, UF/IFAS
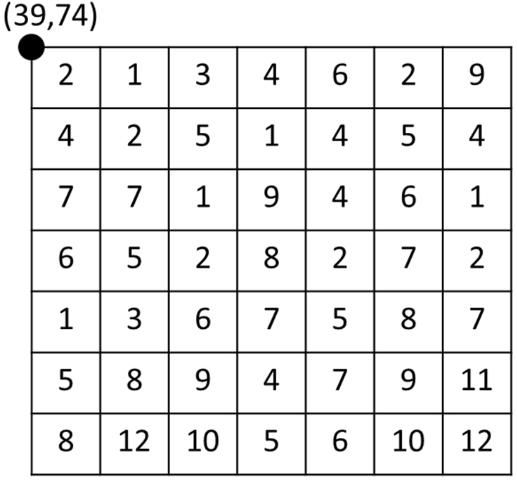
Credit: Young Gu Her, UF/IFAS
Elevation (or Topography)
The National Map
https://viewer.nationalmap.gov/basic/
The National Map (TNM) is a nationwide elevation map supported by the United States Geological Survey's National Geospatial Program (USGS NGP). TNM is the outcome of a collaboration among USGS and other federal, state, and local agencies to provide integrated topographic maps for the United States (USGS 2020). TNM data are in a raster format, and the grid cell sizes (or spatial resolution) range from 1 m to 60 m depending on the location. Relatively high-resolution data can describe the elevation (or topography) of an area more precisely, compared to low-resolution data (data with a large grid cell size). For instance, the 60 m resolution can be divided into 3,600 1 m grid cells, which can describe topography in much more detail (one 60 m cell vs. 3,600 1 m cells).
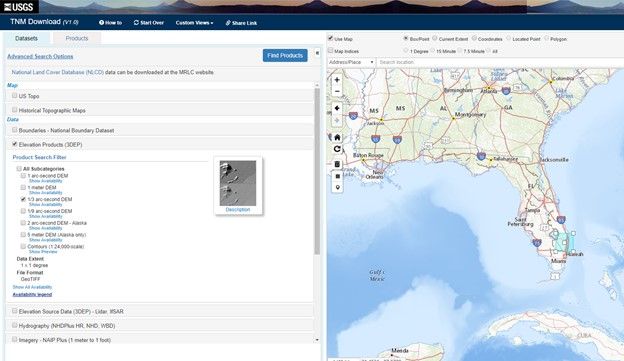
Credit: USGS
Open Topography
https://portal.opentopography.org/datasets
Open Topography provides fine-resolution topographic information from Light Detecting and Ranging (LiDAR) elevation data and coarse-resolution global-scale digital elevation model (DEM) supported by the National Science Foundation. Here, fine-resolution (or high-resolution) usually means a grid cell size equal to or less than 1 m. The LiDAR data are a type of DEM, and they can give more precise information on topography compared to the global-scale DEM. Open Topography offers more than 300 datasets of LiDAR covering 90% of North America and coarse global DEMs covering areas other than North America.
Land Use and Cover
National Land Cover Database
The National Land Cover Database (NLCD) provides nationwide land cover data at a 30 m resolution with 16 land use and cover classes. It is supported by the Multi-Resolution Land characteristics Consortium (MRLC). NLCD provides information about current and historical land covers. The latest version of NLCD offers land cover maps for 2001, 2003, 2006, 2008, 2011, 2013, and 2016. NLCD is in a raster format, showing the spatial variations of land covers at the resolution of 30 m.
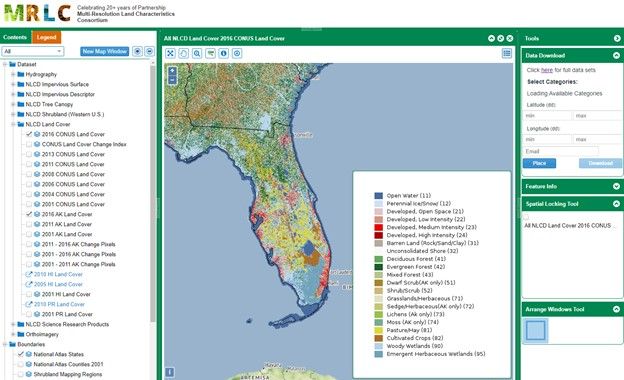
Credit: MRLC
CropScape – Cropland Data Layer
https://nassgeodata.gmu.edu/CropScape/
CropScape – Cropland Data Layer (CDL) provides crop-specific land cover maps covering the United States in a raster format. The data are supported by the United States Department of Agriculture National Agricultural Statistic Service (USDA NASS). The land cover data are available for every year from 1997, enabling the tracking of changes in land covers (or crop-specific areas) (USDA 2020). The CDL data are also prepared in a grid format at the resolution of 30 m.
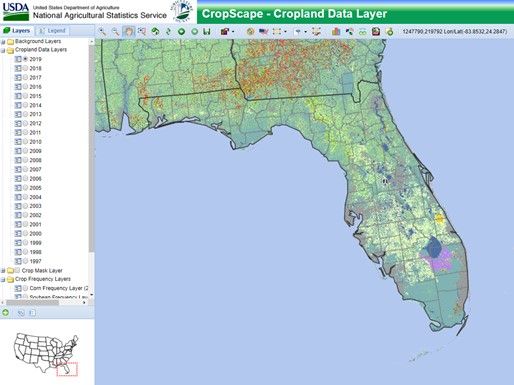
Credit: USDA NASS
Terra Populus
https://data.terrapop.org/terraclip
Terra Populus provides land cover/use and climate data supported by the National Science Foundation. Terra Populus also provides human-environment data for geographic space coupled with census data from all over the world (GIS Geography 2020).
Soil
SSURGO/STATSGO/NATSGO
https://gdg.sc.egov.usda.gov/GDGOrder.aspx
There are three digital soil data levels available for the United States: Soil Survey Geographic Database (SSURGO), State Soil Geographic Database (STATSGO), and National Soil Survey Geographic Database (NATSGO). SSURGO contains the most detailed county-level soil data, and STATSGO is a less detailed statewide soil map. NATSGO is a very general soil map of the United States. These soil layers are in a vector format. Soils that have the same or similar characteristics are grouped by polygons. There are the grid versions of the soil data layers: gridded SSURGO (or gSSURGO), gridded NATSGO (or gNATSGO), and Raster Soil Survey (RSS). The soil information of RSS is mainly derived from SSURGO. All the three data layers, SSURGO, STATSGO, and RSS, are integrated into gNATSGO. The gSSURGO and gNATSGO are provided at the resolutions of 10 m (statewide) and 30 m (the conterminous United States). Compared to the others, RSS has a relatively fine spatial resolution of 5 meters. The soil data are supported by the United States Department of Agriculture Natural Resources Conservation Service (USDA NRCS). Users can select specific areas of interest in the Geospatial Data Gateway (GDG) viewer (https://gdg.sc.egov.usda.gov/GDGOrder.aspx) or directly download the statewide soil maps at https://nrcs.app.box.com/v/soils. The topography and soil data assume that elevation and soil characteristics do not change over time, so they are not updated regularly.
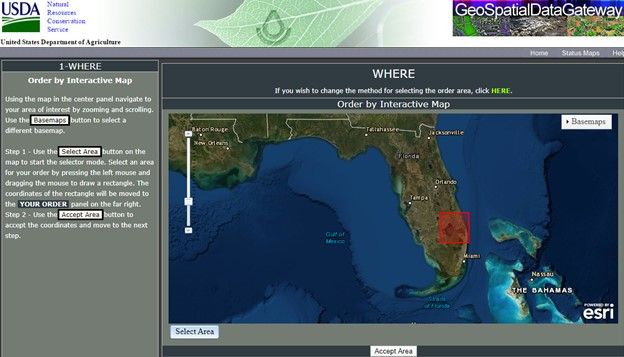
Credit: USDA NRCS
Satellite Imagery
Earth Explorer
https://earthexplorer.usgs.gov/
Earth Explorer, supported by USGS, provides free and open access to the most extensive collection of satellite and remote-sensed data. Available data include aerial imagery (e.g., Digital Orthophoto Quadrangle), digital elevation (e.g., Global 30 Arc-Second Elevation), and land cover (e.g., Global Land Cover Characterization, NASA/U.S. Geological Survey Landsat, and EROS Moderate Resolution Imaging Spectroradiometer [eMODIS]). The satellite and remotely sensed images are in raster formats with different resolutions. Each of the image types is described in detail in Earth Explorer.
Google Earth Engine
https://earthengine.google.com/
According to Google, "Earth Engine is a platform for scientific analysis and visualization of geospatial datasets, for academic, non-profit, business and government users. Earth Engine hosts satellite imagery and stores it in a public data archive that includes historical Earth images going back more than forty years. The images, ingested on a daily basis, are then made available for global-scale data mining. Earth Engine also provides APIs and other tools to enable the analysis of large datasets" (Google Earth Engine 2020).
Copernicus Open Access Hub
https://scihub.copernicus.eu/dhus/#/home
Copernicus Open Access Hub provides Sentinel-2 satellite data and other high-resolution satellite imagery, focusing on Europe. It is supported by the European Space Agency (ESA).
Thematic Map (Map Focusing on a Specific Theme or Subject Area)
Natural Earth Data
http://www.naturalearthdata.com/downloads/
Natural Earth Data, which is supported by the North American Cartographic Information Society, provides various types of thematic maps in three categories: "cultural," "physical," and "raster." The cultural maps include administrative and demographic features such as country, state, and province boundaries and urban areas. The physical maps show geographic characteristics, including coastal lines and river centerlines. The raster maps provide topography information such as elevation and bathymetry on a global scale.
Socioeconomic Data and Applications Center
https://sedac.ciesin.columbia.edu/
The Socioeconomic Data and Applications Center (SEDAC), supported by the National Aeronautics and Space Administration (NASA), provides various thematic maps at global scales, such as croplands and climate change impacts on food production, food insecurity hotspots, hazardous waste sites, anthropogenic biomes, and dam locations. Its flagship data product provides global-scale population size and density information in a grid (or raster) format.
Environmental Data Explorer
The Environmental Data Explorer (EDE) shares source data that the United Nations Environment Programme (UNEP) uses to conduct its environmental assessments. The EDE has statistics and thematic maps (e.g., population, freshwater, climate, disaster, and health) at various spatial levels, including global, national, and regional scales.
National Hydrography
https://www.usgs.gov/core-science-systems/ngp/national-hydrography/nhdplus-high-resolution
National Hydrography provides the National Hydrography Dataset Plus High Resolution (NHDPlus HR; https://pubs.usgs.gov/fs/2020/3033/fs20203033.pdf), which contains the national-scale geospatial data of water flowing or standing on the Earth's surface (e.g., creeks, streams, rivers, and lakes) and their drainage areas (e.g., catchments, watersheds, and basins). The water flow line is prepared in a vector format (i.e., polylines), and the watershed boundaries are in a raster format (10 m resolution).
TIGER/Line Shapefiles
https://www.census.gov/geographies/mapping-files/time-series/geo/tiger-line-file.html
The US Census Bureau uses the TIGER/Line Shapefiles to store geographic and cartographic information from the US Census Bureau's Master Address File/Topologically Integrated Geographic Encoding and Referencing (MAF/TIGER) database. The TIGER/Line Shapefiles are prepared in vector formats (e.g., lines and polygons), and they include the spatial information (i.e., center lines or boundaries) of states, counties, blocks, school districts, ZIP code tabulation areas, congressional districts, urban areas, coastal lines, water, roads, rails, and landmarks (Hochmair and Zielstra 2014).
Florida Department of Environmental Protection ArcGIS Online Organization
https://fdep.maps.arcgis.com/home/index.html
The Florida Department of Environmental Protection (FDEP) ArcGIS Online Organization is a collection of geospatial data that show the locational information of programs and activities implemented to protect Florida's environment. A user can view the locations and measurements of stations that monitor water quality, groundwater, and algal bloom sampling. Information on the coral reef in southeast Florida and the FDEP Trend Monitoring Network—Surface Water Trends is also available.
Miscellaneous Collection
ArcGIS Hub
ArcGIS Hub provides a wide variety of GIS datasets worldwide. It is maintained by the Environmental Systems Research Institute (ESRI), the largest commercial supplier of GIS software, ArcGIS.
Global Map Github
The International Steering Committee for Global Mapping (ISCGM) stores various types of global-scale GIS data in the Global Map Github, including elevation, land use, and land cover.
Geographic Information System (GIS) Software
ArcGIS
https://desktop.arcgis.com/en/arcmap/
ArcGIS is a commercial GIS software program maintained by the Environmental Systems Research Institute (ESRI). ArcGIS is commercial software ($100/year for personal and student use; https://www.esri.com/en-us/arcgis/products/arcgis-online/buy). Plenty of extension tools and open data sources are available for geospatial analysis with ArcGIS. ArcGIS is available to scientists, staff, and students working at educational institutions, including the University of Florida, through university license agreements. The ArcGIS desktop software runs under the Windows operating system.
QGIS
https://qgis.org/en/site/forusers/download.html
QGIS is a free and open-source GIS software program maintained by volunteer developers (Flenniken, Stuglik, and Iannone 2020). QGIS runs on various operating platforms, including Windows, Linux, Mac OS, and Android. There are many publicly available packages and plugins for geospatial analysis in QGIS, similar to ArcGIS extension tools.
Resources for Learning GIS
GIS LOUNGE
https://www.gislounge.com/learning-gis-resources-for-gis-training/
GIS LOUNGE introduces useful resources, including web-based tutorials and free electronic books, that can help users learn how to handle and analyze geospatial data using GIS software.
Learn ArcGIS
https://learn-arcgis-learngis.hub.arcgis.com/
https://learn.arcgis.com/en/gallery/
Learn ArcGIS is maintained by ESRI, the company that developed the ArcGIS software. Learn ArcGIS provides a variety of content designed for ArcGIS users who have different proficiency levels in geospatial data and analysis, such as new users, GIS professionals, data scientists, students, and teachers.
MITOPENCOURSEWARE: Introduction to GIS
MITOPENCOURSEWARE shares workshop presentations, instructions for working with ArcGIS and QGIS, and sample data for practice.
GIS Online Courses
https://www.geo.university/pages/gis-online-courses
GIS Online Courses provide various types of online resources that can help GIS users to improve their analysis skills. Users need to pay to access each of the courses, and the fee ranges from $10 to $50.
QGIS Training Manual
https://docs.qgis.org/3.16/en/docs/training_manual/index.html
The QGIS Training Manual is the set of instructions for using the QGIS software.
Summary
Sensing technologies and geosciences are advancing and producing a large amount of data about people and the places where we live. Geographic information is expected to become more useful in many areas. Our data-abundant future will demand the ability to access and analyze geospatial information and data. The data and tools introduced in this publication will help Extension agents and specialists explore areas of interest and gain knowledge of the spatial characteristics required to address their stakeholders' needs. The data sources can be selected considering the precision (i.e., resolutions for grid data or scales for vector data) and coverage of geospatial data of interest. Each of the geospatial layers introduced in this article is unique from others in terms of the themes, types, precisions, and coverages. The best use of the layers requires an understanding of the layers' characteristics.
References
Flenniken, J. M., S. Stuglik, and B. V. Iannone. 2020. Quantum GIS (QGIS): An Introduction to a Free Alternative to More Costly GIS Platforms. FOR359. Gainesville: University of Florida Institute of Food and Agricultural Sciences. https://edis.ifas.ufl.edu/fr428
GIS Geography. 2020. "10 Free GIS Data Sources: Best Global Raster and Vector Datasets [2020]." Accessed on May 21, 2020. https://gisgeography.com/best-free-gis-data-sources-raster-vector/
Google Earth Engine. 2020. "Google Earth Engine – FAQ." Accessed on October 21, 2020. https://earthengine.google.com/faq/
Hochmair, H. H., and D. Zielstra. 2014. An Introduction to Freely Available Street Network Data. FOR281. Gainesville: University of Florida Institute of Food and Agricultural Sciences. https://edis.ifas.ufl.edu/fr343
USDA. 2020. "CropScape – Cropland Data Layer – Ag Data Commons." Accessed on May 25, 2020. https://data.nal.usda.gov/dataset/cropscape-cropland-data-layer
USGS. 2020. "The National Map – National Geospatial Program." Accessed on May 25, 2020. https://www.usgs.gov/core-science-systems/national-geospatial-program/national-map