Introduction
Knowing and understanding the details of fatal incidents is critical to developing education and intervention programs to prevent future incidents. This report summarizes fatal agricultural injury incidents in Florida between 2010 and 2019. This data is important for describing the size and characteristics of agricultural fatalities, populations at risk, risk factors, and temporal and spatial trends in injury rates.
The purpose of this report is to analyze fatal Florida agricultural injury incidents for 2010 through 2019. This report could help in the design and application of agricultural safety interventions and educational programs, promote awareness of agricultural hazards and safety practices, and inform Agricultural Safety and Health personnel, educators, Extension personnel, communicators, and stakeholders.
The 2019 Census of Fatal Occupational Injury (CFOI) data shows that the Agriculture, Forestry, and Fishing (AgFF) industry was the most hazardous industry in the United States, with a work-related fatality rate of 23.1 per 100,000 full-time equivalents (FTEs) (BLS 2021a). This was almost seven times the all-industry average of 3.5 fatalities per 100,000 workers. For Florida in 2019, the state annual work-related fatality rate for AgFF was at 17.8 deaths per 100,000 FTEs (BLS 2021b). The Bureau of Labor Statistics (BLS) CFOI collects occupational fatalities in all US industries; however, BLS’s surveillance does not include many categories (e.g., roadway fatalities resulting from an agricultural vehicle, or nonworking bystanders injured in an agriculture-related incident) of fatalities that occur as work is happening and/or on production agriculture worksites.
Method
Death certificates from the Florida Department of Health, Bureau of Vital Statistics served as the data source in this study. Case selection was based on the assigned industry, injury location, and International Classification of Disease (ICD) codes. Cases where the injury locations included farms, ranches, fields, pastures, and groves were only included in the dataset if the decedents’ work was related to agriculture. Additionally, deaths caused by agricultural machinery and agricultural chemicals, regardless of the location, were reviewed.
In the dataset, manner of death was used to categorize the cases. The manner of death categories were accidents, natural causes, suicides, or “undetermined.” In this report, we used “unintentional incidents” instead of “accidents.” ”Accident” usually refers to an unpredictable occurrence or a random event. Since injuries are not random (i.e., they have identifiable risk factors), the term “accident” should be avoided.
Florida growers depend on a significant number of seasonal and migrant farmworkers to grow and harvest their crops, and most of these seasonal and migrant farmworkers are Hispanic. Hispanic ethnicity assignment was based on the definition by the National Institutes of Health (NIH 2015). Frequencies, descriptive statistics, and cross-tabulations with chi-square analysis were used to analyze the data and to determine significant relationships (p<0.05). All analyses were performed using IBM SPSS® Statistics V.26. This project is exempt from Institutional Review Board (IRB202002203) review.
Results
Our analysis showed that there were 263 agricultural fatalities in Florida from 2010 to 2019. Table 1 shows the number of deaths by manner of death, number of farms, and death rate per 10,000 farms each year for 2010 through 2019. The number of deaths ranged between 19 and 32. Overall, the average yearly death rate was 5.54 deaths per 10,000 farms during this study period.
Table 1. Number of agricultural deaths and death rates: 2010–2019.
Unintentional Incidents
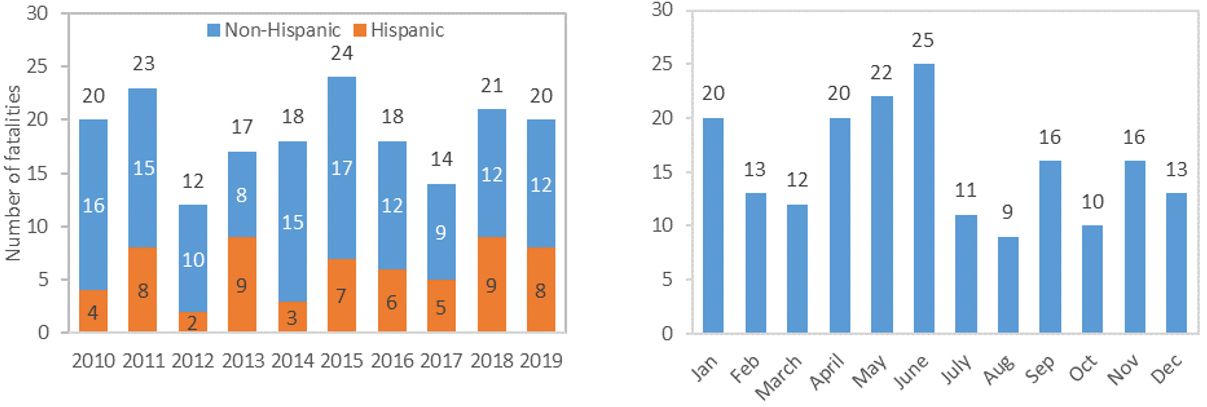
There were 187 unintentional deaths during the study period. Figure 1 explains the number and distribution of agricultural deaths (Figure 1a shows annual death numbers). Sixty-one victims (33% of the total) were identified as Hispanic. There was no information to identify if any of the deceased were migrant or seasonal workers. Figure 1b shows monthly distribution of the fatalities. Fatalities were highest in May and June. The year-round fatality trend follows Florida’s production seasons. During the winter and spring, tomatoes, bell peppers, melons, and watermelons are harvested, and harvesting is heavily dependent on manual labor.

Credit: Serap Gorucu, UF/IFAS
Of the 187 unintentional fatalities, approximately 91% (n=171) were males. Victims’ ages ranged from 3 to 94 years old. The mean age of victims was 47.8 years. The mean age for females was 31.5 years, while for males it was 49.3 years. Children under the age of 18 accounted for 8% of the fatalities (n=15), and adults who were 65 and older accounted for 24% (n=45) of the fatalities. The proportion of female victims under 18 was significantly higher than the proportion of females in the other age categories (Chi-square=16.692, df=6, p<0.01).

Credit: Serap Gorucu, UF/IFAS
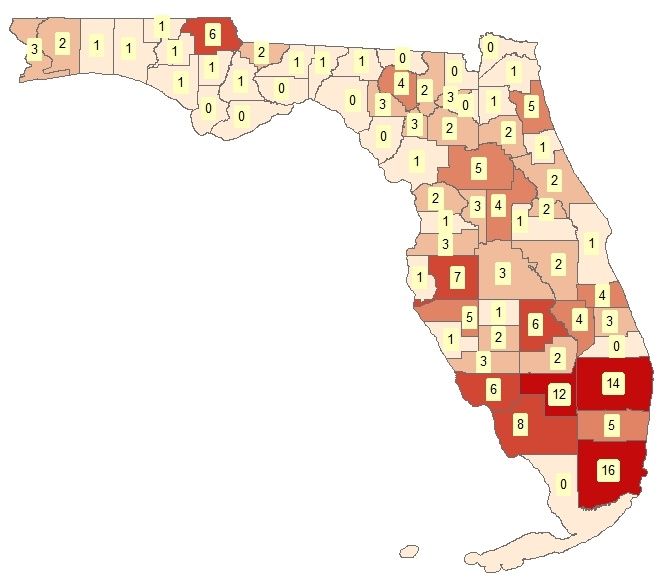
The following map shows the number of unintentional agricultural fatalities by county (Figure 3). Miami-Dade County reports the highest number of agricultural fatalities with 16 fatalities, followed by Palm Beach County (n=14), Hendry County (n=12), Collier County (n=8), and Hillsborough County (n=7).

Credit: Serap Gorucu, UF/IFAS
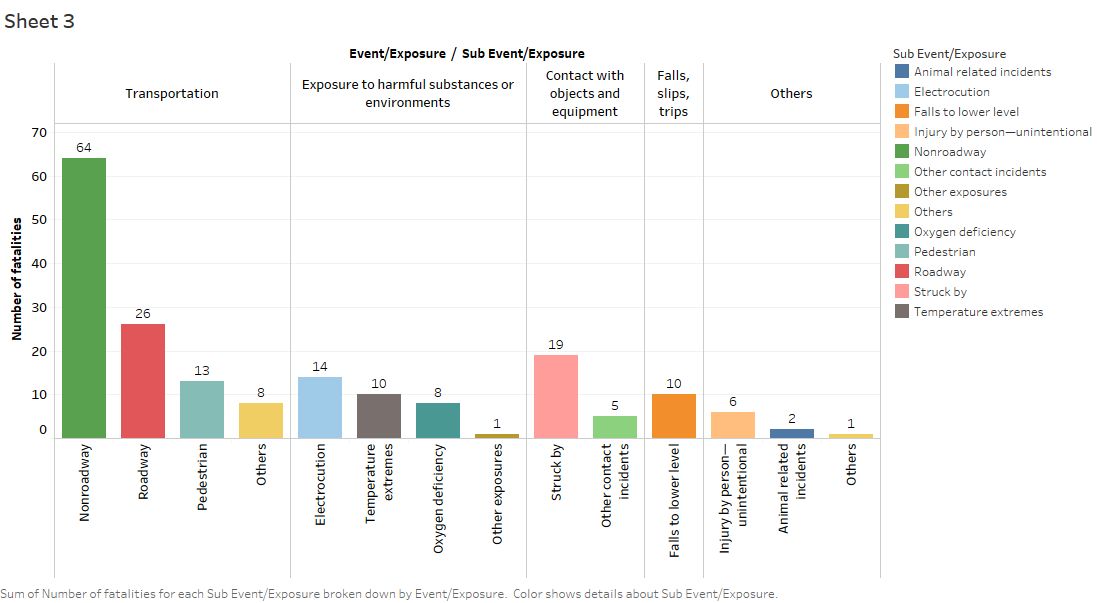
Injury event characteristics of fatal agricultural injuries during the study period are shown in Figure 4. Fifty-nine percent of all decedents were killed in transportation-related incidents. Most transportation incidents were nonroadway (i.e., away from public roadways) incidents. Examples include victims falling from a tractor, becoming pinned under an overturned tractor, and being struck by an object/vehicle in fields, ranches, pastures, or at other agricultural sites. Roadway transportation incidents involved tractors, pickup trucks, all-terrain vehicles (ATVs), or heavy trucks. Additionally, 13 bystander pedestrians died as a result of a vehicular incident.
Exposure to harmful substances and environments killed a total of 33 victims. Fourteen victims were killed by lightning (n=4) or high-voltage power lines (n=10). Nine victims were killed as a result of excess heat exposure, one victim was killed after inhaling combustion gases, one victim was fatally burned when he was draining fuel from a tractor, and eight victims drowned (oxygen deficiency).

Credit: Serap Gorucu, UF/IFAS
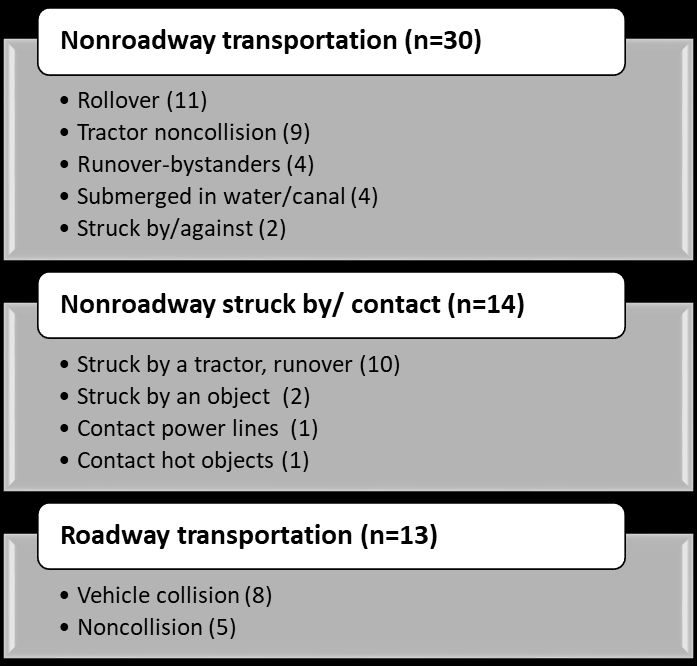
Tractors were the leading cause of 57 fatalities (30%) (Figure 5). Twenty-eight victims (40%) were age 65 and older. More than half of the fatalities resulted from nonroadway transportation incidents (53%, 30 of 57). Other nonroadway incidents include victims who were run over by a tractor, struck by an object (hay bale and hoist), and contacted by hot objects and power lines. Roadway incidents were mostly collisions with other vehicles.

Credit: Serap Gorucu, UF/IFAS
There were 22 victims who were killed in an ATV or Utility Terrain Vehicle (UTV)-related incident. Fifty percent (n=11) of these victims were under 18, and 82% (n=18) were males. Sixteen victims were operators, and the rest were either passengers or listed under the unknown category. Helmet and protective gear information was not available for these incidents.
Drug- and alcohol-related fatalities were extracted from the injury narratives and ICD codes. During the study period, there were 229 victims listed as fatalities of accidental drug or alcohol poisoning whose industry was also listed as agriculture (i.e., farm, nursery, animal farming, horticulture). Only five of these victims were included because their injury location was listed as on-farm.
Suicides and Homicides
There were 258 suicides and 153 homicides whose industries were listed as agriculture. Only the cases in which the location was listed as a farm were included in this report (57 suicides and 18 homicides). Among those who committed suicide (n=57), victims’ ages ranged from 17 to 88. Ten of the victims were female, and seven of them were Hispanic. A firearm was used in most suicide (68.4%) and homicide deaths (83%).
Summary
This report provided valuable information on fatal agricultural injuries in Florida. The information summarized in this report may be used to design and apply agricultural safety interventions and education programs, and to promote awareness of agricultural hazards.
Key findings from this study include the following.
- Older adults (65 years and older) had the highest risk of fatal agricultural injuries. This age group accounted for 24% (n=45) of all fatalities from 2010 through 2019.
- Sixty-one (33%) Hispanic victims died due to unintentional agricultural incidents.
- Almost 59% of the victims (n=110) died in transportation incidents.
- Tractors were the leading cause of unintentional agricultural deaths (30%, n=57).
- Tractor-related fatalities mostly involved members of the 65 years and older age group.
References
BLS. 2021a. “Number and Rate of Fatal Work Injuries, by Industry Sector.” Accessed on May 24, 2021. https://www.bls.gov/charts/census-of-fatal-occupational-injuries/number-and-rate-of-fatal-work-injuries-by-industry.htm
BLS. 2021b. “Fatal Injury Rates by State of Incident and Industry, 2019.” Accessed on May 24, 2021. https://www.bls.gov/iif/oshwc/cfoi/staterate2019.htm
NIH. 2015. “Racial and Ethnic Categories and Definitions for NIH Diversity Programs and for Other Reporting Purposes.” Accessed on May 24, 2021. https://grants.nih.gov/grants/guide/notice-files/not-od-15-089.html
USDA NASS. 2021. “USDA's National Agricultural Statistics Service Florida Field Office: Annual Statistical Bulletin.” Accessed on May 24, 2021. https://www.nass.usda.gov/Statistics_by_State/Florida/Publications/Annual_Statistical_Bulletin/index.php