Introduction
Transportation, often via trucks, is required to get food from the farm to the grocery store. Transportation is particularly important for products like fresh produce, which must be moved quickly (often on refrigerated trailers) to prevent it from spoiling. New developments in driver safety legislation, namely the electronic logging device (ELD) mandate from the Federal Motor Carrier Safety Administration (FMCSA), have the potential to significantly affect trucking costs for agricultural producers. This article uses truck shipment data to analyze transportation costs and identifies potential future effects of the ELD mandate.
The Electronic Logging Device Mandate
The ELD mandate is being implemented in two steps. The first step, called ELD rule implementation, took effect on December 18, 2017. Currently, "All carriers and drivers subject to the ELD rule must use either an ELD or an AOBRD (automatic on-board recording devices) compliant with existing regulations" (FMSCA 2017a). On December 16, 2019, all commercial motor vehicles (CMV) required to record hours of service (HOS) began to be mandated to carry electronic logging devices (FMSCA 2017b, FMSCA 2016). These ELDs replace paper logs and attach to the trucks' engines. There, they easily record idle time, driving time, miles driven, vehicle movement, and off- and on-duty time; making it easier for law enforcement to check if drivers are compliant with HOS rules. It is possible to manipulate paper logs, and there are cases of operators keeping separate paper logs for law enforcement and their own records.
The mandate is the Department of Transportation's latest attempt to improve road safety by ensuring that all CMV drivers (including those who transport citrus and citrus products) are compliant with HOS rules. Increased rates of compliance increase road safety but also increase travel time. Additional travel time can negatively impact the transport of fresh produce. For example, time spent accommodating unavoidable delays from unpredictable loading and unloading times, unexpected traffic, and parking searches are included in on-duty hours and results in delayed deliveries and increased risk of losing produce. Delays can increase costs for long-haul trips, which are essential to the citrus industry given that fresh fruit and juice originate in few states (California, Florida, and Texas) and are transported nationally. This article discusses the HOS rules and exemptions, as well as the cost of transporting citrus across the country.
Hours-of-Service (HOS) Rules
The first HOS rules were developed in 1937 and have always been a point of contention between the road transportation industry and those who advocate for highway safety. The rules are designed to reduce driver fatigue and improve road safety by restricting the number of hours that CMV operators spend on duty and driving. The rules have changed over time (see Roka, Wade, and Sprouse [2018] and Yager [2009]), but the current rules, listed below, have been in effect since 2015 (FMSCA 2017c).
- CMV drivers may drive a maximum of 11 hours after 10 consecutive hours off duty;
- CMV drivers may not drive beyond the 14 consecutive hour of being on duty following 10 consecutive hours off duty;
- on duty includes loading;
- a 30-minute rest break after 8 hours of driving is required; and
- CMV drivers may not drive after 60/70 hours on duty in 7/8 consecutive days.
Exemptions
There are exemptions to the rule requiring ELDs on CMV (FMCSA 2018):
- CMV drivers who use paper logs for no more than 8 days out of every 30-day period;
- CMV drivers who are required to keep HOS records for no more than 8 days within any 30-day period;
- drivers of CMVs manufactured before year 2000; and
- CMV drivers who conduct drive-away-tow-away operations, where the vehicle being driven is the commodity being delivered, or the vehicle being transported is a motor home or a recreation vehicle trailer with one or more sets of wheels on the surface of the roadway.
Agriculture does have an additional exemption that other groups do not: CMV drivers who haul "agricultural commodities" or "farm supplies for agricultural purposes" are exempt from HOS rules within 150 air miles (or 172 ground miles) of the "agricultural source" (FMCSA 2018). Here, an "agricultural commodity" refers to a crop, non-processed food, feed, fiber, or livestock (including fish, bees, and insects); "farm supplies" refers to products directly related to the growing or harvesting of agricultural commodities during the planting and harvesting seasons; and "agricultural source" refers to the location at which an agricultural commodity is loaded onto an empty CMV (Roka, Wade, and Sprouse 2018). Note that orange juice is a processed food, so juice haulers are subject to all HOS rules.
The 150 air-mile exemption may work well for haulers making local trips, but 172 ground miles is well short of the average long-haul trip from citrus-producing states to other regions (about 1,740 miles; see Table 1). Table 1 shows typical mileage and expected travel times for trips originating from California, Florida, and Texas. The travel time estimates assume a non-compliant driver will spend 15 hours driving and a compliant driver will spend 11 hours driving, but they do not account for multiple stops. Travel time also includes four hours for preparing and loading the trucks. We see that travel time increases for drivers who are compliant with HOS rules, ranging from 16% for trips from California to Washington or from Florida to Pennsylvania to over 100% increase for those traveling from Florida to Georgia. Though Florida to Georgia is the shortest trip in terms of travel time and distance, 14 hours of on-duty time and 30-minute breaks triggers a 10-hour rest period that significantly extends the trip. The degree to which each trip is affected depends on the time during the trip where rest periods are required to remain compliant. Excluding Florida to Georgia, compliance with HOS rules are estimated to increase trip times by 35%, on average. In the following section, we examine the cost of transporting citrus in the United States but make no assumptions of compliance.
Effects on Citrus Industry
The new mandate will increase travel times for those in the transportation industry who were not previously compliant. This may directly affect travel times for citrus products. However, it is difficult to predict if this will affect transportation costs. The typical payment structure accounts for the load and distance but not the time it takes to make deliveries. This makes unexpected delays, such as delays in loading, traffic, and stops more costly. Increased transportation costs may also be related to driver shortages. In 2017, the chief economist and senior vice president of the American Trucking Associations, Bob Costello, predicted a shortage of over 174,000 drivers by 2026. Some in the transportation industry speculate that the mandate will drive smaller freight companies out of the transportation industry, exacerbating the shortage issue and increasing prices; however, others believe that shortages existed before the mandate, and they will continue after the mandate. Instead, they blame shortages on a dearth of the right kind of drivers in the workforce because of strict hiring policies based on CMV driving experience, accident record, and the appropriate license (say for liquid juice versus fresh fruit) that limit the candidate pool (Costello 2017). Therefore, the effect of ELDs on transportation costs is a subject of debate.
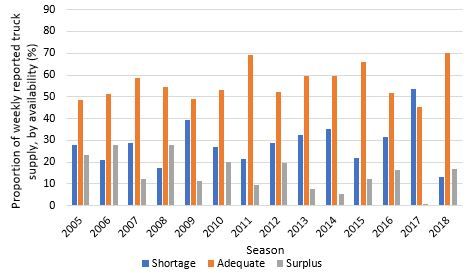
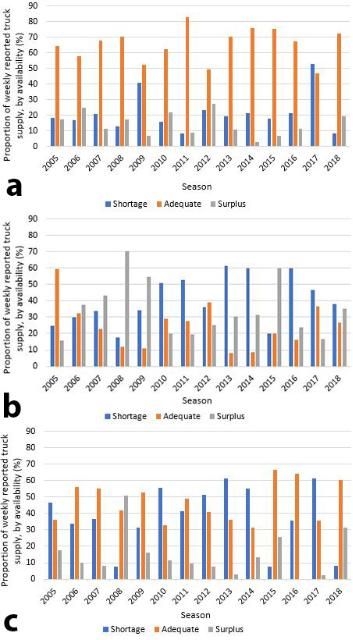
The US Department of Agriculture, Agricultural Marketing Service (AMS) provides weekly categorical driver shortage information ranging from "severe shortage" to "surplus" for specialty crops, when available. Figure 1 reports the percentage of weeks that fall into "shortage," "adequate," and "surplus" categories for the country during typical citrus harvest seasons (October to June). Nationwide, all seasons, except 2017, show that truck supply is mostly adequate with surpluses being relatively rare: 2008 reports the highest surplus at 28% of weeks. These data tell a different story for Florida (Figure 2b), where we see more instances of shortages and surpluses than adequate supply in the 2010, 2011, 2013, 2014, and 2016 seasons. Florida reported more weeks with shortages than combined adequate and surplus supply in those seasons. Texas shows similar results with shortages exceeding adequate and surplus supply in 2010, 2012, 2014, and 2017. It is likely that these swings will be reflected in weekly truck rates, but rates will appear to be far less dramatic when the entire season is examined.
Credit: US Department of Agriculture, Agricultural Marketing Service, Truck Rate Report (https://www.ams.usda.gov/market-news/fruits-vegetables)
Credit: US Department of Agriculture, Agricultural Marketing Service, Truck Rate Report (https://www.ams.usda.gov/market-news/fruits-vegetables)
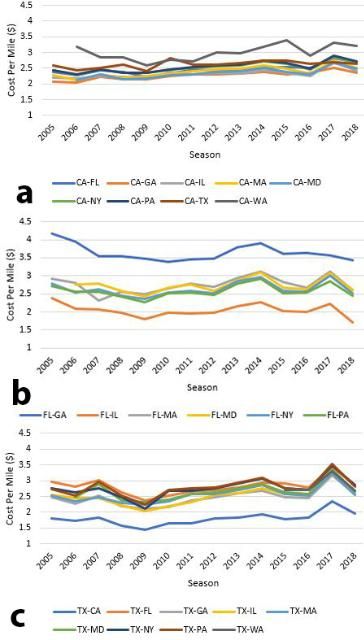
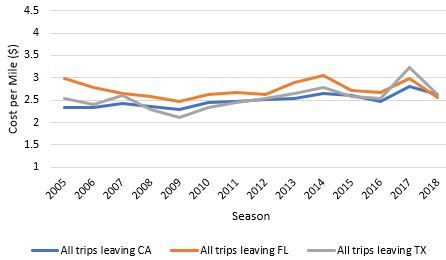
Figures 3a–3c illustrate the per-mile cost of transporting fresh produce from citrus-producing states over time using the previously mentioned AMS data. AMS cost estimates assume open market shipping costs (including brokers' fees) based on a single load to a single destination. Rates are based on typical loads in 48-foot to 53-foot refrigerated trailers from the origin shipping district to the destination receiving city (Willkie 2019) and were converted to 2018 dollars by adjusting for inflation using the producer price index (PPI). It should be noted that the shipping rates are quoted for specific city destinations; however, this state-level analysis chooses a central location within the state for creating per-mile estimates (Table 1). All citrus-producing states show a general increase in cost from the 2005 to 2017 seasons. The 2018 season shows an 13% drop in costs from the 2017 season ($3.00 per mile in 2017 and $2.61 per mile in 2018; not shown in figures) which is consistent with the 40% drop in the number of shortages from the 2017 season (shortages were observed in 54% of weeks in the 2017 season and 13% of weeks in the 2018 season). The figures also show that per-mile prices are clustered where mileage is similar. However, it should be noted that closer distances, though they will have a lower total cost, will have a higher per-mile cost, relative to other locations (see, e.g., Florida to Georgia in Figure 3b). Figure 4 illustrates the state average per-mile cost. On average, per-mile costs from Florida ($2.73) are higher than those from California ($2.49) and Texas ($2.55), though total costs are expectedly lower because Florida is substantially closer to eastern markets.
Credit: US Department of Agriculture, Agricultural Marketing Service, Truck Rate Report (https://www.ams.usda.gov/market-news/fruits-vegetables)
Credit: US Department of Agriculture, Agricultural Marketing Service, Truck Rate Report (https://www.ams.usda.gov/market-news/fruits-vegetables)
The 2018 cost estimates show an increase in per-mile costs over time. This is likely due to shortages caused by stringent hiring policies and drivers preferring shorter trips. While the ELD mandate will increase travel time, there is no clear indication that it will affect already-rising transportation costs. There are, however, other costs that the mandate may affect that are not addressed here: increased food waste due to increased contamination risks because citrus products will be in transit for longer periods, increased refrigeration costs because drivers will be off duty for longer periods, increased CO2 emissions related to refrigeration costs, increased pair driving to ensure on-time deliveries, and possible changes in rate structures to reflect longer travel times to attract more drivers to the industry. Because the mandate has not been in effect for very long, we can only speculate about the effect the new policy will have on transportation costs.
Summary
The ELD mandate is a contentious piece of legislation that directly affects the road transportation industry, and as a result it can potentially have indirect impacts on several other sectors of the US economy. This paper uses current data collected from trucking routes across the country to examine the current status of the transportation industry and to determine the present and future effects of the ELD mandate. In particular, the analysis focuses on citrus transportation due to its relevance to Florida agriculture.
A few major points emerge from the analysis. The first is that trucking costs have been increasing over time, even adjusting for inflation. This trend is consistent with transportation industry reports of increasing worker shortages. As fewer CMV drivers are available to transport products, shipping prices will continue to rise. Second, because of this increasing trend in trucking rates, it is difficult to determine with certainty whether the ELD mandate has had a direct and significant effect on rates thus far. A qualitative analysis of trucking rates finds a small increase in rates around 2017, but further quantitative analysis is necessary to prove this relationship.
It is important to remember that the ELD mandate did not go into full implementation until December 16, 2019. Shortly thereafter, the COVID-19 pandemic highlighted inefficiencies in the food supply chain as well as the importance of the transportation industry to the US economy. HOS rules were relaxed in an attempt to get critical items to markets as quickly as possible while CMV drivers were designated essential and lauded as heroes. This created sharp but brief increases in transportation prices, and for some smaller fleets the current prices are too low to sustain their businesses (Smith 2020). The trucking industry had a regulatory change that was quickly followed by the COVID-19 pandemic, and how these shocks affect truck supply and costs will need to be carefully examined in the near future. Looking forward, it will be interesting to see the full effect of the legislation after the expiration of the pandemic-related HOS waivers. It is possible that compliance has been deferred or adhered to more cheaply (and therefore has not affected costs) until this point. The authors of this paper intend to revisit the subject with a follow-up paper in the coming years.
Acknowledgements: The authors thank Shelly Goodwin for her assistance with data collection as well as Ozgur Batuman and Mark Ritenour for their useful comments.
References
Costello, Bob. 2017. "Truck Driver Shortage Analysis." Prod. American Trucking Associations. Available at https://jbatelematics.com/wp-content/uploads/2017/11/ATAs-Driver-Shortage-Report-2017.pdf
Federal Motor Carrier Safety Administration (FMSCA). 2018. "Electronic Logging Devices and Hours of Service Supporting Documents, Frequently Asked Questions." Available at https://www.fmcsa.dot.gov/sites/fmcsa.dot.gov/files/docs/regulations/hours-service/elds/74541/eldrulefaqs-mar2018.pdf
Federal Motor Carrier Safety Administration (FMSCA). 2017a. "ELD Brochure - English Version." October 31, 2017. Available at https://www.fmcsa.dot.gov/hours-service/elds/eld-brochure-english-version
Federal Motor Carrier Safety Administration (FMSCA). 2017b. "Implementation Timeline." August 31, 2017. Available at https://www.fmcsa.dot.gov/hours-service/elds/implementation-timeline
Federal Motor Carrier Safety Administration (FMSCA). 2017c. "Summary of Hours of Service Regulations." March 9, 2017. Available at http://www.fmcsa.dot.gov/regulations/hours-service/summary-hours-service-regulations
Federal Motor Carrier Safety Administration (FMSCA). 2019. "The 'Agricultural Commodity' Exception in 49 CFR 395.1(k)(1) to the Hours of Service Regulations." November 2019. Available at https://www.fmcsa.dot.gov/regulations/hours-service/%E2%80%9Cagricultural-commodity%E2%80%9D-exception-49-cfr-3951k1-hours-service-regulations
Roka., F., and T. Wade. 2019. Electronic logging devices (ELDs) mandate and hours of service (HOS) for produce haulers. FE1052. Gainesville: University of Florida Institute of Food and Agriculture. https://edis.ifas.ufl.edu/publication/fe1052
Smith, J. 2020. "For America's small truckers, demand is 'falling off a cliff.'" The Wall Street Journal, Logistics Report. Available at https://www.wsj.com/articles/for-americas-small-truckers-demand-is-falling-off-a-cliff-11587488511
Willkie, P. 2019. "Specialty Crops Truck Rate Report." US Department of Agriculture, Agricultural Marketing Service, Specialty Crops Programs, Market News Division: Volume L Number 38, Washington DC. Available at https://search.ams.usda.gov/mndms/2019/09/FV20190925WTRK.PDF#xml=https://search.ams.usda.gov/mnsearch/hiliteinfo.aspx?i=1&docid=FV20190925WTRK.PDF
Yager, T. 2009. "Commercial Motor Vehicle Drivers' Hours of Service: Background Information." Federal Motor Carrier Safety Administration, MCSAC presentation, December 7, 2009. Available at https://www.slideserve.com/Jims/commercial-motor-vehicle-drivers-hours-of-service