Introduction
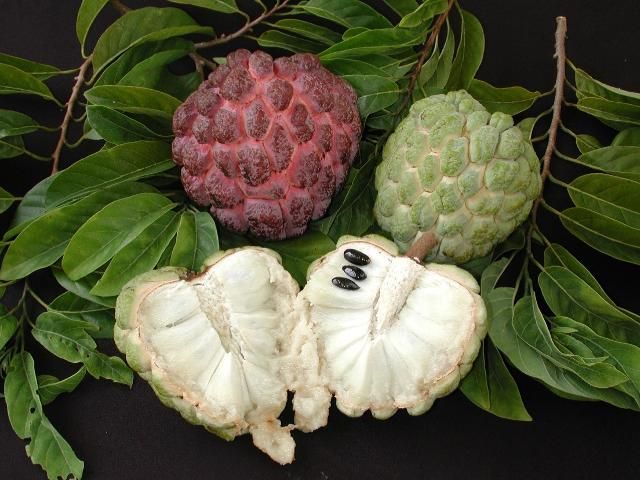
Sugar apple (Annona squamosa L.) is a member of the Annonaceae and is indigenous to tropical America. Trees are cold sensitive and do not tolerate freezing temperatures. Optimum climate conditions for sugar apple include warm to hot temperatures and high relative humidity during flowering and fruit set. Trees are small, and rarely exceed 15 to 20 ft. in height and spread. The pulp of sugar apple is white or creamy white with a custard-like consistency and sweet, pleasant favor (Crane, Balerdi, and Maguire 2016). Sugar apple fruit is fragile and has a short postharvest shelf-life; therefore, it is not shipped long distances. Small commercial industries occur in southern Mexico, parts of India, the West Indies and tropical lowland areas of Central and South America.

Credit: I. Maguire, UF/IFAS
The first US sugar apple introduction took place in 1955 when the 'Seedless Cuban' cultivar was introduced in Florida (Morton 1987). Because of climatic requirements, US commercial sugar apple cultivation is restricted to coastal central and southern Florida (Crane et al. 2016). In Florida, total sugar apple area is believed to be about 30 acres, with nearly all of it located in Miami Dade County (Crane et al. 2002).
The main sugar apple cultivars grown in Florida include: 'Thai Lessard' (a green type), 'Purple' or 'Red', and 'Kampong Mauve' (purplish-red types) (Crane et al. 2016). Sugar apple harvest season runs from mid-summer through fall. A mature sugar apple tree (5 years or older) yields 10 to 50 lbs. of fruit per year depending on the cultivar, prevailing climatic conditions, and cultural practices followed (Crane et. al. 2016).
Based on industry numbers, which include a planting density of 200 trees per acre, an average yield of 25 lbs. per tree, and an 80% fruit pack out rate, marketable yield per acre is about 4,000 pounds; therefore, Florida total sugar apple production would be about 120,000 pounds. At an average free on board F.O.B. Homestead price (i.e., the price at the packinghouse) of $2.00/pound, the crop is worth about $0.24 million at the packinghouse level.
Because of the growing interest in alternative tropical fruit crops to diversify farm income, this publication offers an estimate of costs and returns associated with operating an established sugar apple orchard in south Florida. The information presented was collected from field interviews with growers and industry specialists; it is representative of small sugar apple orchards (2–4 acres). The information in this document is intended only as a guide to estimate the financial requirements of running an already-established sugar apple grove. Readers interested in specific information about the cultural practices used in sugar apple cultivation may want to refer the EDIS document #HS38 (Sugar Apple Growing in the Florida Home Landscape) and contact their local UF/IFAS Extension agent.
Main Assumptions
The annual budget and cost of production are based on a one-acre orchard. Because of the diverse managerial styles and cultural practices followed, the present analysis reports the average costs and expenses reported by the growers interviewed. Given that most of the tropical fruit growers in south Florida own the land, a prevailing market land rental charge of $500/acre/year was taken into consideration to factor in the opportunity cost of the land.
Orchard Layout—Sugar apple crop plantings are spaced 15 feet between-rows and 15 feet in-rows, resulting in a planting density of 200 trees/acre (Crane et. al. 2016).
Yields—Based on the information provided by growers, average yield is estimated at 5000 pounds/acre/year; after factoring in a fruit packing rate of 80%, estimated marketable yield is about 4,000 pounds/acre/year.
Sugar Apple Prices—Average F.O.B. Homestead sugar apple price (price at the packing house) is estimated at $2.00/pound. This value is calculated from the prices growers received from the packing houses in 2016.
Irrigation—For optimum fruit production, irrigation is critical from flowering through fruit development stage (Crane et. al. 2016). Average irrigation expenses comprised of fuel or electricity cost are estimated at $150/acre/year.
Fertilization—Fertilizer treatments for mature trees (5 years or older) include applications of 8-3-9 or similar fertilizer material (nitrogen, phosphate, potash), soil-drench applications of chelated iron, and nutrient foliar sprays (zinc, magnesium, and manganese) (Crane et. al. 2016). Average fertilization costs (materials only) are estimated at $600/acre/year.
Pest Management—Pests of importance include the anona seed borer (Braephratiloides cubense), which may lead to fruit damage as the female lays eggs in young fruits, and plumose (Morganella longispina) and philephedra (Philephedra sp.) scales, which may cause damage to leaves and twigs, resulting in tree decline, stem dieback, and leaf drop. Fruit rots may be a major problem for sugar apple production and left untreated may result in near total crop loss (Crane et. al. 2016). Weed management practices include herbicide applications, hand weeding, and mulching. Estimated agrochemical costs (materials only) are as follows: insecticides $350/acre/year, fungicides $300/acre/year, and herbicides $300/acre/year.
Labor Costs—These include application costs for agricultural inputs (e.g., fertilizers and agrochemicals) and costs incurred for various cultural operations (e.g., irrigation, pruning, and mowing). Labor costs for a sugar apple grove are estimated at $800/acre/year.
Interest on capital—It is the cost of borrowing money or the opportunity cost for using equity. A rate of 5% was considered in the present analysis. Capital costs are estimated at $125/acre.
Fixed Costs—They refer to the costs incurred regardless of the level of the production. They include $200/acre for cash overhead costs (e.g., insurance and taxes), $500/acre for non-cash overhead costs (land rent and other overhead), and $450/acre for other overhead costs (e.g., machinery use, electricity, telephone, computer, and other miscellaneous office expenses).
Harvesting and Marketing Costs—Sugar apple harvesting season runs from mid-summer through fall; however, the length of the harvest season depends upon the specific cultivar (Crane et. al. 2016). The cost for picking, packing and marketing sugar apple is estimated at $1,400/acre/year.
Table 1 shows the expenses and returns associated with a full-production sugar apple grove
Production Costs (or variable costs)—Production costs are estimated at $2,625 (about $0.66 per pound), the major components among the pre-harvest variable costs include hired labor (30%), fertilizers (23%), insecticides (13%), and herbicides (11%), respectively.
Fixed Costs—These include cash overhead costs, non-cash overhead costs (land rental charge), and other overhead costs. Although growers own the land, a charge of $500 per acre is considered to reflect the opportunity cost of the land; total fixed costs are estimated at $1,150/acre/year ($0.29/pound).
Harvesting and Marketing Costs—Harvesting and marketing costs are estimated at $1,400/acre/year ($0.35/pound). The fruit needs to be harvested at the right maturity stage, or it will not ripen.
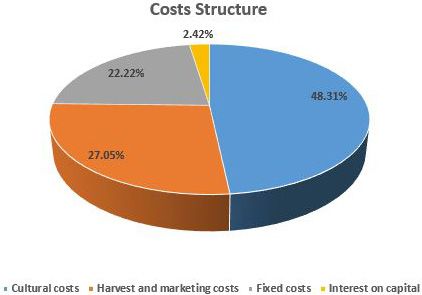
Figure 2 illustrates the magnitude of the costs by category and their respective share of the total. Cultural costs (variable costs for hired labor, irrigation, fertilization, and pest control) are the major cost drivers, accounting for 48.31% of total cost, followed by harvest and marketing costs that represent 27.05% of the total cost, then fixed or overhead costs at 22.22% of the total cost, and interest on capital at 2.42% of the total cost.

Returns and Profitability Analysis
The information provided in Table 1 shows that the total estimated cost to produce and market one acre of sugar apple is $5,175/acre/year ($1.29/pound). Assuming an average marketable yield of 4,000 pounds/acre and an average F.O.B Homestead price (at the packing house) of $2.00/pound, the total receipt or gross revenue is $8,000/acre/year.
Subtracting total variable cost (total production cost plus harvesting and marketing cost) from total revenue, we obtain a gross margin of $3,975/acre/year ($0.99/pound). The gross margin provides a useful indicator of short-term profitability of the farm operation. A positive gross margin indicates that all variable expenses have been met by the income generated and some portion of the fixed costs may be covered with the remaining additional funds.
A negative gross profit implies that a business is not economically feasible in the short term, and changes are needed to continue operating. While the gross margin provides an indication of the economic return to the grower in the short run, it does not include the fixed costs; therefore, it is not a reliable indicator of the business viability in the long term.
Net return is obtained by subtracting the fixed cost from the gross margin. It provides a measure of the long-term profitability of the farming operation. Table 1 shows a net return of $2,825/acre/year ($0.71/pound) for a sugar apple farm operation, which makes this tropical fruit crop an option to consider compared to other tropical fruit crops in the area.
Sensitivity Analysis
Table 2 presents a sensitivity analysis on a sugar apple farm operation based on the gross margin (gross profit), which considers the short-term viability of the farm operation. Under the best-case scenario, in which both price and yield are assumed to increase by 10%, gross margin per acre would increase from $3,975/acre to $5,655/acre. Under the worst-case scenario, in which both price and yield decrease by 10%, gross margin per acre would decrease from $3,975/acre to $2,455/acre. Price changes (keeping the production constant) have a similar effect on gross margin as quantity changes (keeping the price constant). It can be observed that a 5% increase in the base price (base yield, 4,000 pound) has an equal impact on gross margin ($400 more) as a 5% increase in yield (base price, $2.00/pounds) ($400 more).
Table 3 presents a similar analysis based on the net returns to a grower. Under the best-case scenario where both price and yield are assumed to increase by 10%, net return per acre would increase from $2,825/acre to $4,505/acre. Under the worst-case scenario, where both price and yield decrease by 10%, net return per acre would decrease from $2,825/acre to $1,305/acre. Other combinations of changes of prices and yields and their impacts on net return per acre are also shown in Table 3. The information presented in Table 3 can be interpreted in a similar manner to that presented for the Table 2. However, it should be noted that at the industry level, a noticeable increase in production usually results in a decrease in the price received by the growers.
Conclusions
The average net return obtained from an established sugar apple grove in south Florida is $2,825/acre, or $0.71/pound, which makes this minor tropical fruit crop an interesting option compared to other tropical fruit crops grown in the area to diversify farm income. However, it is important to keep in mind that the information presented here is related to an already-established grove. We have not considered the financial costs for establishing a new sugar apple grove, which include land acquisition and development, planting costs, amortized capital costs, etc. Therefore, the reader should interpret these results with caution.
There are several factors holding back expansion of this crop; first, the fruit has a very short shelf life, restricting marketing opportunities out of the state. Additionally, the crop's sensitivity to cold climate restricts planting area to south Florida (Bowman 2015). There is no evidence that US demand for the fruit will increase significantly in the short term. The market for sugar apple is still a niche one that consists of mainly of the Asian and Hispanic groups. However, the demand by these groups has not been met with current production.
References
Bowman, K. D. 2015. Sugar apple emerges as tempting treat for Florida grower. Growing produce. http://www.growingproduce.com/fruits/sugar-apple-emerges-as-tempting-treat-for-florida-growers/
Crane, J. H., M. Aerts, and A. M. Mossler. 2002. Crop Profile for Atemoya and Sugar apple in Florida. https://ipmdata.ipmcenters.org/documents/cropprofiles/FLatemoyaandsugarapple2009.pdf
Crane, J. H., C. F. Balerdi, and I. Maguire. 2016. Sugar apple growing in the Florida Home Landscape. EDIS# HS38. Gainesville: University of Florida Institute of Food and Agricultural Sciences. https://edis.ifas.ufl.edu/mg330
Morton, J. 1987. "Sugar apple." In Fruits of Warm Climates. Published by Julia Morton, Miami FL. https://hort.purdue.edu/newcrop/morton/sugar_apple.html
USDA AMS. 2017. Agricultural marketing service. https://www.marketnews.usda.gov/mnp/fv-report-config-step1?type=termPrice