The purpose of this document is to provide guidance on the use of post-processing software to visualize data collected by unmanned aerial vehicles (UAVs) for agricultural applications. Post-processing software are used to process the UAV-collected data to create several types of maps, based on the application and type of sensor(s) used for data collection. These maps can include orthomosaics, 3D maps, digital elevation models, plant health or stress status maps (e.g., normalized difference vegetation index—NDVI maps), etc. There are several data processing and analysis software on the market; most of them require a subscription fee. The software mentioned in this document, Pix4Dmapper, has a one-time subscription fee of $1,990 for educational use and $4,990 for regular use. This document provides step-by-step instructions for using the data collected from a UAV flight to create several types of maps and indices.
Introduction
Remote sensing applications for agriculture often require periodically collected high-resolution data, which are difficult to obtain by manned flights or satellite imagery due to low resolution and high cost. Small unmanned aerial vehicles (UAVs) equipped with GPS (Global Positioning System) and various sensors can solve this problem by providing high-resolution data in less time and at low cost. They also have an added advantage of scheduling flexibility (Matese et al. 2015). Data collected from UAVs are processed using photogrammetry techniques to extract various vegetation indices such as the normalized difference vegetation index (NDVI), the green normalized difference vegetation index (GNDVI), and the soil-adjusted vegetation index (SAVI), which can be used to examine the vegetation vigor of a crop (Candiago et al. 2015). Díaz-Varela et al. (2015) and Feng et al. (2015) used orthomosaics created using photogrammetry techniques to assess olive tree crown parameters and map urban vegetation. Guan et al. (2019) successfully correlated high-resolution NDVI data with fertilizer application levels to identify differences in crop growth status. UAVs have been used in various instances to identify tree stress in citrus groves by utilizing a multispectral camera (Garcia-Ruiz et al. 2013), perform high throughput phenotyping in citrus (Ampatzidis and Partel 2019; Ampatzidis et al. 2019), and map the vigor of vineyards using NDVI maps (Matese et al. 2013). There are several other applications for data collected from UAVs. This document presents a step-by-step process for data processing to create orthomosaics, reflectance maps, and index maps using data collected from UAV flights.
Off Field Postflight
After you return from the field with the UAV-collected data, you must follow several steps in order to create various types of maps. Another document presents step-by-step preflight and flight instructions.
Collected Data
- Copy all the data from the memory card to the computer you are working on. It is recommended to have a backup of the data in another location.
- Check the collected data to verify if everything looks good (e.g., check the quality and resolution of the images).
- If collecting data for several fields, sort out all the data and arrange them into different folders based on the field numbers.
- Make sure you delete extraneous data. For example, when taking off with a sensor independent of the UAV, the sensor starts collecting data before takeoff and after landing until it is powered off. These data may not be useful to the mission, and deleting them can save some processing time. Another example is when the same flight covers two different areas that are far apart from each other. The data recorded between the blocks may not be useful and can be deleted.
Calibration
Almost every spectral sensor needs calibration. The manufacturer of the sensor usually supplies all the required tools. Following the calibration instructions and procedures is essential. If using a sensor that needs calibration, make sure you have the calibration values for each individual band on the spectrum you are using. In this case, you will always have to collect data pertaining to calibration before a flight mission. This information is usually collected before the start of the mission, or in some cases it is part of the data collected. The type of method depends on the manufacturer of the sensor. If these data are part of the data collected, the user will have to manually find them; otherwise, the data have to be collected before the flight. This information will be used in post-processing to calibrate the data.
We will be using the Pix4Dmapper (Pix4D, Prilly, Switzerland) software throughout this document as an example to explain the post-processing steps.
Step-by-Step Process
- Open the Pix4Dmapper software, and click New Project.
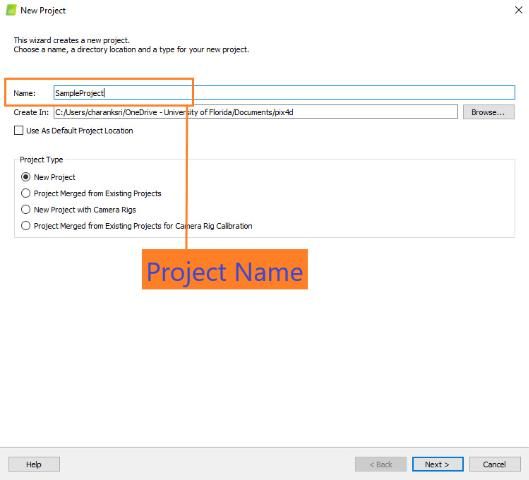
- After the New Project window opens, type in the name of the project, select the location you want to save it to, and click Next (Figure 1). These projects take a lot of disk space, usually around 3 GB per 50 acres, so make sure you have enough space in the intended location. It is recommended to use an external SSD (solid-state drive) or a cloud storage location since they have a large storage space (typically more than 256 GB). An external SSD also has the advantage of faster processing.
Credit: UF/IFAS
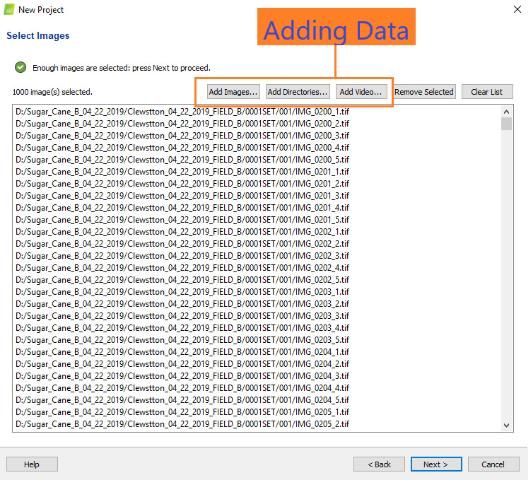
3. In the New Project window, you will have options to add: images, where you can select all the images you need for a project; directories, where you can add folders containing the collected data; and video of the collected data. After adding the collected data, click Next (Figure 2).
Credit: UF/IFAS
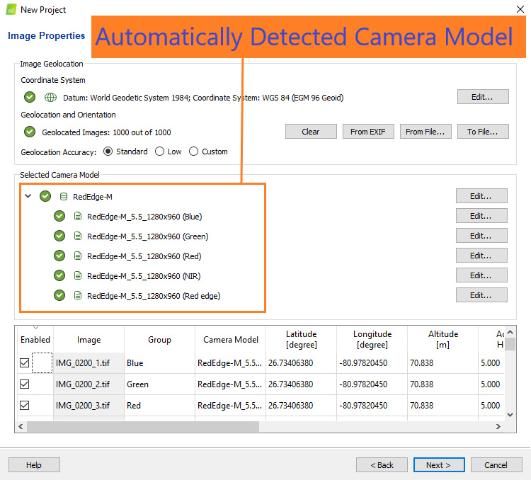
4. The software will automatically detect the sensor used and the coordinate system and geolocate them using the data stored in the images. Check to make sure everything is correct. Once everything looks good, click Next (Figure 3).
Credit: UF/IFAS
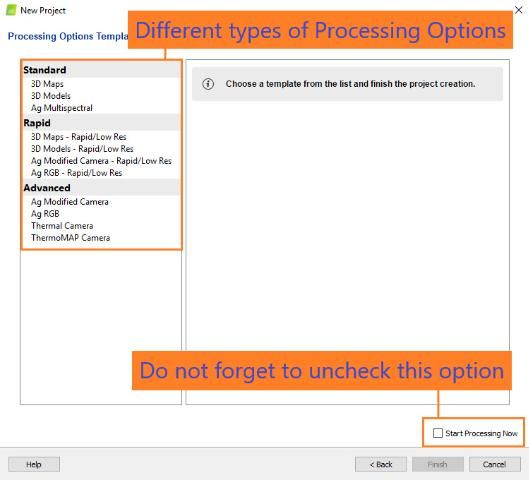
5. In this step, you will have to pick the type of map you want to create. There are several types of processing options available, such as 3D maps, Ag Multispectral, etc. Choose a type that best suits your application. As an example, we will be using Ag Multispectral in this document. After you select the processing option, make sure you uncheck the Start Processing Now option. Then, click Finish (Figure 4).
Credit: UF/IFAS
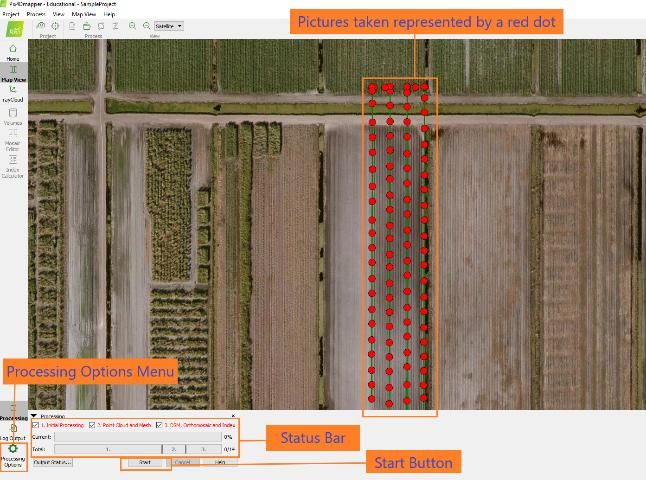
6. After processing, all your data will be arranged in a layer over a base of satellite imagery. Now, you can select individual images to check the file names and view them (Figure 5).
Credit: UF/IFAS
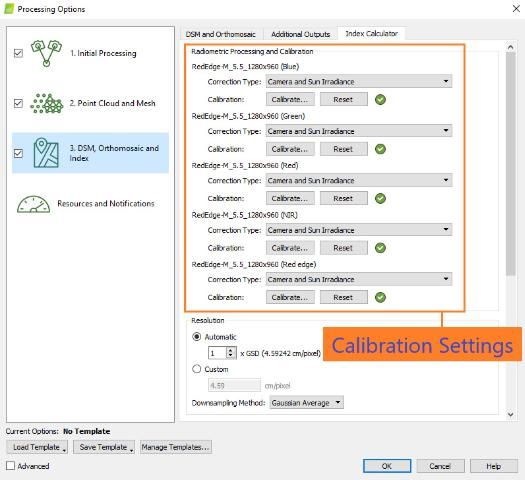
7. On the bottom left, click Processing Options, which opens a new window where you can find several processing settings (Figure 5—"Processing Options Menu" and Figure 6—"Calibration Settings").
8. In the Initial Processing tab, you will find options for Keypoints Image Scale and Quality Report. It is recommended to leave Keypoints Image Scale at its default setting. If you choose to get the quality report, keep it checked.
9. In the Point Cloud and Mesh tab, you will find options for different point cloud settings. Leaving them at their default setting is recommended if you are a beginner user. You can also select the type of outputs to be generated in the Export section for the desired point cloud output.
10. In the DSM, Orthomosaic and Index tab, you can find settings for Resolution, DSM Filters, Raster DSM, and Orthomosaic. It is recommended to leave them at their default setting unless you have a specific setting you want to choose. You will also find options to select the type of outputs you need under Additional Outputs. You can choose the types of outputs you need by checking them (Figure 6).
Credit: UF/IFAS
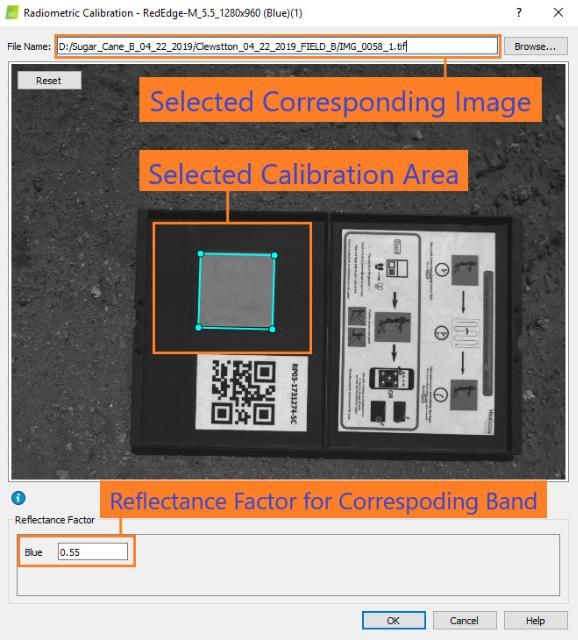
11. In the Index Calculator tab, you will find the Radiometric Processing and Calibration section. This is where you enter all your calibration data when required (Figure 6). For each individual band, you select the corresponding image taken before the mission and enter the corresponding reflectance factor. To do this, click Calibrate. When a new window opens, browse and select the corresponding image. Once it is loaded, draw the calibration area (highlighted in blue) using the cursor and enter the corresponding Reflectance Factor (Figure 7).
Credit: UF/IFAS
12. Once you have completed all of the above steps, you can click Start (Figure 5; "Start button").
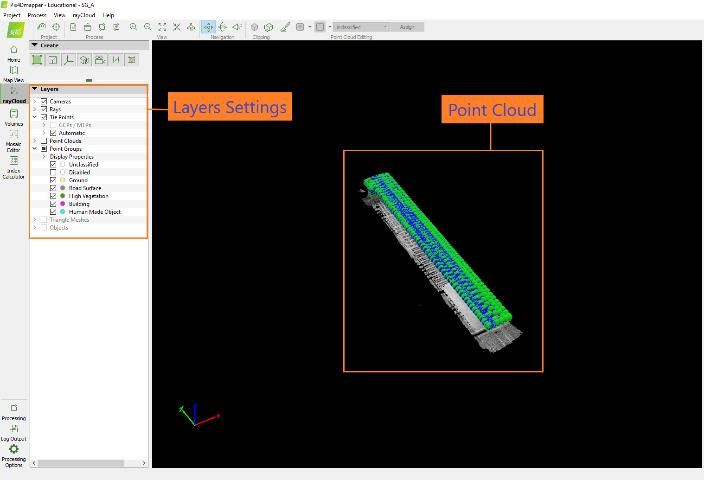
13. After the processing ends, you will find the results in the rayCloud tab. There are options for displaying several layers. You can choose which layers to display (Figure 8).
Credit: UF/IFAS
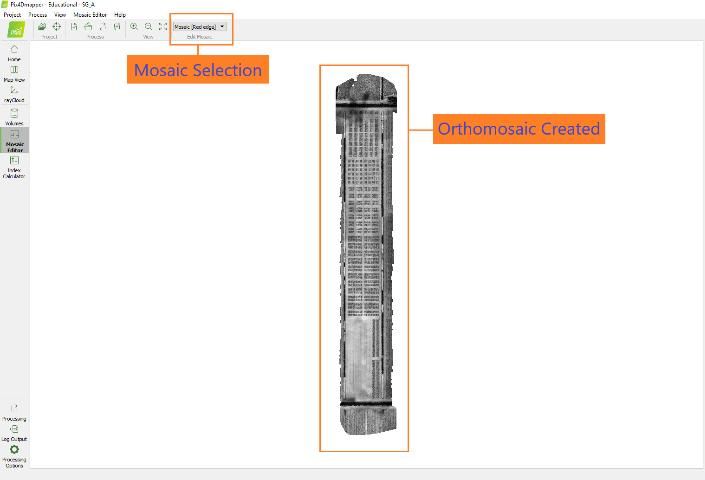
14. Under the Mosaic Editor tab, you can find the orthomosaic created (Figure 9). There is an option at the top of the window to select the type of orthomosaic to be displayed under Edit Mosaic.
Credit: UF/IFAS
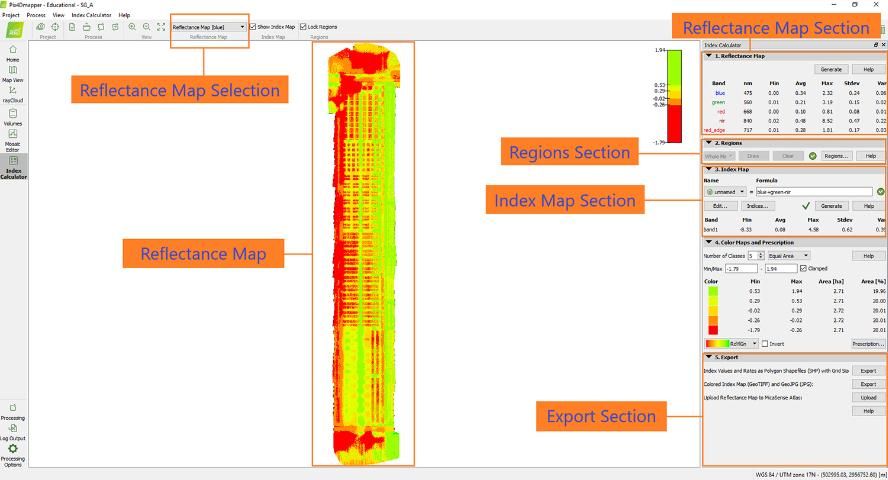
15. In the Index Calculator tab, you can find the reflectance maps created. There is an option in the upper right to select the type of reflectance map to be displayed under the Reflectance Map section.
16. On the right side of the Index Calculator tab, you can find the index calculator with several sections, namely Reflectance Map, Regions, Index Map, Color Maps, and Prescription and Export.
17. Under the Reflectance Map section, you will find the reflectance values for each band and various details about each band, such as minimum, maximum, average, standard deviation, and variance values.
18. Under the Regions section, you can create specific regions by adding a region name and drawing the region area with the cursor, then get the indices or reflectance values for those particular regions. To add a region, click Regions, click Add, enter a name for the region, click OK, then click Draw and draw the region using the cursor (Figure 11).
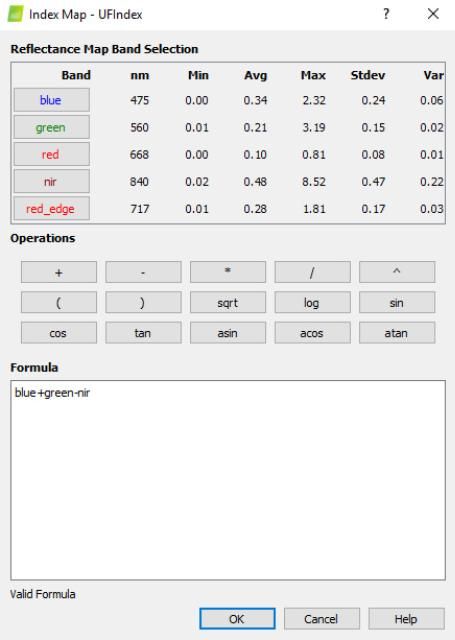
19. Under the Index Map section, you can create your custom index using available bands and generate maps for the custom index (Figure 10). To add a custom index, click Indices, click Add, enter the formula for the custom index, enter a name for the index, click OK, select the custom index from the dropdown menu, and click Generate to get the map with the custom index.
Credit: UF/IFAS
20. Under the Export section, you can find options to export the processed data in several formats such as GeoTIFF and JPEG (Figure 11).
Credit: UF/IFAS
Conclusion
There are several post-processing software available to visualize data collected from a UAV flight. The users have to decide which option or software works best for their application(s) and use that particular option to generate results. Users can also create custom indices and custom areas using various options in the post-processing software. Calibration of the data is an important step that must be followed for accurate results. There are also options to generate different types of outputs or maps. The user has to decide which output map is needed and select only that map to minimize the data processing time. This document covers general steps that must be followed for the post-processing of data collected from a UAV fight using Pix4Dmapper. The Pix4Dmapper was discussed as the most commonly used software (as of this writing). The authors do not endorse any particular software.
References
Ampatzidis, Y., and V. Partel. 2019. "UAV-based high throughput phenotyping in citrus." Remote Sens.: 410.
Ampatzidis, Y., V. Partel, B. Meyering, and U. Albrecht. 2019. "Citrus rootstock evaluation utilizing UAV-based remote sensing and artificial intelligence." Comput. Electron. Agric.: 164, 104900.
Candiago, S., F. Remondino, M. De Giglio, M. Dubbini, and M. Gattelli. 2015. "Evaluating multispectral images and vegetation indices for precision farming applications from UAV images." Remote Sens.: 4026–4047.
Díaz-Varela, R. A., R. De la Rosa, L. León, and P. J. Zarco-Tejada. 2015. "High-resolution airborne UAV imagery to assess olive tree crown parameters using 3D photo reconstruction: Application in breeding trials." Remote Sens. 7: 4213–4232.
Feng, Q., J. Liu, and J. Gong. 2015. "UAV remote sensing for urban vegetation mapping using random forest and texture analysis." Remote Sens. 7: 1074–1094.
Garcia-Ruiz, F., S. Sankaran, J. M. Maja, W. S. Lee, J. Rasmussen, and R. Ehsani. 2013. "Comparison of two aerial imaging platforms for identification of Huanglongbing-infected citrus trees." Comput. Electron. Agric.: 106–115.
Guan, S., K. Fukami, H. Matsunaka, M. Okami, R. Tanaka, H. Nakano, T. Sakai, K. Nakano, H. Ohdan, and K. Takahashi. 2019. "Assessing correlation of high-resolution NDVI with fertilizer application level and yield of rice and wheat crops using small UAVs." Remote Sens. 11: 112.
Matese, A., F. Capraro, J. Primicerio, G. Gualato, S. F. Di Gennaro, and G. Agati. 2013. "Mapping of vine vigor by UAV." Precis. Agric.: 201–208.
Matese, A., P. Toscano, S. F. Di Gennaro, L. Genesio, F. P. Vaccari, J. Primicerio, C. Belli, and A. Zaldei. 2015. "Intercomparison of UAV, aircraft and satellite remote sensing platforms for precision." Remote Sens.: 2971–2990.