Capacity of the Soil to Store Water
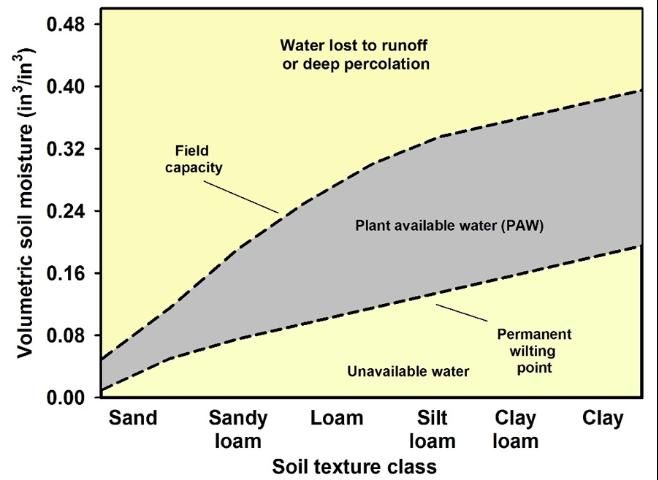
Soils hold different amounts of water depending on their texture and structure. The upper limit of water storage is often called "field capacity" (FC), while the lower limit is called the "permanent wilting point" (PWP). Following an irrigation or rainfall event that saturates the soil, there will be a continuous rapid downward movement (drainage) of some soil water due to gravitational force. During the drainage process, soil moisture decreases continuously. The velocity of the drainage is related to the hydraulic conductivity of the soil. In other words, drainage is faster for sandy soils compared to clay soils. After some time, the rapid drainage becomes negligible and at that point, the soil moisture content is called "field capacity." The permanent wilting point is determined as the soil moisture content at which the plant is no longer able to absorb water from the soil causing the plant to wilt and die if additional water is not provided. However, most plants will undergo substantial water stress before this point, and vegetables will likely sustain substantial yield reductions long before the permanent wilting point is reached.
The total amount of water available for plant uptake is the "plant available water" (PAW), which is the difference between FC and PWP (Figure 1) and is often expressed as a percent by volume (volume of water/volume of soil sample). The "available water holding capacity" (AWHC) is determined by multiplying the PAW by the root zone depth where water extraction occurs. Depletion of the water content to PWP adversely impacts plant health and yield. Thus, for irrigation purposes, a "maximum allowable depletion" (MAD) or fraction of AWHC representing the plant "readily available water" (RAW) is the ideal operating range of soil water content for irrigation management. Theoretically, irrigation scheduling consists of initiating irrigation at low soil water contents, corresponding to the given MAD, and irrigating until depleted water has been replaced without exceeding FC, otherwise drainage and/or deep percolation will occur.

Credit: UF/IFAS
Irrigation Scheduling
Irrigation scheduling is simply applying water to crops at the right time and in the right amount and is considered an important best management practice (BMP). Typically, irrigation scheduling is most often determined by grower judgment or using a pre-determined calendar schedule of irrigation events based on previous seasons' water requirements. Several factors such as plant evaporative demand, soil characteristics and root distribution are taken into account as well, in order to establish proper irrigation scheduling. A wide range of irrigation scheduling methods is used in Florida with corresponding levels of water management. The recommended method for scheduling irrigation (drip or overhead) for vegetable crops is to combine, (1) the crop water requirement method that takes into account plant stage of growth; (2) a measurement of soil water status; and (3) guidelines for splitting irrigation.
Generally, there are two types of sensors used for irrigation scheduling, those that measure soil water potential (also called tension or suction) and those that measure volumetric water content directly. Soil moisture sensors are detailed in the publication, Field Devices for Monitoring Soil Water Content (https://edis.ifas.ufl.edu/AE266). The present publication focuses on capacitance based soil moisture measurement devices, which have been shown to have relatively accurate volumetric soil moisture measurement in sandy soils common to Florida. Capacitance based sensors have become more common in recent years due to a decrease in the cost of electronic components and increased reliability. These soil moisture sensors (SMS) have been successfully used to monitor volumetric water content and guide irrigation management. However, a correct interpretation of the soil moisture readings is very important to assure proper irrigation management and avoid over-irrigation.
Practical Determination of Soil Field Capacity for Sandy Soils Using Soil Moisture Measurements
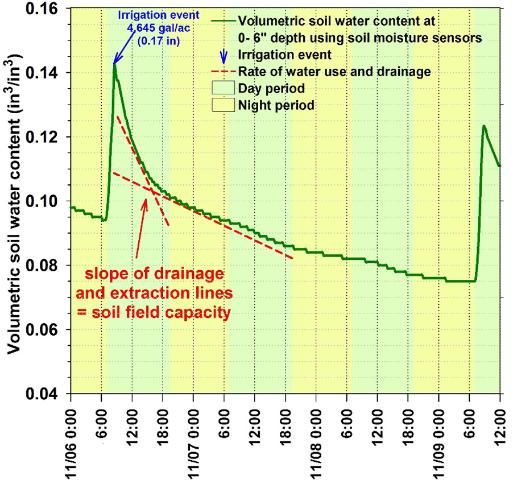
Figure 2 shows volumetric soil water content at depth of 0–6 inches measured by a capacitance sensor during a period of 4 days. There were 2 irrigation events on 11/06 and 11/09 at 7:00 am. For the soil field capacity point determination, we intentionally applied an irrigation depth that resulted in saturation of studied soil depth layer, in this particular case 0–6 inches.

Credit: UF/IFAS
The depth of irrigation applied was 0.17 in (equivalent to 4,645 gal/ac with drip irrigation). After both irrigation events, there was a noticeable increase in soil moisture content. The degree to which the soil moisture content increases, however, is dependent upon the volume of irrigation, which is normally set by the duration of irrigation event. For plastic mulched drip irrigation in sandy soils, long irrigation cycle times result in a relatively large increase in soil moisture in the area below the drip emitter. In Figure 2, the spike in soil moisture appears to only be temporary, as the irrigation water rapidly drains down beyond the 6 inch zone (11/06, between 9:00 am and 7:00 pm). This rapid spike in soil water content indicates that the soil water content, as measured by the SMS probes, rapidly reached a point above the soil water holding capacity and the water percolated down to deeper soil layers. Between 11/06 at 6:00 pm and 11/07 at 7:00 pm (Figure 2), the rate of decrease of soil water content slowed to a constant rate due to slower soil water extraction by drainage, which occurred during the day and night. Evapotranspiration, also reduced the soil water content, that occurred exclusively during the daytime. For sandy soils, the point at which the slope of drainage and extraction lines changes from a rapid to a slower decrease in soil water content can be assumed as the field capacity point. At this point, the water has drained out from the large soil pores (macropores), and has been replaced by air. The remaining pore spaces (micropores) are still filled with water and will supply the plants with needed moisture. It is very important the irrigation manager understands this concept of "field capacity" to establish an irrigation control strategy with goals of providing optimum soil moisture for plant growth, productivity, and reduction of fertilizer nutrient leaching.
Examples of Irrigation Management of Vegetable Crops in Sandy Soils
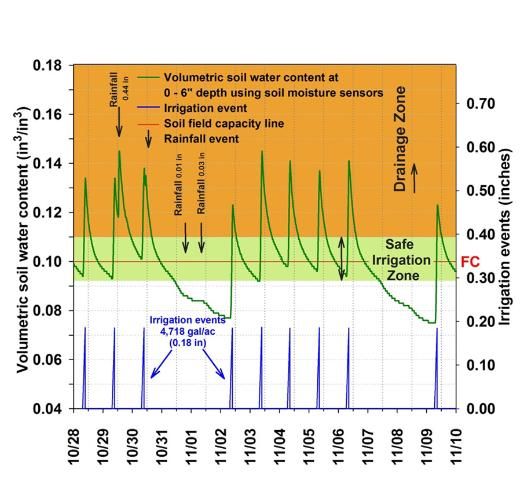
Figures 3 and 4 show examples of over-irrigation and proper management of drip irrigation, respectively. In Figure 3, the irrigation was applied once per day with a depth of 0.18 in, equivalent to 4,718 gal/ac with drip irrigation. After each irrigation event there was an increase in the soil water content followed by rapid drainage. Large rainfall events may lead to substantial increases in soil moisture content. On 10/29, right after the irrigation, a large rainfall of 0.44 in, which resulted in a second spike of soil water content in the same day. Irrigation the following day (10/30) began when the volumetric soil water content was above field capacity and could have been skipped safely.

Credit: UF/IFAS
Between 10/31 and 11/02, no irrigation was applied to the crop. The volumetric water content decreased from 0.14 to 0.08 in3/in3. Due to the very low water holding capacity of the sandy soils, skipping irrigation for several days could lead to unneeded crop water stress especially during very hot or very windy days (high evapotranspiration rates), or during the flowering stage of growth. Between 11/02 and 11/06, large daily irrigation events were repeated, exceeding the "safe irrigation zone," and leading to water drainage and nutrient leaching.
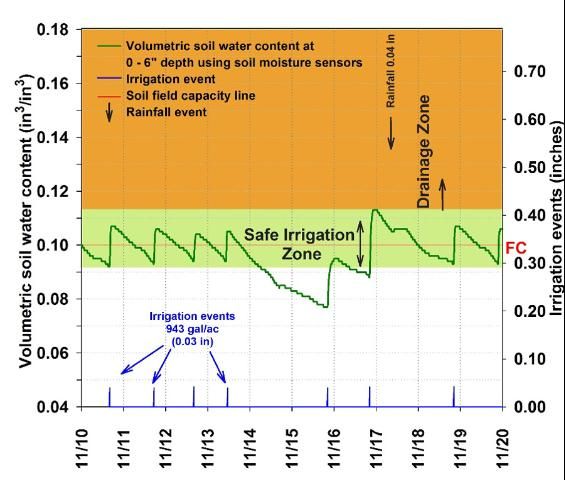
Conversely, Figure 4 shows an "adequate" irrigation cycle for a 10-day period. In this case, the irrigation event started exclusively when the volumetric soil water content reached an arbitrary threshold. For this particular situation, the soil field capacity was known, the irrigation events started when the volumetric soil moisture content reached values below the soil field capacity (e.g., 0.09 in3/in3). However, to maintain the soil volumetric water content in the "safe irrigation zone," a previous determination of the length of the irrigation was necessary, to avoid over-irrigation (additional information about irrigation depths can be obtained in the publication Microirrigation in Mulched Bed Production Systems: Irrigation Depths at https://edis.ifas.ufl.edu/AE049). The irrigation depth for Figure 4 was 0.03 inches per event (13 gal/100ft in drip irrigation), this irrigation depth was sufficient to increase the volumetric water content to a given moisture without exceeding the "safe irrigation zone." On average, the volumetric soil water content is maintained close to the field capacity, keeping water and nutrients in the root zone. For this particular example, there was no deep water percolation. In addition, with the information of the soil water status, the irrigation manager can decide to not irrigate when the soil moisture content is at a satisfactory level. For example, in 11/17, due to a rainfall event of 0.04 in, there was no need for irrigation because the soil moisture was above the field capacity, therefore the irrigation event was skipped.

Credit: UF/IFAS
Summary
This document summarized guidelines for determining soil field capacity and optimum irrigation schedules for sandy soils using soil moisture sensor measurements. Soil moisture sensors have shown potential for soil moisture monitoring and supporting irrigation decisions in vegetable crops. In the past, soil moisture sensors have not been widely used by growers because of costs, the level of technical skill required, and sensor maintenance required. Advances in soil moisture sensors have made them easier to use and the cost of energy has made these sensors a more viable option. Continued restrictions aimed at reducing nutrient leaching and recent increases in energy costs have increased grower interest in use of improved technologies. This information is supplied to help the irrigation system manager schedule and operate the system to optimal capacity. With proper management and operation, microirrigation systems can apply precise amounts of water to the crop for maximum effectiveness at high levels of efficiency.
References
Gary A. Clark and Dorota Z. Haman. (1988). Microirrigation in Mulched Bed Production Systems: Irrigation Depths. Gainesville: University of Florida Institute of Food and Agricultural Sciences. AE72 https://edis.ifas.ufl.edu/AE049 (accessed February 2016).
Muñoz-Carpena, R. (2004). Field Devices for Monitoring Soil Water Content. Gainesville: University of Florida Institute of Food and Agricultural Sciences. BUL343 https://edis.ifas.ufl.edu/AE266 (accessed February 2016).