Introduction
This article presents the cost of production per acre for growing fresh grapefruit in the Indian River region during 2016/17. Typical users of the estimates presented herein include growers and consultants, who use them as a benchmark; property appraisers, who use them to compute the taxes for property owners; and researchers, who use the estimates to evaluate the economic feasibility of potential new technologies.
Production Cost
The data were collected during a production committee meeting of the Indian River Citrus League in May 2017. Seven grapefruit growers participated in the survey. A questionnaire distributed to the growers before the meeting asked them to provide annual, per-acre costs by program for a "typical" irrigated, mature grapefruit grove (10+ years old) with fruit marketed to the fresh market, including costs related to their tree-replacement programs. Growers brought the completed surveys to the meeting.

During the meeting, each grower used a "clicker" or remote device to enter the costs for each caretaking program. Using clickers to collect the data kept the process anonymous and confidential. Surveying a panel of growers to obtain the costs of their production programs allows us to report estimates that closely reflect growers' cost. This is particularly important because, since the outbreak of Huanglongbing (HLB, citrus greening), growers have been modifying their practices from year to year in an attempt to cope with the disease. The cost estimates below do not represent any individual operation. Instead, their purpose is to serve as a benchmark for the Florida citrus industry.
The information below was obtained by computing the weighted average of the responses by the acreage of each of the participating growers. Their combined operations account for approximately 18,000 acres. The acreage for grapefruit in the Indian River region in 2016 was estimated at 32,401 (USDA-NASS 2016). Thus, the sample of growers represented 61% of the acreage devoted to grapefruit in that region.
Table 1 shows the cultural costs of production by program. Such estimates include both the costs of materials and their application. From Table 1, the total for weed management, which includes chemical and mechanical mowing as well as herbicides, was $209.07 per acre. At $1,242.05 per acre, foliar sprays represented the largest production cost. Fertilizer was the second largest expense at $402.30 per acre. Coordinated sprays accounted for $20.11 per acre. The expense for pruning was $71.20 per acre, while that for irrigation was $194.32 per acre. The cost of canker control was $62.45 per acre. Adding all the costs listed above, the cultural cost of growing fresh grapefruit in the Indian River during 2016/17 without tree replacement was $2,201.49 per acre.
Growers were also asked to provide details regarding their reset practices, including the number of trees replaced in their groves. On average, growers replaced two trees per acre during 2016/17. The total cost of tree replacement, including tree removal, site preparation, and care of young trees, was estimated at $100.86 per acre. Adding this figure to the total cost above yields a total production cost with tree replacement of $2,302.35 per acre.
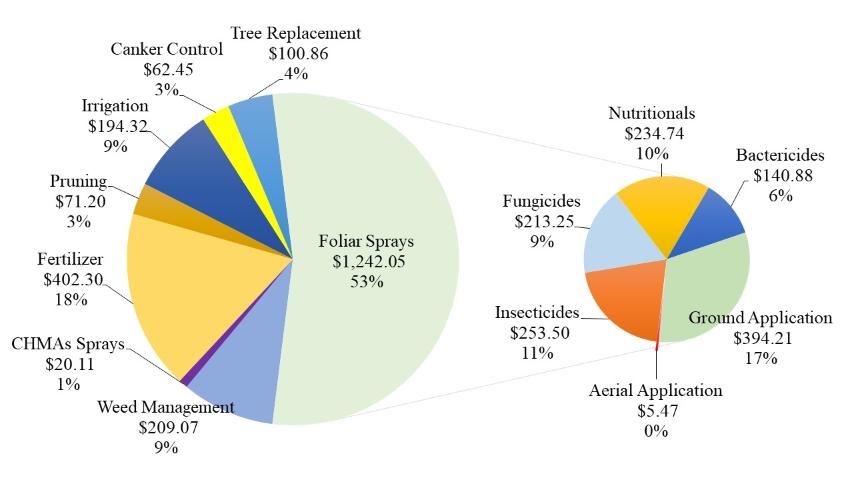
Figure 1 depicts a double pie chart. The larger pie shows the cost of each program as well as the percentage relative to the cultural production costs with tree replacement. The smaller pie in Figure 1 provides greater detail regarding the individual components included in the foliar sprays. The expense of $1,242.05 per acre includes insecticides at $253.50 per acre, (representing 11% of the cultural cost of production); fungicides account for $213.25 per acre (9%); foliar nutritionals for $234.74 per acre (10%); aerial application for $5.47 per acre (0.24%); and ground application of materials for $394.21 per acre (17%).
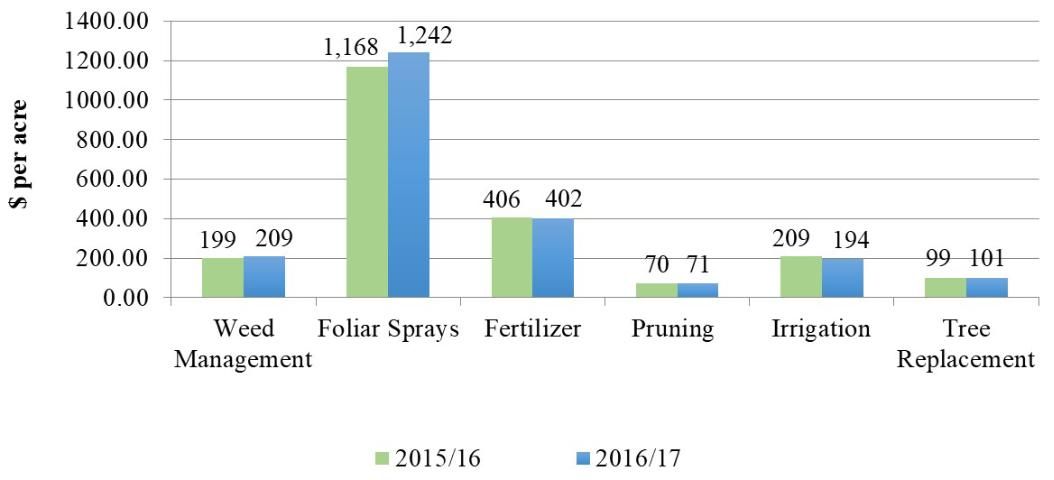
Figure 2 shows a comparison of the cost of the main production programs in 2016/17 relative to the previous season. Most of the programs have changed only marginally. However, foliar sprays increased by $74 per acre. This is because streptomycin and oxytetracycline were allowed to be used in Florida's citrus groves in March 2016 in an attempt to manage HLB. The basic tenet for their use is not to eliminate the bacteria (Candidatus Liberibacter asiaticus) within HLB-affected trees, but to reduce its titer (i.e., presence and amount within the tree). The reduction in titer is expected to improve the trees' condition, which would make them more productive. Still, the total cultural cost of production increased only by $65.43 per acre with respect to 2015/16.


In addition to cultural costs, growers typically have to incur other costs when managing their groves; these other costs include management, regulatory, and opportunity costs. Table 2 shows the estimated total cost of production for fresh grapefruit growers in Indian River during 2016/17 was $2,829.04 per acre. Based on this estimate, the breakeven prices per box for different levels of yield, as calculated on an on-tree and delivered-in basis, are presented in Table 3. The latter calculation assumes harvesting costs per box for fresh grapefruit were $2.65, which is based on the results of the survey "2016/17 Picking, Roadsiding, and Hauling Charges for Florida Citrus" (Singerman et al. 2017). The calculations in Table 3 also include the Florida Department of Citrus (FDOC) assessment of $0.07 per box for grapefruit during the 2016/17 season. Thus, for example, the on-tree and delivered-in breakeven prices for covering the total costs of production with yield at 300 boxes per acre were $16.15 and $19.17 per box, respectively.
Summary
This article presents a summary of the costs of production for fresh market grapefruit grown in the Indian River region during 2016/17. The methodology chosen to collect the data consisted of surveying growers directly to closely reflect growers' costs in the era of HLB. The main change this season was the introduction of bactericides used by growers to attempt to reduce the titer (i.e., presence and amount) of the bacteria (Candidatus Liberibacter asiaticus) within HLB-affected trees. The total cost of production for fresh grapefruit in Indian River during 2016/17 was $2,829.04 per acre.
References
Singerman, A., M. Burani-Arouca, S. H. Futch, R. Ranieri. 2017. Harvesting Charges for Florida Citrus, 2016/17. UF/IFAS Citrus Research and Education Center, Lake Alfred, FL. http://www.crec.ifas.ufl.edu/extension/economics/harvesting_charges.shtml
USDA-NASS. 2016. Commercial Citrus Inventory: Preliminary Report. Maitland, FL: USDA-NASS, Florida Department of Agricultural Services.
Cultural costs of production per acre for fresh market grapefruit grown in Indian River, Florida, 2016/17
Total costs of production per acare for fresh market grapefruit grown in Indian River, Florida, 2016/17