Performance of microirrigation systems can be evaluated by measuring operating pressures, application rates, and uniformity of water application under nursery conditions. We will present a simple test to determine the uniformity of water application.
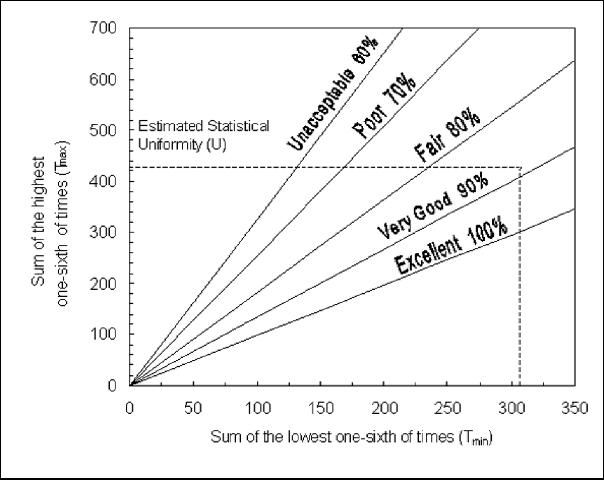
There is an easy test to evaluate water application uniformity. Measurements of the time required to fill the same container must be performed at a minimum of 18 locations throughout the irrigation zone. The statistical uniformity nomograph (Bralts and Kesner 1983) is based on statistical coefficient of variation and can be used to determine the overall application uniformity (Figure 1). If the uniformity is low, more than 18 measurements of time (seconds) may be necessary to increase the confidence level of the uniformity measurement.

To perform the test you need a small container, such as an empty bottle, and a device that denotes seconds so you can record the time to fill bottle at each location. The following steps are required.
Determine how many measurements represent one-sixth of the total locations in the zone. For example, if a total of 18 measurements is performed, this number is 3.
- Add the lowest three measurements of time (seconds) and mark the sum on the x-axis of the nomograph.
- Add the highest three measurements of time (seconds) and mark the sum on the y-axis of the nomograph.
- If the sums do not fit on the scale or if the value is very small so that it is difficult to read, the sums can be multiplied or divided by a common factor.
- Read the water application uniformity at the intersection of the two lines passing through these points.
Example
Assume that water was collected randomly from 18 emitters throughout an irrigation zone. The time to fill the same bottle was recorded in Table 1.
- one-sixth of 18 data points = 3
- 102+105+110 = 317 seconds (lowest 3 values). Mark this value on horizontal (x) axis of the nomograph and draw a vertical line through this point.
- 130+145+150 = 425 seconds (highest 3 values). Mark this value on the vertical (y) axis of the nomograph and draw a horizontal line through this point.
- Read the uniformity of application. The point of intersection of these lines falls in the section of 80% to 90% that indicates "very good" uniformity of the system. The uniformity of water application by microirrigation emitters should be at least in the category "very good" (see Figure 1), especially if fertilizers are injected into the system.
Low uniformities in microirrigation systems can be due to factors, such as:
- Improper pipe diameters (submains, manifolds, and laterals)
- Too high or too low operation pressure
- Emitters not appropriate for system design
- Clogged emitters
- Changes or wear on system components
- Changes in pump output and pressure
Literature Cited
Bralts, V. F. and C. D. Kesner. 1983. "Drip Irrigation Field Uniformity Estimation." Transactions of the Amer. Soc. Ag. Eng. 26(5):1369–1374.
Reference
Haman, D. Z., A. G. Smajstrla and D. J. Pitts. 1997. Uniformity of Sprinkler and Microirrigation Systems for Nurseries. Bulletin 96-10:1–7, Fla. Coop. Ext. Ser. Univ. of Fla., Gainesville, Florida.