Introduction
Freshwater resources are becoming scarce due to population increase and associated increases in water, food, and energy demands. The state of Florida alone is projected to add 6 million people by 2030 (Rayer and Wang 2017). Moreover, extreme weather events (e.g., floods and droughts) are becoming common phenomena. Therefore, as freshwater resources become increasingly scarce and droughts become more frequent, there is a need for efficient use of water resources. There have been significant advancements in irrigation technologies (e.g., electric valves, smart controllers, soil moisture sensors, etc.) that can allow water savings (Dukes 2012). However, the effectiveness of these technologies depends on several factors, such as the design of the irrigation system. Designing efficient irrigation systems and equipment will save money and conserve water.
Factors to Consider When Designing Irrigation Systems
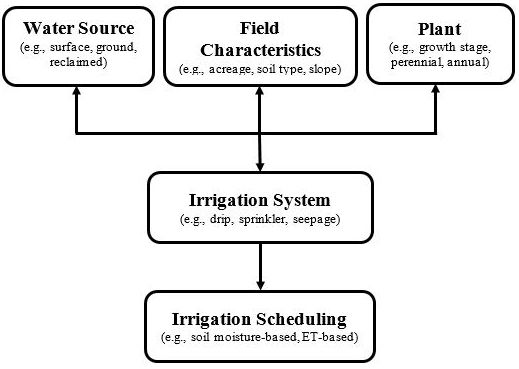
This document provides a basic overview of the major factors to consider when designing irrigation systems and choosing irrigation equipment. Figure 1 presents a few of the major factors that affect the design of irrigation systems.

Credit: Haimanote K. Bayabil, UF/IFAS
Water Source
Total freshwater withdrawal in Florida across all uses is 6.4 billion gallons per day. Almost two-thirds is from groundwater, while the rest is from surface water (Marella 2015). Nearly 40 percent of freshwater withdrawal is accounted for by agricultural use, while 36 percent is for public supply. The remaining 24 percent of freshwater withdrawals go to other uses such as power generation, recreational-landscape irrigation, commercial-industrial mining, and domestic self-supplied uses. Freshwater withdrawal in Florida follows irrigated croplands' population density and intensity. Freshwater withdrawal is the highest in Palm Beach County (more than 1 billion gallons per day). Knowing the quality and available quantity of the irrigation water source is critical. Water sources could be from reclaimed water, surface water, or groundwater. Depending on the water source used, the amount of water available and the equipment needed to deliver the water will differ. Water allocations for irrigation could be subject to local ordinances, depending on several factors.
Field Characteristics
Field characteristics (i.e., field size, land slope, soil type) could affect the choice of the irrigation system, necessary irrigation equipment (e.g., pump), and plant types.
Field Size
Field size (acreage) affects the maximum number of plants that can be planted and, as a result, the total irrigation requirement. The maximum area that can be irrigated at any given time should be determined based on the availability of water, the pump's allowable flow rate, and the pressure at the source. Pressure loss should be considered when designing an irrigation system to minimize pressure drops and variations across the irrigated area.
Land Slope
Terrain slope affects the flow of water and irrigation distribution uniformity. Water flows from high potential (high elevation) to low potential (low elevation). Depending on the irrigation system layout, fields at lower elevations could receive too much water, while higher-elevation locations could receive too little water. Pumps might be needed to deliver enough water against a slope gradient. In addition, terrain slopes could promote runoff and erosion. In some cases, leveling of uneven fields could be considered.
Soil Properties
Soil properties (e.g., texture, structure, soil depth, organic matter content) affect soil and water relationships, such as soil water-holding capacity. Soil water-holding capacity affects the frequency and rate of water application. For example, sandy soils have low water-holding capacity and need to be irrigated more frequently at lower irrigation rates (Table 1). Alternatively, clayey soils have a relatively higher water-holding capacity and could be irrigated less frequently at a higher irrigation rate. Soil depth also affects effective plant rooting depth and the leaching of water and nutrients below the root zone. General soil information is available from the Web Soil Survey website (https://websoilsurvey.nrcs.usda.gov/app/WebSoilSurvey.aspx) provided by the USDA Natural Resources Conservation Service (NRCS). However, the accuracy of such information should be verified through field measurements.
Plant Type
Plant type affects irrigation system selection. Irrigation requirements differ depending on the plant growth stage. In addition, reports show that annual crops have smaller water requirements than perennial plants (Vico and Brunsell 2018). In addition, different plants have different planting densities (spacing). If the same irrigation system is used to irrigate different plants, plants should be placed in different zones so they will be irrigated independently. Crop coefficients (Kc) vary at distinct growth stages for different plants. Thus, plant-specific Kc values should be used when calculating actual evapotranspiration (ETc) and irrigation requirements. Crop market values affect the feasibility of more expensive irrigation systems. Higher-value crops may allow for greater investment in an irrigation system; this may not be a viable option for lower-value crops.
The following documents contain additional information about crop coefficients and crop irrigation requirements.
Evapotranspiration: Potential or Reference?: https://edis.ifas.ufl.edu/ae256
Evapotranspiration-Based Irrigation for Agriculture: Crop Coefficients of Some Commercial Crops in Florida: https://edis.ifas.ufl.edu/ae456
Evapotranspiration-Based Irrigation Scheduling for Agriculture: https://edis.ifas.ufl.edu/ae457
Size, Biomass, and Nitrogen Relationships with Sweet Orange Tree Growth: https://doi.org/10.21273/JASHS.131.1.149
Principles and Practices of Irrigation Management for Vegetables: https://edis.ifas.ufl.edu/cv297
Types of Irrigation Systems
An irrigation system distributes water from the source to the field. Identifying the best water delivery mechanism for a specific situation is critical. Plant type, soil type, landscape characteristics, required flow rate, operating pressure, and cost affect the choice of irrigation systems. This section discusses the major types of irrigation systems (drip, sprinkler, and seepage) and their advantages and disadvantages.
Drip Irrigation System
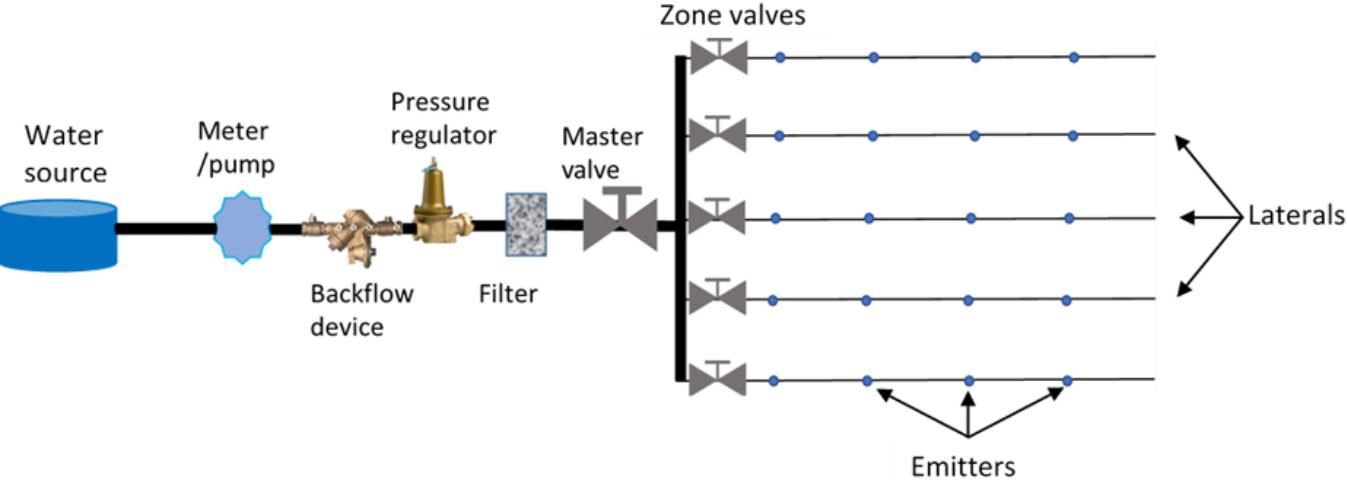
A drip irrigation system is the most efficient irrigation system and is used for row crops. Drip irrigation can be surface or subsurface, and polyethylene drip tapes are often used. In drip irrigation systems, emitters directly apply water to the plant root zone. This reduces water losses due to surface runoff and/or leaching below the root zone. Planting density guides emitter spacing. Emitters could be built into the drip tapes (lateral), or barbed emitters could be installed by puncturing the drip tapes using appropriate tools. Emitters vary in their discharge rates (gpm). This makes drip irrigation suitable for all soil types. However, physical (e.g., sand particles), biological (e.g., bacteria), and chemical compounds can clog the emitters. Using a combination of strategies, such as installation of a filtration system, frequent flushing of the irrigation system, use of disinfectants (e.g., chlorine), and/or injection of acid into the irrigation system, could mitigate emitter clogging. Figure 2 shows a schematic of the major components of a typical drip irrigation system.

Credit: Haimanote K. Bayabil, UF/IFAS
Advantages
- Localized water application at or near the root zone
- Most efficient irrigation system due to reduced water losses resulting from runoff and deep percolation
- Can help suppress weeds, especially when combined with plastic mulch
- Uniform water distribution
- No water contact with leaves (e.g., lettuce), reducing disease risks
Disadvantages
- Easily damaged by farm equipment, sunlight, rodents, wildlife, etc.
- Needs to be replaced more frequently than other systems
- Prone to clogging; needs filtering
- More expensive for larger areas
- Frequent maintenance requirement
Sprinkler Irrigation System
In sprinkler irrigation systems, water is distributed using sprinkler heads. Depending on specifications, sprinkler heads have different spray radii, operating pressures, and application rates. There are different types of sprinkler systems, such as overhead, micro-sprinkler, and rotor. An overhead sprinkler system is often high-pressure with a high application rate, where water is applied from above the crop. Overhead sprinklers are used in agriculture, nurseries, and urban landscaping. While micro-sprinkler irrigation is low pressure and low to medium volume, it is suitable for high-value crops such as tree fruits. However, an overhead sprinkler system is not feasible to irrigate above the canopy of big trees. Micro-sprinkler irrigation allows the application of water directly to the soil, making it relatively more efficient than an overhead irrigation system.
Advantages
- Longer lasting than drip irrigation
- Applicable for agricultural, landscape, and nursery irrigation
- Overhead sprinkler has high pressure and medium to high application rate
- Different spray patterns and angles
- Can be used for freeze protection
Disadvantages
- Less efficient than a drip irrigation system
- Irrigation of open spaces between rows
- More susceptible to wind drift than a drip irrigation system
- There is a higher potential for runoff and erosion compared to drip
- Risks of plant disease due to wetting of foliage
Seepage Irrigation System
Seepage irrigation is a system through which water is directed to the plant root zone. This type of irrigation system involves altering the level of the shallow water table. As a result, seepage irrigation is applicable only in relatively flat fields with the presence of an impermeable layer below the root zone that allows adjustment of the perched water table level. Seepage irrigation is common in Florida, where the perched water table and sandy soils are overlaid on an impermeable layer (Rogers et al. 2018; Zotarelli et al. 2019). The seepage irrigation system is one of the least efficient irrigation systems due to the large volume of water needed to raise the groundwater level within the crops' root zone (Zotarelli et al. 2019). Zotarelli et al. (2019) and Rogers et al. (2018) provide additional information about seepage irrigation systems in Florida.
Advantages
- Can be easily implemented
- Relatively low operation and maintenance costs
- Reduced disease because water does not contact plant foliage
- No clogging issues; no filtration of irrigation water required
Disadvantages
- Least efficient method
- Applicable only in relatively flat fields with the presence of an impermeable layer below the root zone that allows adjustment of perched water table level
- Requires additional water to raise the water table within the root zone
- Could lead to waterlogged conditions if mismanaged
Basic Irrigation Hydraulics
Designing efficient irrigation systems requires understanding irrigation hydraulics, which deals with water flow through an irrigation system. Several factors affect water flow in an irrigation system, such as pressure, pipe size, valves, meters, and sprinkler heads. This section discusses a few of the major factors affecting water flow in a pipe system.
Pressure
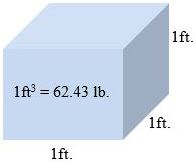
The overall principle in irrigation is that water flows through an irrigation system (e.g., pipes, heads, valves, meters, etc.) due to energy such as pressure. Pressure can be expressed in different forms, such as feet, pounds per square inch (psi), bar, and pascal. The pressure of a water column can be calculated as follows: A water column 1 ft long, 1 ft wide, and 1 ft tall (volume = 1 ft3; Figure 3) weighs 62.43 lb. This means that the 1 ft3 column of water divided among the 144 square inches of the base has a weight of 0.43 pounds on each square inch (Table 2), or a pressure of 0.43 pounds per square inch (psi).

Credit: Haimanote K. Bayabil, UF/IFAS
Friction Losses
As water moves through an irrigation system (e.g., pipes, fittings, valves, etc.), water loses energy due to friction between water and the system. As friction loss becomes larger, pressure in the irrigation system drops, and part of the field receives less water below the target irrigation rate. Generally, smaller-diameter and longer pipes will have greater friction losses than larger and shorter ones. Friction losses need to be considered during irrigation system design to achieve uniform irrigation distribution and application of the intended amount of water. Factors such as pipe diameter, material type, and shape affect friction losses. Pressure-loss charts can be used to estimate pressure loss in irrigation systems. For example, Table 3 shows friction-loss charts for drip tubes. In Table 3, for example, a drip tube with an internal diameter of 0.62 inches and a flow rate of 2 gpm will have a friction loss of 1.76 psi for every 100 ft drip length. Installation of pressure gauges can help in monitoring pressure losses in irrigation systems. Multiple pressure gauges may be installed at different points in the irrigation system to measure differential pressure.
Flow Rate and Pipe Size
The flow rate in irrigation systems depends on pipe size and pressure. The amount of water flowing through a pipe at one time is based on how much water is emitted by the sprinkler heads downstream from that pipe section, pump capacity, and operating pressure. Velocity is the flow rate divided by the cross-sectional area of the pipe. Pipe sizes start larger near the water source and get smaller toward the end of the irrigation system. Calculating the correct pipe size will ensure the application of the right amount of irrigation water. Table 4 shows the average flow rates that different pipe sizes can accommodate.
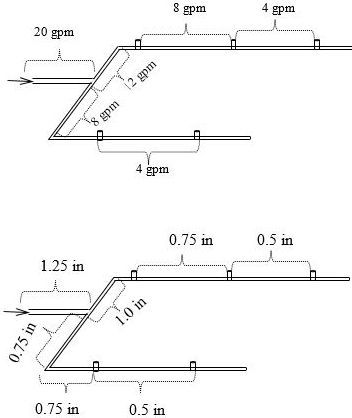
For example, Figure 4 shows a sprinkler irrigation system with five sprinkler heads; each has a 4 gpm flow rate (equivalent to 20 gpm for the entire irrigation system). Note the difference in pipe sizes based on the total water flowing at each part of the irrigation system (Table 4). This example does not account for friction losses due to pipe characteristics (e.g., type, diameter, length), fittings, meter, etc.

Credit: Haimanote K. Bayabil, UF/IFAS
Irrigation Pumps
Pumps are needed from lower to higher elevation points. A pump is primarily used to create flow, lift, or pressure that leads to adequate water flow in an irrigation system (Haman 2017). The required flow rate (gpm) and the irrigation system's operating pressure must be considered when selecting a pump. However, irrigation pumps may be costly. Consider the intended use of your irrigation system when choosing a pump and, if necessary, consult a professional. Haman (2017) and Haman and Zazueta (2017) provide additional information about pump types and efficiency metrics.
Irrigation Scheduling
Irrigation practices supplement plant water requirements not met by rainfall (Migliaccio and Li 2018). Irrigation scheduling refers to when and how much irrigation water is needed (Davis and Dukes 2010; Kisekka et al. 2019). Irrigation scheduling can be determined using soil moisture-based, evapotranspiration-based, and plant-based measurements. Efficient irrigation system design does not guarantee efficient irrigation water use unless appropriate irrigation scheduling exists. Additional information about irrigation scheduling techniques is available in the following EDIS documents.
Smart Irrigation Controllers: Operation of Evapotranspiration-Based Controllers: https://edis.ifas.ufl.edu/ae446
Smart Irrigation Controllers: Programming Guidelines for Evapotranspiration-Based Irrigation Controllers: https://edis.ifas.ufl.edu/ae445
Evapotranspiration-Based Irrigation for Agriculture: Sources of Evapotranspiration Data for Irrigation Scheduling in Florida: https://edis.ifas.ufl.edu/ae455
Evapotranspiration-Based Irrigation for Agriculture: Crop Coefficients of Some Commercial Crops in Florida: https://edis.ifas.ufl.edu/ae456
Evapotranspiration-Based Irrigation Scheduling for Agriculture: https://edis.ifas.ufl.edu/ae457
Summary
This document provides a basic overview of the major factors that affect the design of an irrigation system. Several factors, including the choice of suitable equipment and the system's design, influence the effectiveness of an irrigation system. The design of efficient irrigation systems is critical to conserve freshwater resources and save money. Additionally, efficient irrigation systems must have appropriate irrigation schedules to achieve the intended results.
References
Cahn, M. D., and L. F. Johnson. 2017. "New Approaches to Irrigation Scheduling of Vegetables." Horticulturae 3: 28.
Davis, S. L., and M. D. Dukes. 2010. "Irrigation Scheduling Performance by Evapotranspiration-Based Controllers." Agricultural Water Management 98: 19–28.
Dukes, M. D. 2012. "Water Conservation Potential of Landscape Irrigation Smart Controllers." Transactions of the ASABE 55: 563–569.
Haman, D. Z. 2017. Pumps for Florida Irrigation and Drainage Systems. CIR832. Gainesville: University of Florida Institute of Food and Agricultural Sciences. https://edis.ifas.ufl.edu/wi001
Haman, D. Z., and F. S. Zazueta. 2017. Measuring Pump Capacity for Irrigation System Design. CIR1133. Gainesville: University of Florida Institute of Food and Agricultural Sciences. https://edis.ifas.ufl.edu/ae067
Irrigation Association. 2008. "Friction Loss Charts." Accessed on September 10, 2023. https://jnmtechnologies.com/documents/2019/1/Friction_Loss_Charts-IrrigationAssociation.pdf
Kisekka, I., K. W. Migliaccio, M. D. Dukes, B. Schaffer, J. H. Crane, H. K. Bayabil, and S. M. Guzman. 2019. Evapotranspiration-Based Irrigation Scheduling for Agriculture. AE457. Gainesville: University of Florida Institute of Food and Agricultural Sciences. https://edis.ifas.ufl.edu/ae457
Marella, R. 2013. "Water Use in Florida, 2005 and Trends 1950–2005." U.S. Department of the Interior, U.S. Geological Survey. http://pubs.usgs.gov/fs/2008/3080/index.html
Marella, R. L. 2015. "Water Withdrawals in Florida, 2012: Open-File Report 2015-1156." Accessed on February 18, 2020. http://dx.doi.org/10.3133/ofr20151156
Melby, P. 1988. Simplified Irrigation Design. PDA Publishers.
Migliaccio, K. W., and Y. C. Li. 2018. Irrigation Scheduling for Tropical Fruit Groves in South Florida. TR001. Gainesville: University of Florida Institute of Food and Agricultural Sciences. https://edis.ifas.ufl.edu/tr001
Rayer, S., and Y. Wang. 2017. "Projections of Florida Population by County, 2020–2045, with Estimates for 2016." Bureau of Economic and Business Research 50.
Rogers, J., T. Borisova, J. Ullman, K. T. Morgan, L. Zotarelli, and K. Gorgan. 2018. Factors Affecting the Choice of Irrigation Systems for Florida Tomato Production. FE960. Gainesville: University of Florida Institute of Food and Agricultural Sciences. https://journals.flvc.org/edis/article/download/131873/135478/237604
Vico, G., and N. A. Brunsell. 2018. "Tradeoffs between Water Requirements and Yield Stability in Annual vs. Perennial Crops." Advances in Water Resources 112: 189–202.
Zotarelli, L., L. Rens, C. Barrett, D. J. Cantliffe, M. D. Dukes, M. Clark, and S. Lands. 2019. Subsurface Drip Irrigation (SDI) for Enhanced Water Distribution: SDI—Seepage Hybrid System. HS1217. Gainesville: University of Florida Institute of Food and Agricultural Sciences. https://edis.ifas.ufl.edu/hs1217
Table 1. Water-holding capacity (inches of water per foot of soil depth) for various soil types that are common in south Florida (Migliaccio and Li 2018).
Table 2. Unit conversions of pressure.
Table 3. Irrigation Association Friction Loss Chart (2008) for drip tubes. Shaded areas represent velocities greater than 5 ft/s. Use with caution.
Table 4. Ideal flow rate for pipes of different sizes. Source: Melby (1988).