Introduction
Banana is one of the world's most important crops grown by small- and large-scale producers alike, with production occurring in more than 130 countries. The economic importance of the banana industry encompasses (1) the generation of export earnings and (2) the employment of hundreds of thousands of people in Latin America, the Caribbean, Southeast Asia, and West Africa. In addition, the industry employs thousands of people in distribution networks and supermarkets worldwide.
Currently, few bananas are produced in the United States. Banana production in Florida is estimated at about 500 acres, valued at approximately $2 million. Recently, there has been a renewed interest in expanding US banana production to satisfy various niche markets, including the market for organic and processed bananas. Consequently, the purpose of this article is to provide an overview of the world and US markets for fresh bananas, with special reference to the US market for organic bananas.
World Production of Fresh Bananas
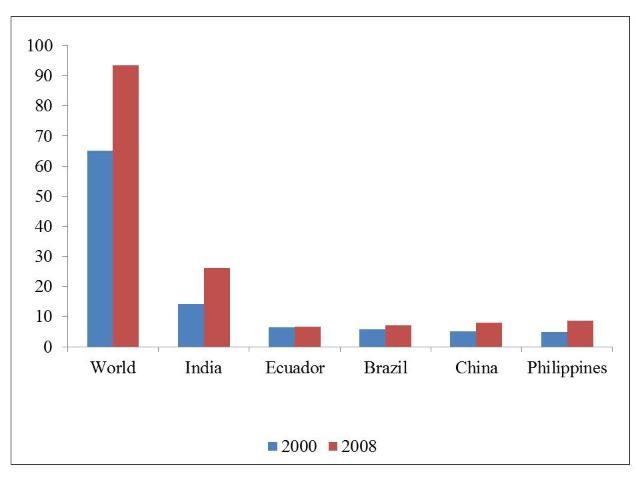
In 2009, world production of bananas reached an estimated 97.3 million metric tonnes (mmt), grown on 4.9 million hectares. The 2009 crop represented an increase in production of 49 percent from the 65.1 mmt recorded in 2000. The top five banana-producing countries of India, the Philippines, China, Ecuador, and Brazil accounted for 61 percent of global banana production in 2009, up from 56 percent in 2000. In addition, there were noticeable production increases in India and the Philippines (Figure 1).
Credit: FAOSTAT (Food and Agriculture Organization of the United Nations
India continues to be by far the largest world producer of fresh bananas; by 2009, India had produced more than 26 mmt of bananas (almost 28% of the global production). Next in line is the Philippines, with a market share of 9.3 percent, followed closely by China (9.2%), Ecuador (7.8%), and Brazil (7%). Of the top five banana-producing countries, only Ecuador and the Philippines are major exporting countries. The bulk of the production is sold to the domestic market in these countries.
US Banana Production
US banana production is very limited; in 2009, US total banana production reached almost 7,000 mmt, or 0.01% of the total world production, on an estimated 16,000 acres. Hawaii is by far the largest banana producer in the United States, followed by Florida. Banana production in Hawaii has followed a downward trend, from 13,181 mmt in 2000 to 8,090 mmt in 2010. Hawaii produces mainly the conventional Cavendish variety and the Hawaiian apple banana, which are sold in the local markets due to high labor and land costs. The major US banana exporter is Florida, which produces mainly Thai and cooking bananas (Bluggoe type). In addition, US banana producers are seeking opportunities in the organic and specialty segments of the banana market in Florida and the coastal region of Georgia (Schupska 2008).
Main Exporters of Fresh Bananas
Global export of bananas in 2009 (FAO) was estimated at 14.8 mmt, the equivalent of 15.3 percent of the world production that year, and was valued at approximately $8.08 billion. The five leading banana-exporting countries in 2009 were Ecuador, Colombia, the Philippines, Costa Rica, and Guatemala. Together, they accounted for approximately 84 percent of the global banana exports in 2009. Ecuador is by far the main supplier of bananas in the world market, with exports of 5.7 mmt in 2009, which is equivalent to 38 percent of the total volume of bananas traded that year. Next in line is Colombia, with a market share of 13.2 percent, followed by the Philippines (11.7%), Costa Rica (11.5%), and Guatemala (9.9%).
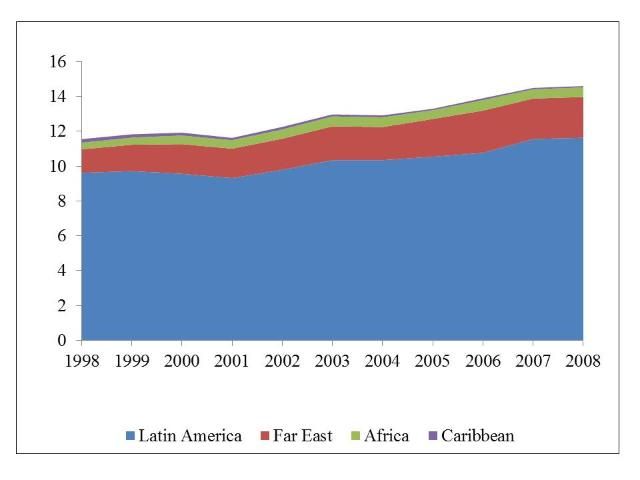
Banana is the second most tradable fresh fruit. By region, Latin America is the world's top supplier of bananas, supplying 83.2 percent of the gross fresh bananas exported in 2009, followed by the Far East at 12.8 percent, Africa at 3.4 percent, and the Caribbean at 0.4 percent (Figure 2). Exports from the Caribbean have been steadily decreasing due to the loss of preferential treatment after the liberalization of the EU (European Union) market.
Credit: FAOSTAT (Food and Agriculture Organization of the United Nations
Main Markets for Fresh Bananas
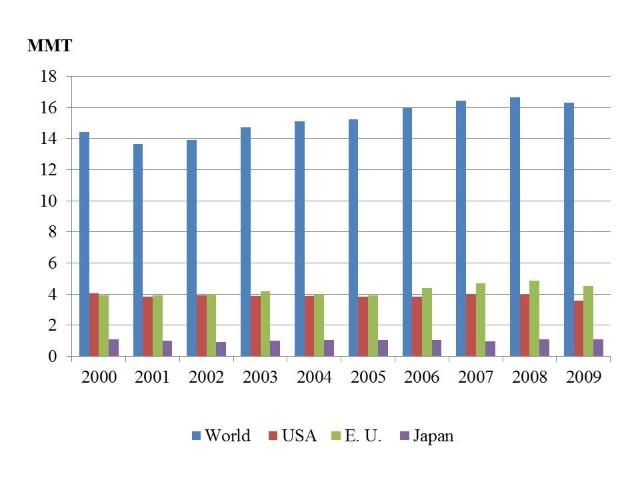
Global imports of fresh bananas have followed a long-term upward trend, reaching 16.3 mmt in 2009. The 2009 figure represents an increase of 13 percent above the 14.4 mmt exported in 2000 (Figure 3). As in the case of exports, imports of bananas are concentrated. In 2009, the United States, the European Union, and Japan accounted for about 56 percent of the total world's fresh banana imports. While imports of bananas to the United States and Japan have remained relatively flat over the period 2000 to 2009, imports to the European Union have increased by 15.6 percent, from 3.9 mmt in 2000 to 4.5 mmt in 2009.
Credit: FAOSTAT (Food and Agriculture Organization of the United Nations)
The EU banana market is controlled by custom tariffs and market intervention. For example, the European Union imposes tariffs on bananas from Latin America while allowing bananas imported from the African, Caribbean, and Pacific (ACP) countries to enter duty-free. This caused the widely known banana trade war, which resulted in the European Union cutting duties on bananas from Latin America gradually to 144 Euros per mmt by 2016 from the current 176 Euros per mmt.
World Market Structure for Fresh Bananas
The world's fresh banana market is characterized as an oligopolistic market, with only a few multinational companies (MNCs) engaged in the purchase, transport, and marketing of the fruit. Typically, these companies are integrated vertically; they own or contract plantations, own sea transport and ripening facilities, and have their own distribution networks, which gives them considerable economies of scale and market power in selling bananas.
The world's three largest producers and marketers of fresh bananas are Dole Food Company, Chiquita Brands International, and Del Monte Fresh Produce. Each of these companies owns banana plantations in most of the banana-producing regions in the world.
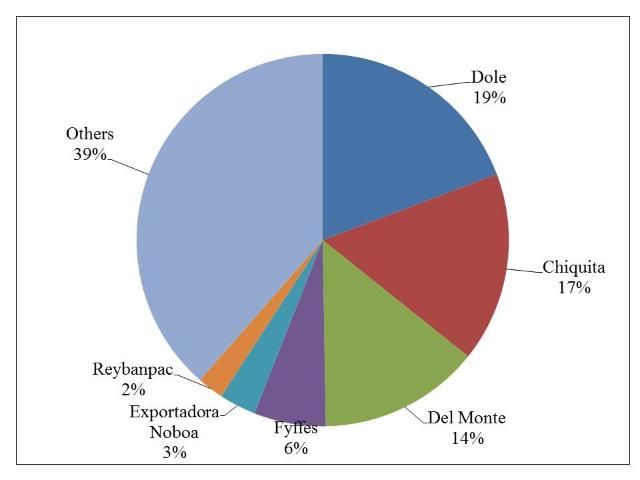
Figure 4 shows that the estimated market share of the six major banana producers/marketers in 2009 was 61 percent as follows: Dole Food Company (19%), Chiquita Brands International (17%), Del Monte Fresh Produce (14%), Fyffes (6%), Exportadora Bananera Noboa (3%), and Reybanpac (2%).The estimated market share of all other companies in 2009 was 39 percent. These estimates are based on public data (companies' annual reports and websites).
Credit: FAOSTAT (Food and Agriculture Organization of the United Nations)
US Market for Fresh Bananas
Unlike the EU market, the US banana market is free of tariffs or quantitative import restrictions, making it a very competitive market. Measured by value or volume, banana is still the major fresh fruit imported to the United States. In 2000, total shipments of bananas to the United States were valued at $1.02 billion, representing 32 percent of the total value of fresh fruit imports that year (Figure 5). By 2010, the import value of fresh bananas had risen to $1.64 billion, a 61 percent increase over the 2000 figure. The observed absolute increase in the value of banana imports was mainly caused by the increase in unit price stemming from a weak US dollar, and was not a result of increased volumes. As shown in Figure 6, the total supply of fresh bananas remained relatively flat over the period 2000 to 2009 at around 4.0 mmt. This implies that in general the US fresh banana market has become saturated. This is further evidenced by the slight decline in per capita consumption, down from 12.9 kilograms in 2000 to 11.2 kilograms per capita in 2009. This decline could be caused by consumers shifting their fruit expenditures from bananas to other fresh fruits (Figure 6). As discussed below, even though the fresh banana market in general can be regarded as a mature market, the situation is completely different when it comes to organic bananas.
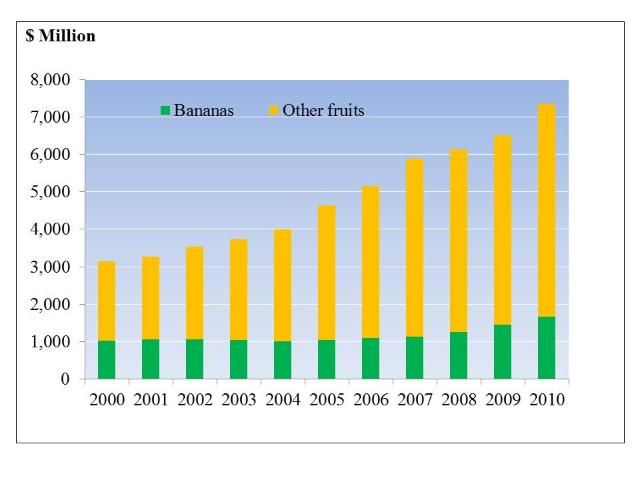
Credit: USDA/FAS (United States Department of Agriculture Foreign Agricultural Service)
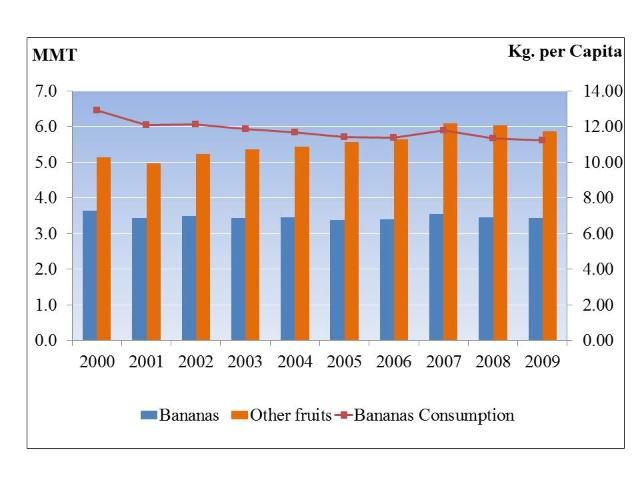
Credit: USDA/ERS (United States Department of Agriculture Economic Research Service)
Main Suppliers of Fresh Bananas
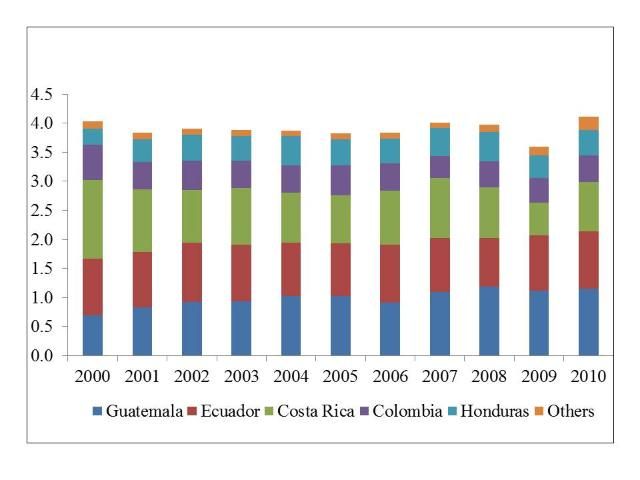
The main suppliers of bananas to the US market are Guatemala, Ecuador, Costa Rica, Colombia, and Honduras. In 2010, these five countries shipped an estimated 3.9 mmt of fresh bananas to the United States, accounting for 94 percent of total US banana imports (Table 1; Figure 7). Guatemala is the main supplier of fresh bananas to the United States, with a market share of 28 percent during 2010. Guatemala overtook Costa Rica as the main banana supplier to the US market in 2004. Guatemalan banana exports to the United States steadily rose over the period, increasing from 0.68 mmt in 2000 to 1.15 mmt in 2010. The United States has become an important market for Guatemalan bananas, accounting for 85–90 percent of that country's total banana exports. Ecuador has maintained its relative position as the second largest supplier of fresh bananas to the United States, with a market share of 24 percent. Bananas exported from Ecuador to the United States in 2010 totaled 0.98 mmt. In contrast, Costa Rica's banana exports to the United States declined considerably over the period, from 1.36 mmt in 2000 to 0.56 mmt in 2009, before recovering to 0.85 mmt in 2010. Costa Rica now accounts for 21 percent of the US banana import market, down from 34 percent in 2000. The decline in Costa Rican banana exports to the US market is due to a combination of factors, including bad weather that disrupted production and new opportunities to sell to the EU market. Currently, the United States accounts for only about 40 percent of Costa Rica's total banana exports. The other major suppliers of bananas to the United States are Colombia and Honduras, each with shares of approximately 11 percent. As shown in Table 1, banana exports from the Dominican Republic to the US market have been negligible and have shown a declining long-term trend. In 2010, the Dominican Republic exported only 139 tonnes of bananas to the US market, down from a peak of over 7,000 tonnes in 2001. Among other factors, the decline has been due to the decision to focus on the more profitable EU market.
The main conventional banana brands marketed in the United States are Dole, Chiquita, Del Monte, Turbana (Uniban), and Bonita (Exportadora Noboa). Because of the lack of publicly available data, it is not possible to estimate the market share for conventional bananas. Many of the companies will not disclose this information or do so only on a limited regional basis. The only company that gives an estimated market share is Dole, which claims to be the number one brand of bananas in the United States, with an estimated market share of 35 percent.
Figure 8 shows the import pattern of bananas into the US market. In general, volumes tend to decline in the summer months due to increased competition from other fruits in the market. For example, the sharp decline in supply from July to September 2009 was due to exceptionally bad weather in South America as heavy flooding destroyed plantations in Costa Rica and Ecuador.
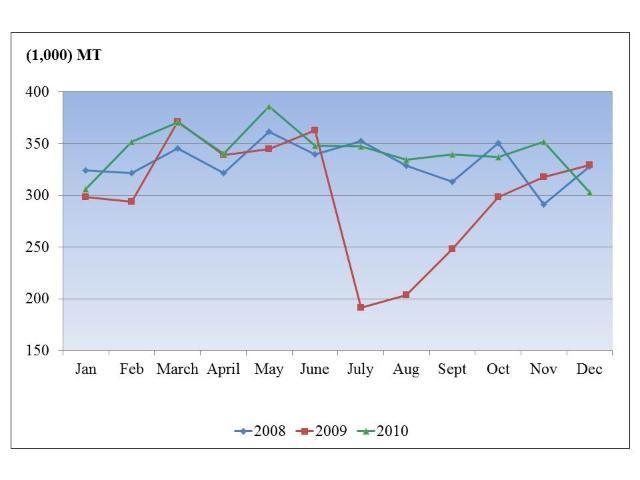
Credit: USDA/FAS United States Department of Agriculture Foreign Agricultural Service), compiled by authors
US Market for Organic Food Products
The United States is the largest single-country market for organic food products. Sales of organic food in the United States have been on an upward long-term trend since 2000 (Figure 9). According to the Organic Trade Association (OTA), US retail sales of organic products reached $24.8 billion in 2009, corresponding to a fourfold increase over the 2000 sales. Sales of organic food products in 2009 represented about 3.7 percent of the total food sales in the United States, which is a significant net increase compared to the previous level of 1.1 percent in 2000. Examined by food categories, the top three organic food categories sold in the United States in 2009 were Fruits and Vegetables (38%), Dairy (15%), and Breads and Grains (11%).
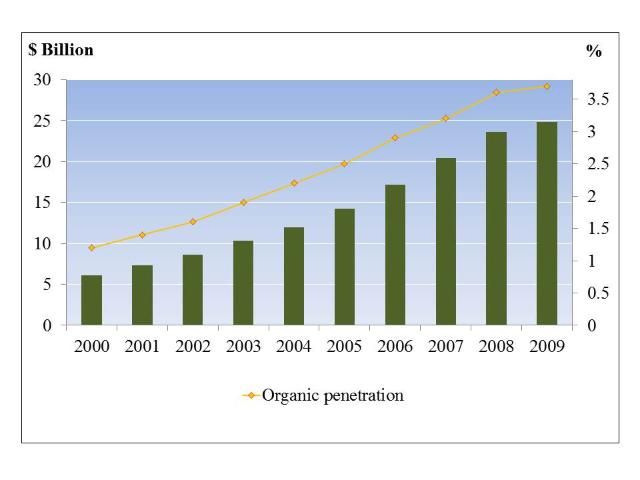
Credit: OTA (Organic Trade Association) 2010
US Market for Organic Bananas
With the exception of Peru and the Dominican Republic, whose exporting agencies regularly publish such export data, countries do not make available statistics regarding imports/exports of organic bananas. Quantities of organic bananas imported from Colombia and Ecuador had to be estimated based on literature and industry sources. Based on industry sources, the US market for organic bananas in 2010 was estimated at 123,460 tonnes (6,789,750 boxes), or 3 percent of the total volume of fresh banana imports. With a national average price of $23.79 per box at the wholesale level and a retail price of $1.74 per kilogram in 2010, the organic banana industry was worth about $161.5 million at the wholesale level and $214 million at the retail level.
Whereas the demand for conventional bananas remained relatively flat over the first decade of the twenty-first century, the demand for organic bananas increased markedly. For example, between 2000 and 2010, organic banana imports grew fourfold, from 27,000 tonnes to over 123,000 tonnes (Figure 10). Industry sources have reported that organic bananas represent one of the fastest growing commodities among organic produce, with demand outstripping supply.
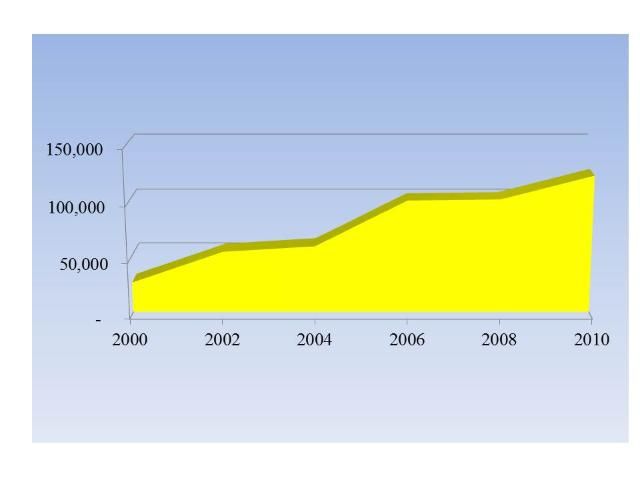
Credit: Liu, exporting agencies in Peru and Dominican Republic, and authors' calculations for Ecuador and Colombia
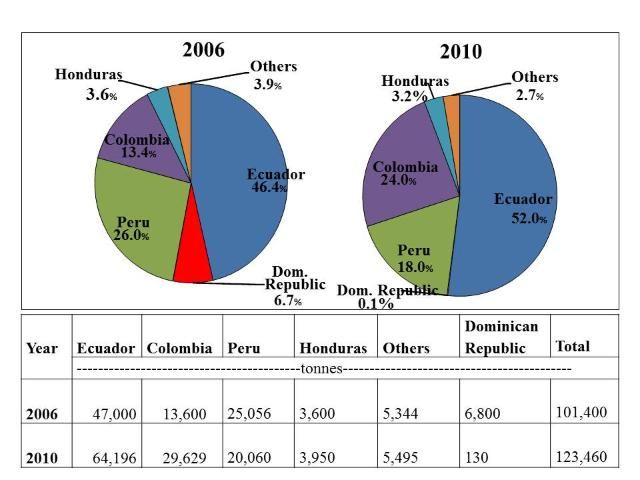
The main suppliers of organic bananas to the US market are depicted in Figure 11 for the corresponding years 2006 and 2010. Not surprisingly, Ecuador, the leading world exporter of bananas, is the main supplier of organic bananas to the United States. Between 2006 and 2010, Ecuador increased its market share of the US organic banana supply from 46 percent to 52 percent. Industry sources point out that bananas from Ecuador are of a very high standard and are relatively cheap.
Credit: USDA/AMS (United States Department of Agriculture Agricultural Marketing Service), compiled by authors
Colombia, which was the third leading supplier of organic bananas to the US market in 2006, has switched positions with Peru and now ranks as the second major supplier of organic bananas to the US market, with an estimated market share of 24 percent in 2010. The improved market penetration on the part of Colombia is due to major investments in organic banana plantations in that country.
The third leading supplier of organic bananas to the US market is Peru, with a market share of 18 percent in 2010, down from 26 percent in 2006. In contrast to production in Colombia, most of the organic banana production in Peru occurs on small holdings averaging less than one hectare. This has made the formation of cooperatives in Peru necessary for its farmers to compete in the larger marketplace. With help from its government, Peru has shifted from conventional to organic banana production, and as a consequence only exports organic bananas to the United States, about 45 percent of the total organic export share.
Even though the Dominican Republic is one of the world's leading exporters of organic bananas, it is not a significant player in the US organic market. Its market share of nearly 7 percent in 2006 dropped to less than 1 percent in 2010.
Using innovative strategies, Dole has become the leading marketer of organic bananas in the United States. The company has launched a website dedicated exclusively to its organic products (https://www.dole.com/en/produce/organics). Consumers can virtually see where a Dole product originated by visiting the company's website to view photos of the farms that sell to Dole, and by typing in the three-digit farm code listed on the fruit sticker, they can see the particular farm that grew the fruit they bought at the store. In addition, the website provides information for consumers to learn more about how Dole Organic is helping banana workers achieve a higher living standard and a more promising future and to view growers' organic certifications online (Dole Annual Report 2009). According to the company's website, Dole imports organic bananas from Colombia, Costa Rica, the Dominican Republic, Ecuador, and Peru. Unconfirmed reports indicate that Dole accounts for as much as 60 percent of the US organic market. Chiquita is the second largest organic banana exporter selling to the US market. Chiquita sources bananas from its own plantations and independent growers in Colombia, Ecuador, Honduras, and Peru. Other major organic banana exporters are Fresh Del Monte and Daabon Organics USA.
Price Analysis for Fresh Bananas in the United States
Prices of Conventional and Organic Bananas at the Wholesale Market
Data on wholesale prices for organic and conventional bananas are available for selected US markets from the Agricultural Marketing Service (AMS) of the United States Department of Agriculture (USDA). Because of the scarcity of data, we have chosen New York City (East Coast) and San Francisco (West Coast) to represent the wholesale markets on both US coasts.
Figure 12 shows monthly wholesale prices for organic and conventional bananas in the New York City market. As shown in Figure 12, there appears to be a high positive correlation between prices for organic and conventional bananas, implying that both prices tend to move in the same direction. The price of bananas in general increased significantly in 2008 because of smaller supplies in major producing countries and higher transportation costs due to increases in fuel prices (Dole and Fresh del Monte Annual Reports 2008). During 2007 to 2010, the price of organic bananas fluctuated between $18.75 and $29 per box, a difference of $10.25, while the price of conventional bananas fluctuated between $12.55 and $24.5 per box, a difference of almost $12 per box. The average price for organic bananas during the time reported was $23.9 per box while the average price for conventional bananas was $17.72 per box, representing an average price premium of about $6.18 (34.9%) per box. In general, prices tend to be higher in the earlier months of the year and then decline in the latter part of the year. The 2010 prices were higher than those of 2007 but lower than prices in both 2008 and 2009.
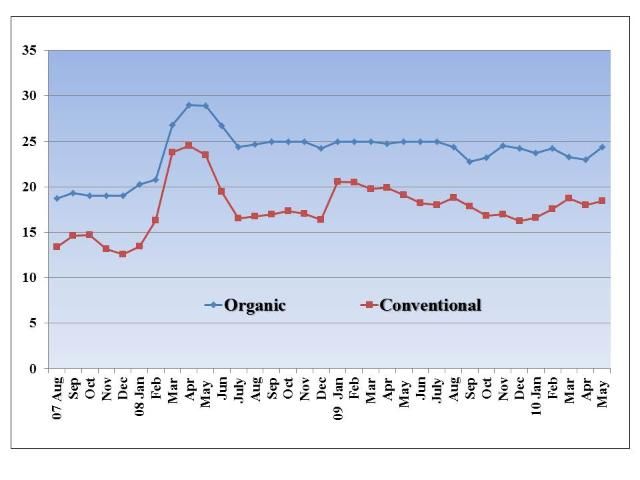
Credit: USDA/AMS (United States Department of Agriculture Agricultural Marketing Service), compiled by authors
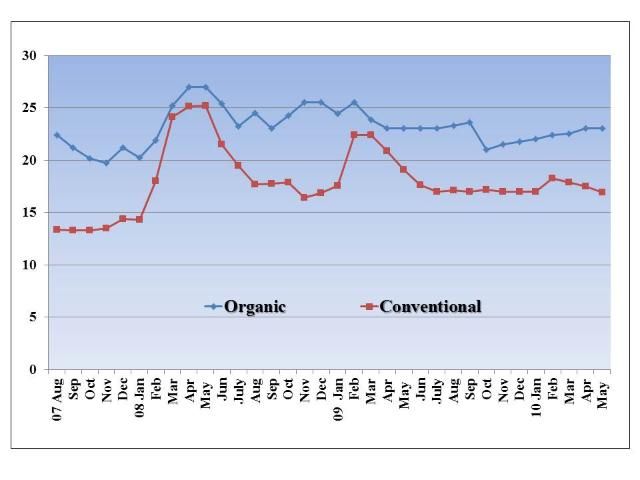
The monthly wholesale prices of organic and conventional bananas at the San Francisco market are shown in Figure 13. Again, it is clear that the prices for both types of bananas tend to move in the same direction. Between 2007 and 2010, the price of conventional bananas fluctuated between $13.30 and $25.20 per box, a difference of $11.90 per box, while the price of organic bananas fluctuated between $19.75 and $27.00 per box, a difference of $7.25, again implying more stable prices for organics over the period. During that period, the average price for a box of conventional bananas was $17.32 while the average price for a box of organic bananas was $22.63, resulting in an average price premium of $5.32 (30.6%) per box. The price premium organic bananas command over conventional bananas in the San Francisco market fluctuated from a low of $1.10 to a high of $9.1 per box.
Credit: USDA/AMS (United States Department of Agriculture Agricultural Marketing Service)
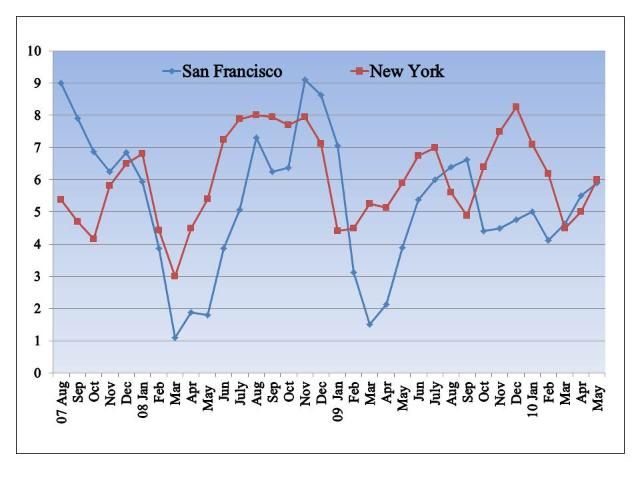
Figure 14 compares the price premiums in the New York City and San Francisco markets over the period of August 2007 to May 2010. Price premiums in the New York City market appear to be more stable than those in the San Francisco market, New York prices ranging from $3 to $8 per box (a difference of $5 per box). Organic bananas in the San Francisco market had a much wider margin, ranging from $1.1 to $9.1 per box (a difference of $8 per box). In percentage terms, price premiums in the New York City market ranged from 13 percent to 51 percent while those in the San Francisco market ranged from 5 percent to 67 percent over the same period. Although the highest premium was obtained in the San Francisco market, note that, on average, the New York City wholesale market paid a higher premium ($6.04 per box) for organic bananas compared to the San Francisco market ($5.35 per box) for the time period reported. Based on the data provided, there is a 65 percent likelihood that the price premium in the New York market would be greater than that in the San Francisco market. Moreover, suppliers from the Dominican Republic would have to factor in higher transportation costs than suppliers from Mexico or South America.
Credit: USDA/AMS (United States Department of Agriculture Agricultural Marketing Service) 2011
Demand Estimates for Fresh Bananas in the US Market
Several studies have focused on consumer perceptions and preferences toward organic foods. Some studies have estimated the willingness to pay for organic products, but these studies used stated preference data rather than market data. Recently, however, Lin et al. (2009) used retail purchase data to investigate the US demand for organic and conventional fresh fruits. The study included five major conventional and five major organic fruit categories (apples, bananas, grapes, oranges, and strawberries) and two catch-all categories for other conventional and other organic fruits, for a total of 12 fruit categories. It was found that the demand for organic fruits is price elastic whereas the demand for conventional fruits is price inelastic.
The estimated own-price elasticities for organic bananas and conventional bananas are –3.19 and –0.70, respectively. As expected, these elasticities are negative and highly significant at the 1 percent level. Results suggest that with a 1 percent price reduction, the quantity demand for organic bananas is expected to increase by 3.19 percent while the quantity demand for conventional bananas is expected to increase by 0.7 percent. In other words, the own-price elasticity of demand for organic bananas is elastic, which means that the demand for organic bananas is very responsive to changes in price. A possible explanation for this lies in the fact that there are many "marginal" organic banana consumers. Such consumers will purchase organic bananas as long as they remain within a given price range. An increase in the price of organic bananas will result in a disproportionate fall in the quantity of organic bananas purchased by "marginal" consumers. On the flip side, a small lowering of the price of organic bananas will bring about a substantial increase in the quantity of organic bananas demanded. This bodes well for the future of organic bananas in the United States, where prices are likely to fall slightly over the coming years as availability increases.
The study also estimated the income elasticity of demand for organic bananas, which measures the responsiveness of the demand for a good to a change in the income of people demanding that good. The estimated income elasticity for organic bananas was 0.81, implying that an increase in disposable income will lead to a rise in demand. The fact that the income elasticity is greater than zero but less than 1 also implies that a 1 percent decline in disposable income will cause the demand for organic bananas to fall but by less than 1 percent, and vice versa (Figure 9).
In general, the above findings imply that an increase in disposable income will result in an increase in the quantity of organic bananas demanded. Also, the fact that the demand for organic bananas was found to be price elastic implies that any decline in prices will result in an expansion of the market as quantity demanded will increase.
Conclusions
The United States is the largest single-country importer of fresh bananas. With a per capita consumption of about 25 pounds, the banana market appears to be saturated. However, consumption of organic bananas in the United States is increasing. The US market is well supplied by a network of banana-producing countries and a set of Multinational Corporations. US producers in Hawaii and Florida will find it extremely difficult trying to compete with these low-cost producers of the Cavendish variety. Any expansion of the banana production in the United States should focus on the niche market for organic bananas and specialty varieties as Florida growers do.
References
Dole Food Company, Inc. 2010. Dole Worldwide Operations. http://www.dole.com/servedocument.aspx?fp=documents/dole/DoleFacilities_Complete.pdf [4 April 2013].
Dole Food Company. Annual Report 2009. http://investors.dole.com/phoenix.zhtml?c=231558&p=irol-reportsannual
Dole Food Company. Worldwide Operations Report 2009. http://investors.dole.com/phoenix.zhtml?c=231558&p=irol-reportsannual [4 April 2013].
FAO. Banana Statistics 2009. ftp://ftp.fao.org/docrep/fao/meeting/018/k6853e.pdf
Fresh Del Monte Produce, Inc. 2010. Bananas. https://delmontefresh.com/products/bananas
Fresh Del Monte Produce. Annual Report 2009. https://www.annualreports.com/HostedData/AnnualReportArchive/f/NYSE_FDP_2009.pdf [12 October 2022].
Lin, B.H., S.T. Yen, C.L. Huang, and T.A. Smith. 2009. US demand for organic and conventional fresh fruits: The roles of income and price. Sustainability 1(3):464-478.
Liu, P., 2008. Certification in the value chain for fresh fruits: The example of the banana industry. Food and Agriculture Organization of the United Nations, Rome, Italy. https://www.fao.org/3/i0529e/i0529e00.pdf [12 October 2022].
Organic Trade Association 2010. US Organic Industry Overview. http://www.ota.com/pics/documents/2010OrganicIndustrySurveySummary.pdf
Schupska, S. 2008. Can Georgia develop a viable banana industry? Southeast Farm Press, December 10. https://www.farmprogress.com/orchard-crops/can-georgia-develop-viable-banana-industry [12 October 2022].
USDA/AMS. Fruit & Vegetable Market News. https://marketnews.usda.gov/mnp/fv-home [12 October 2022].
USDA/ERS. Fruit and Tree Yearbook 2010. https://usda.library.cornell.edu/concern/publications/6969z076v?release_start_date=2010-01-01&release_end_date=2010-12-31&locale=en [12 October 2022].
USDA/FAS. Global Agricultural Trade System GATS. https://apps.fas.usda.gov/gats/Default.aspx [12 October 2022].